Low rates spur credit markets as banks lose ground
Over the past few months, monetary accommodation continued to drive financial markets. In major advanced economies, bonds and stocks shrugged off the summer sell-off and posted gains on the view that low policy rates and large-scale asset purchases would persist over the medium term. Thus, markets took in their stride a two-week US government shutdown and uncertainty over a US technical default. By contrast, country-specific strains weighed on several large emerging market economies, preventing a full recovery of local asset valuations and capital flows.1
From a longer-term perspective, recent developments confirmed a trend benefiting large corporate borrowers with direct access to credit markets. Since mid-2012, low interest rates on benchmark bonds have driven investors to search for yield by extending credit on progressively looser terms to firms in the riskier part of the spectrum. This investment strategy, which has squeezed credit spreads, has so far been supported by low default rates on corporate bonds.
The credit environment has benefited large non-financial corporates more than banks domiciled in advanced economies. Struggling to regain markets' confidence during the past five years, these banks have consistently faced higher borrowing costs than non-financial corporates with a similar credit rating. While the cost gap narrowed more recently, especially in the United States, it continued to exert upward pressure on bank lending rates. This prompted large non-financial firms to resort directly to debt markets, thus spurring corporate bond issuance. As a result, markets eclipsed banks as a source of new credit to corporates in the euro area.
Euro area banks faced greater market scepticism than their peers in other advanced economies. To some extent, low valuations reflected concerns over the quality of these banks' balance sheets, for which the reported share of non-performing loans has been on the rise since the financial crisis peak. To restore market confidence and prepare for its upcoming supervisory function, the ECB announced a comprehensive assessment of the euro area's banking sector, and committed to disclose its findings and require corrective actions from ailing banks.
The low interest rate environment persists
The tightening in global financial conditions from May to July partly reversed after the Federal Reserve surprised markets on 18 September with its decision to postpone "tapering", the phasing-out of large-scale asset purchases (Graph 1). As the summer sell-off abated, market participants saw several factors weighing against near-term monetary tightening. These included low job growth and labour market participation, inflation below target, and the continuing effect of US fiscal retrenchment. The US government shutdown of 1-16 October contributed to the subdued outlook. During this episode, maturing Treasury bills priced in a rising probability of a US technical default (Graph 1, left-hand panel). Even so, bond volatility rose less than equity volatility. These effects dissipated when Congress approved a funding bill on 16 October and raised the debt ceiling up to February 2014.
The perceived postponement of tapering gave rise to further gains in global bond and equity markets. The 10-year Treasury bond yield fell from its early September peak of 3% to 2.5% in late October, with European bond markets matching more than half of this movement (Graph 1, centre panel). The prospect of continued asset purchases pushed estimates of the term premium on US Treasuries back into negative territory, from 0% to -0.2%.2 The S&P 500 reached an all-time high on 15 November, after the nominated Fed Chair signalled her commitment to the policy stance in place. Since the beginning of the year, US equities have outperformed bonds on the view that the foreseeable future would bring continued easing until robust growth takes hold. All the major bourses gained 10-25% from early 2013 to 27 November (Graph 1, right-hand panel).
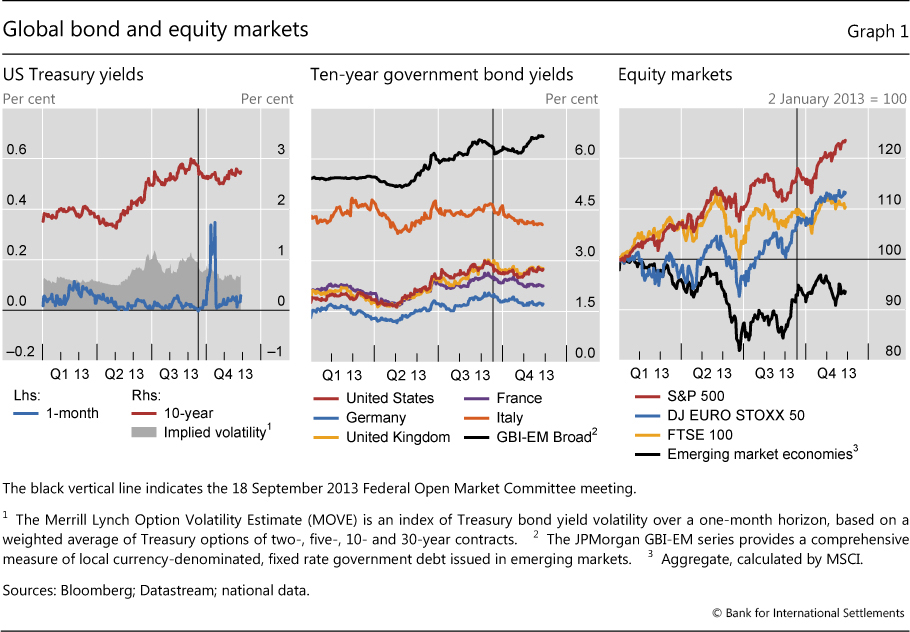
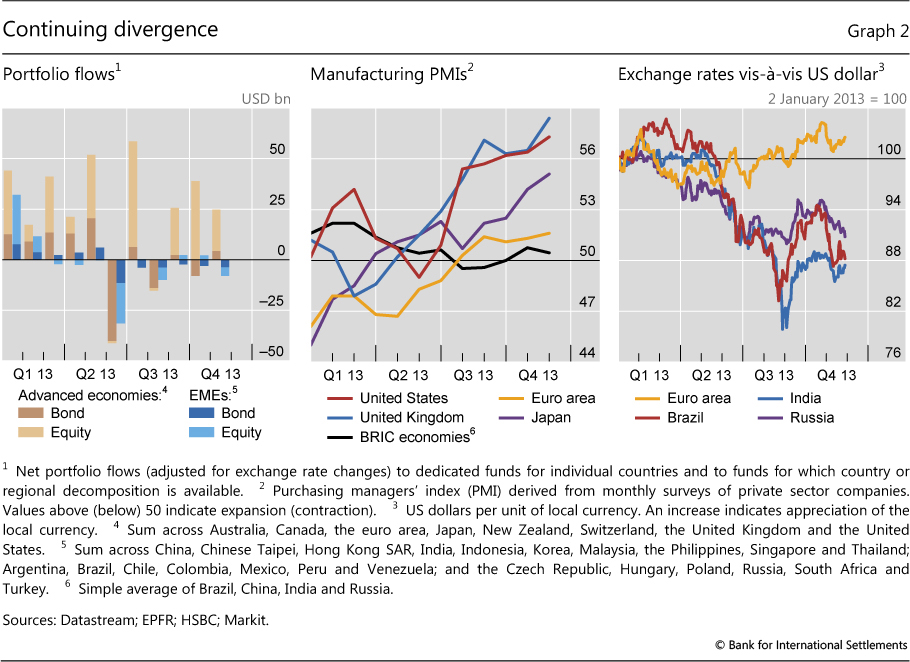
By contrast, emerging markets did not fully recover from the fallout of the summer sell-off. Government bond yields and credit spreads remained elevated, and equity indices recouped only part of their losses (black lines in Graph 1). Likewise, emerging market bond funds saw outflows every month from June to November, as did equity funds save for modest inflows in September and October (Graph 2, left-hand panel). This subdued performance reflected in part market participants' reticence to invest in bonds worldwide, on the view that US policy tightening had only been postponed. It was also in line with the growth outlook of major emerging markets, which did not compare favourably with that of advanced economies (Graph 2, centre panel). Thus, in spite of dollar weakness in September and October, major emerging market currencies undid little of their summer depreciations (Graph 2, right-hand panel).
The ECB on 7 November cut the refinancing rate by 25 basis points to 0.25%, in response to inflation dropping to 0.7%, considerably below its objective. GDP and PMI data releases pointed to continued weakness in the euro area economy amid stubbornly high unemployment. In view of economic conditions, the ECB stated that it expected interest rates to remain at prevailing low levels for an extended period. The Governing Council also decided to continue refinancing operations with full allotment for as long as necessary, at least until mid-2015. With all central banks in the main currency areas in extended easing mode, asset prices continued to reflect the expectation of a low-yield environment for the foreseeable future.
The search for yield continues unabated
As the accommodative monetary policy stance persisted in all major currency areas, so did investors' search for yield. Low policy rates and large-scale asset purchases translated into low yields on benchmark bonds, to which investment grade assets are tightly linked. This spurred demand for assets in the riskier part of the spectrum, which promised to pay off at a higher rate. By and large, such assets have so far lived up to their promise. Narrowing credit spreads contributed to high mark-to-market returns on high-yield debt, while low default rates since the crisis peak contained credit losses. It remains to be seen, however, whether the combination of tight spreads and low default rates is sustainable.
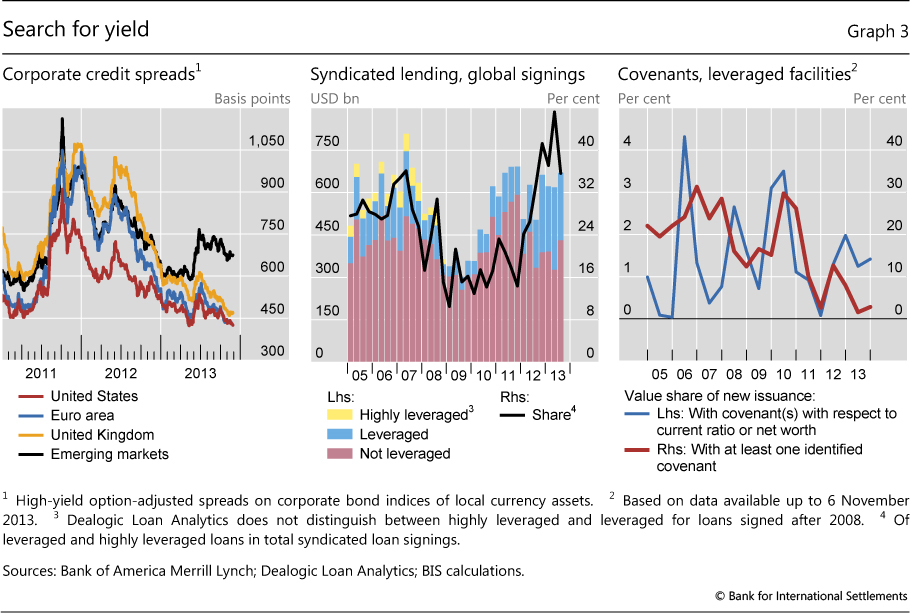
The search for yield left its mark on price-based indicators, such as credit spreads in major advanced economies. During the bond market sell-off in May and June, these indicators pointed to sweeping rises in the cost of credit and greater differentiation among borrowers in different risk categories. However, this phenomenon proved to be short-lived. For instance, high-yield spreads on the US, euro area and UK local currency markets resumed their downward trend in late June (Graph 3, left-hand panel). By late November, these spreads stood 300-600 basis points below their 2012 peaks and 200-300 basis points above their pre-crisis troughs in 2006-07.
The search for yield was equally evident in quantity-based indicators. In the syndicated loan market, "leveraged" loans - granted to low-rated, highly leveraged borrowers - accounted for roughly 40% of new signings from July to November (Graph 3, centre panel). Remarkably, throughout most of 2013, this share was higher than during the pre-crisis period from 2005 to mid-2007. This was the result of both higher volumes of riskier loans (blue bars) and lower volumes in the safer part of the spectrum (red bars). In parallel, investors' drive towards high-yield credit resulted in a gradually falling share of those syndicated loans that feature creditor protection in the form of covenants (Graph 3, right-hand panel).
The trend towards riskier credit was fairly general. It spurred, for example, the market for payment-in-kind notes, which give the borrower an option to repay lenders by issuing additional debt. Investors' renewed interest in these instruments resulted in more than $9 billion of new issuance over the first three quarters of 2013, one third higher than the overall issuance volume in 2012. This rise occurred despite evidence of the riskiness of payment-in-kind notes: roughly one third of their pre-crisis issuers defaulted between 2008 and mid-2013. The search for yield was also evident in the surge of mortgage real estate investment trusts (mREITs), which fund long-term assets with short-term repos. Following years of rapid expansion, their size peaked shy of $500 billion in September 2012.3 While these investment trusts hold less than 5% of agency mortgage-backed securities outstanding, their exposure to interest rate and liquidity risk has attracted regulators' attention. Similarly, industry reports underscored the growing share of debt in funding private equity takeovers. In the United States, this share increased steadily after 2009 to reach two thirds in October 2013, a level similar to that in 2006-07. For their part, European banks took advantage of the borrower's market by stepping up issuance of subordinated debt, thus increasing the cushion that insulates their senior creditors from the fallout of potential future distress.
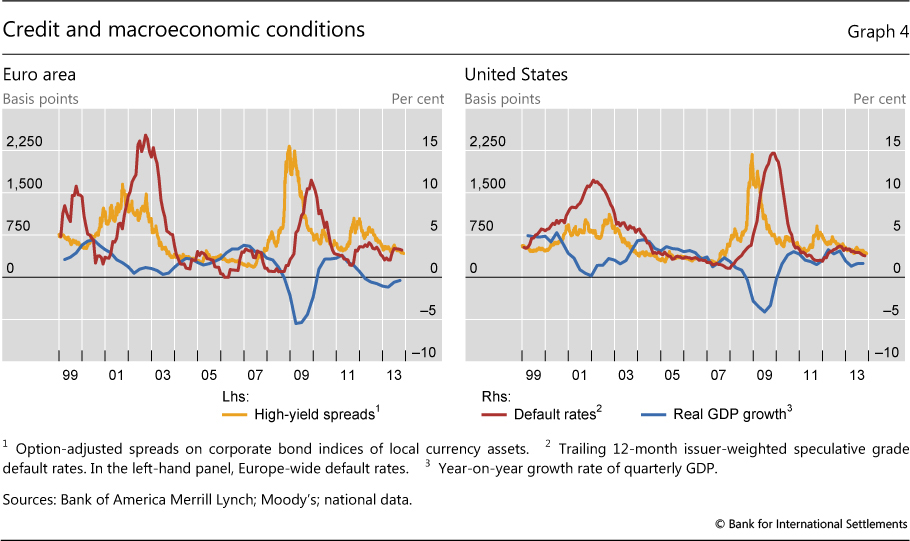
Aggregate statistics on corporate default rates appear to justify the strategy of granting increasingly cheaper credit to the riskier borrowers. After a brief spike in 2009-10, default rates plummeted and stayed low for three years (Graph 4). At about 3% in 2013, the one-year default rate of speculative grade borrowers in the United States and Europe was only 1 percentage point above its average level between 2005 and 2008. On the basis of such statistics, industry analysts have constructed historical credit loss scenarios and have used them to interpret recent spreads. It turns outs that these spreads - albeit low - would be generally sufficient to compensate for potential credit losses that are in line with typical historical experience.
However, in addition to reflecting perceptions of credit risk, spreads may also drive default rates. A low interest rate environment naturally fosters cheap and ample credit. Coupled with the reluctance of crisis-scarred creditors to recognise losses, this can facilitate refinancing and keep troubled borrowers afloat. If such a process is indeed at work, its sustainability will no doubt be tested by the eventual normalisation of the monetary policy stance.
The ongoing search for yield has coincided with the breakdown in certain regions of a previously stable relationship between credit market and macroeconomic conditions. Over the 15 years ending in 2011, low or negative real growth had gone hand in hand with high default rates and credit spreads (Graph 4). This pattern prevailed also more recently in the United States. By contrast, default rates in the euro area actually fell from 2012 onwards, even as the region entered a two-year downturn and the share of banks' non-performing loans trended upwards (see below). Similarly, credit spreads in emerging markets dropped between late 2011 and mid-2013, just when local economic growth showed clear signs of weakness. This suggests that investors' high risk appetite may have been boosting credit valuations in capital markets, keeping a lid on default rates.
Banks lose ground to non-financial corporates
Upbeat investor sentiment contrasted with lingering unease about banks. Over the past seven years, banks had to face higher funding costs than large non-financial corporates, which made increasing use of their direct access to credit markets. One reason why banks lost their previous funding advantage stems from the rapid deterioration of their intrinsic health during the financial crisis. In addition, more recently, perceived and announced reductions in official sector support increased banks' riskiness in the eyes of investors, even as these institutions strengthened their capital and liquidity positions. Uncertainty about banks' financial condition - including their exposure to sovereign risk - also played an important role. (See the box below for the regulatory treatment of sovereign exposures in the Basel capital framework.)
Relative funding costs and debt issuance
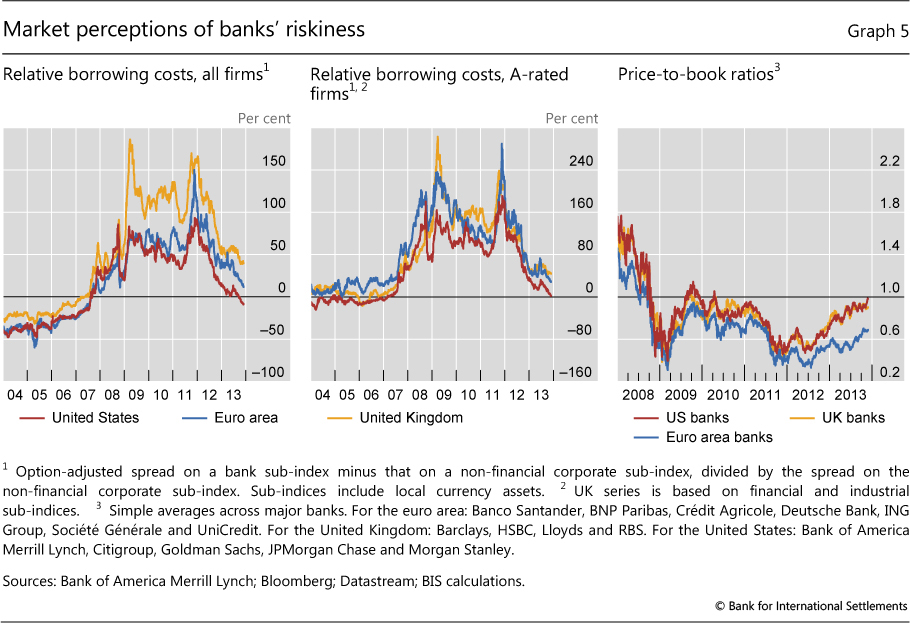
The financial crisis of 2007-09 marked the end of an era in which banks had had a funding advantage. In the run-up to the crisis, spreads on bank bond indices in advanced economies were typically 20-30% lower than those on non-financial corporate indices (Graph 5, left-hand panel). The gap reversed sign in 2007, and bank spreads peaked 95% above non-financial corporate spreads in the United States at end-2011; the corresponding numbers were 150% for both the euro area and the United Kingdom. Thereafter, the percentage difference in borrowing costs generally narrowed. By November 2013, it had disappeared in aggregate for US institutions but had remained at 10% and 40% for euro area and UK institutions, respectively.
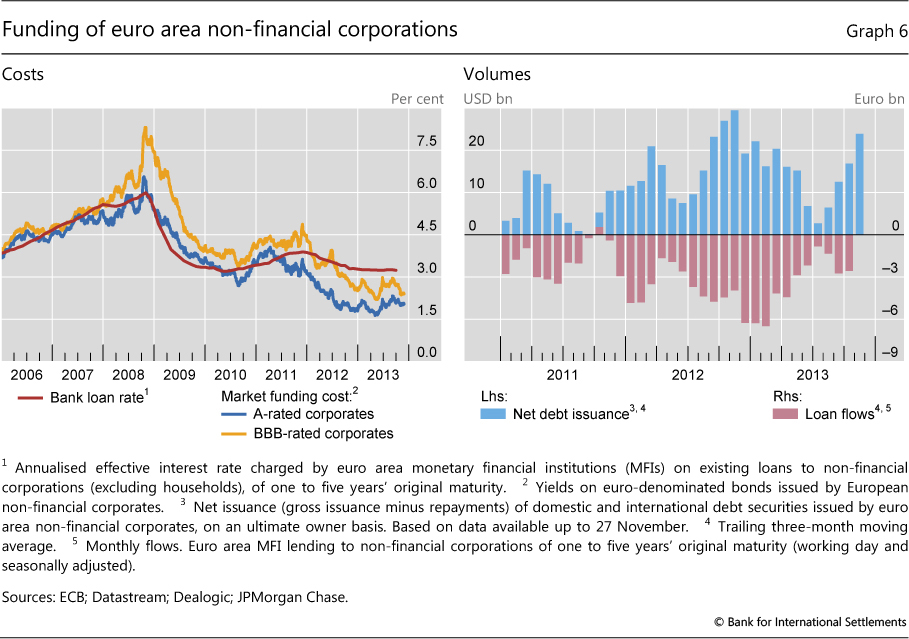
The erosion of banks' funding advantage limits their effectiveness as intermediaries. There are indications that euro area banks, for instance, passed on some of their relatively high borrowing costs. The average interest rate on euro area bank loans stalled at levels above 3% over the past three years, in spite of falling policy rates. As the cost of funding in bond markets trended downwards, large corporates increasingly faced incentives to bypass banks and tap markets directly (Graph 6, left-hand panel). It is thus hardly surprising that net issuance in European debt markets rose sharply in 2012 (Graph 6, right-hand panel).4 Strong issuance by US and emerging market corporates underlines that this trend was global in nature. A similar surge in global corporate bond issuance took place when markets rebounded from the financial crisis after March 2009.
The composition of corporate financing shifted towards market funding as a result. A comparison between issuance volumes of corporate debt and those of syndicated loans suggests that bond markets in Europe have recently outpaced banks in the provision of funding: more than 50% of cumulative funding raised by euro area corporates since early 2011 was met in securities markets rather than through syndicated loans. Moreover, banks in the euro area provided no new direct lending in the aggregate, and the stock of corporate loans fell a cumulative 15% during this period. Markets thus eclipsed banks as a source of new credit to euro area corporates. In the United States, syndicated lending kept pace with corporate debt issuance, leaving the share of market funding unchanged near 33%.5
Perceptions of weak and uncertain health weigh on banks
Uncertainty about banks' riskiness appears to have been an important reason for their relatively high funding costs over the past years. This can be seen by looking at firms - banks and non-banks - that have similar credit ratings and, thus, are expected to impose similar losses on their creditors. If expected credit losses alone drive market pricing, such institutions should face similar borrowing costs. This was indeed the case in the United States, the euro area and the United Kingdom prior to the financial crisis (Graph 5, centre panel). Thereafter, uncertainty about credit losses rose to become an important additional driver. From 2007 to 2011, its impact on risk premia pushed bank bond yields above those of similarly rated non-financial corporates. This phenomenon subsequently reversed in the United States but remained pronounced in the euro area and the United Kingdom.
Persistent uncertainty about banks manifested itself in the stock market as well. In a sample of large internationally active banks, price-to-book ratios have been less than unity for almost four consecutive years (Graph 5, right-hand panel). These ratios have been particularly low for euro area banks, dipping below 0.4 at end-2011 and at mid-2012, and standing at 0.7 in November 2013. By contrast, stock markets perceived a much brighter outlook for the non-financial sector, where price-to-book ratios remained above unity through the financial crisis and hovered around 2 in November 2013.
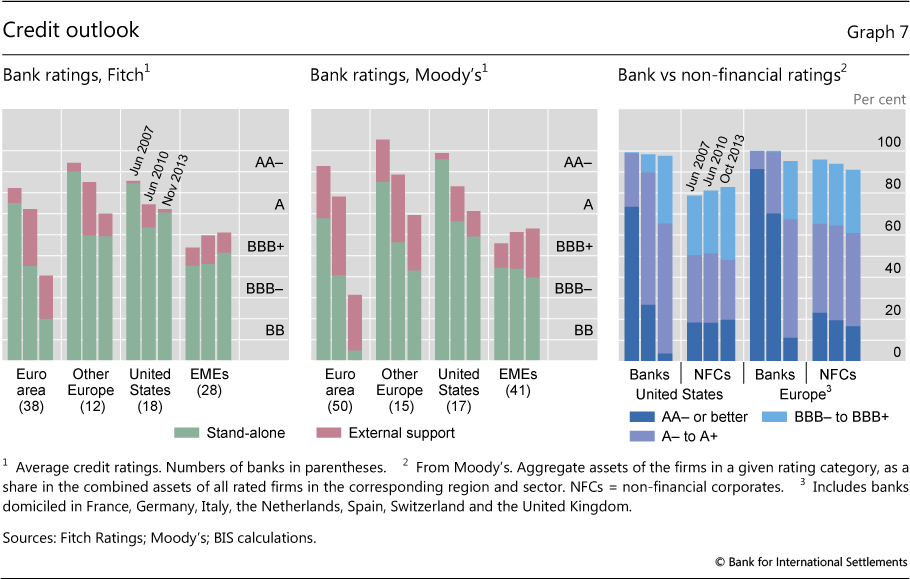
Credit ratings also express reservations about banks' financial strength. Fitch and Moody's convey this message through stand-alone ratings, which reflect banks' likelihood of default, assuming that no external support is forthcoming. Judging from these ratings, the two agencies agree that the intrinsic financial strength of banks in major advanced economies was considerably weaker in November 2013 than at mid-2007, prior to the financial crisis (Graph 7, left-hand and centre panels). They also agree that at mid-2010 the stand-alone health of the same banks had already deteriorated by two to three rating notches. While Moody's sees such deterioration as continuing in advanced economies, Fitch does not. Indeed, it reports recent worsening or stabilisation of the stand-alone ratings of European banks but a recent improvement in those of US banks.
According to rating agencies, credit risk increased also for senior bondholders and other investors in bank debt who benefit from explicit or implicit government guarantees. The increase in the value of these guarantees during the global financial crisis (expanding red bars in Graph 7) limited the concurrent decline in banks' overall ratings, ie the ratings that account for both intrinsic financial strength and external support.6 After 2010, however, a reduction in perceived government support (shrinking red bars) contributed to a deterioration of the overall ratings of banks from major advanced economies. On average, this deterioration amounted to more than three notches in the case of euro area banks, almost two notches for other European banks and a fifth of a notch to one notch for US banks.
A reduction in government support can arise for two reasons, with opposite implications for financial stability. The first is rooted in a weak financial condition of the sovereign, which impairs its capacity to rescue banks in its jurisdiction. This factor has played a role in a number of countries in the euro area's geographical periphery, which have experienced multi-notch downgrades of their sovereigns' ratings since mid-2010. In this case, the deterioration in governments' creditworthiness removes an important backstop that could stabilise the financial system under stress. The second reason is a reduction in the sovereign's willingness to support banks, as reflected in recent regulatory steps, in both Europe and the United States, to address the too-big-to-fail problem. This promotes financial stability by strengthening incentives for prudent behaviour.
Treatment of sovereign risk in the Basel capital framework
It is sometimes asserted that the Basel capital framework prescribes a zero risk weight for bank exposures to sovereigns. This is incorrect. Basel II and Basel III call for minimum capital requirements commensurate with the underlying credit risk, in line with the objective of ensuring risk sensitivity. This is the basic philosophy of the framework.
In most jurisdictions, the treatment of sovereign exposures in the banking book follows the Basel II framework, which Basel III has not changed.
 Jurisdictions may adopt one of two (or both) methodologies: the Standardised Approach, which relies on external credit ratings; and the Internal Ratings-Based (IRB) approach, which relies on banks' own risk assessments.
The most relevant standard for internationally active banks is the IRB approach. This approach has been designed bearing in mind the world's largest banks, including global systemically important banks (G-SIBs). The IRB approach requires banks to assess the credit risk of individual sovereigns using a granular rating scale, accounting for all relevant differences in risk with a bespoke risk weight per sovereign. Risk weights are primarily determined by banks' own estimates of probability of default (PD) and loss-given-default (LGD) for a given exposure. The approach does not prescribe minimum levels of PD or LGD for sovereign exposures, but it includes detailed qualitative minimum requirements. In particular, the framework requires a "meaningful differentiation" of risk.
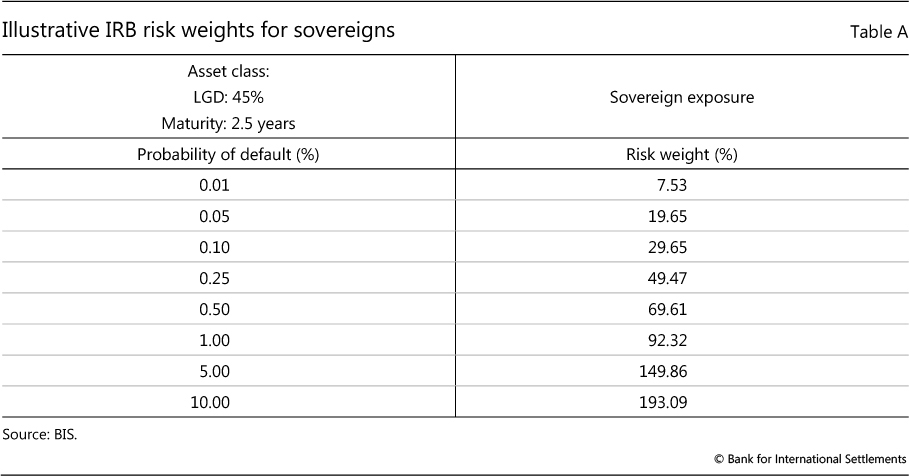
For illustrative purposes, Table A below sets out PDs and their associated risk weights for banks using the Foundation IRB approach. This variant of the IRB, in contrast to its advanced counterpart, allows banks to rely on their risk assessments for PDs but requires them to use a standard LGD of 45% set by supervisors. The PDs are subject to supervisory validation. Data collected by the Basel Committee covering 201 large banks show a weighted mean PD for sovereign exposures subject to the IRB approach of 0.1%.
The Basel framework is based on the premise that banks use the IRB approach across the entire banking group and across all asset classes. It recognises, however, that it may not be practicable for banks to implement the IRB approach across all asset classes and business units at the same time. Therefore, it allows national supervisors to permit their banks to phase in the approach across the banking group. And, subject to strict conditions, it also allows them to keep some exposures in the Standardised Approach indefinitely. For this to be the case, however, these exposures have to be in non-significant business units or in asset classes that are immaterial in terms of size and perceived risk. As a result, banks adopting the IRB approach are expected, over time, to move all material exposures to the IRB framework.
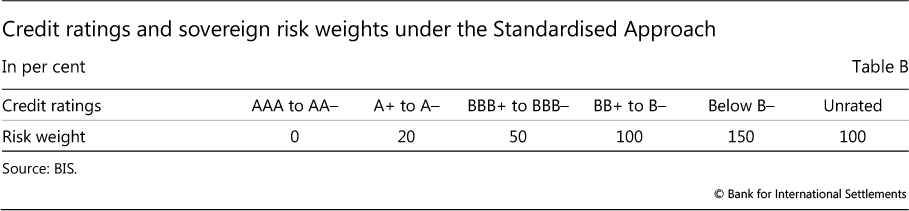
The Standardised Approach, as a rule, also prescribes positive risk weights. As shown below, based on external credit ratings, it assigns a positive risk weight to all but the highest-quality credits (AAA to AA). That said, national supervisors are allowed to exercise discretion and set a lower risk weight provided that the exposures are denominated and funded in the currency of the corresponding state.
There are significant differences in the application of the Basel rules across jurisdictions. For instance, in the United States, internationally active banks are required to implement the IRB approach; a parallel run is under way and the process is not yet finalised. As a result, for the time being, they continue to use the local version of the Standardised Approach. In the European Union (EU), authorities have allowed supervisors to permit banks that follow the IRB approach to stay permanently on the Standardised Approach for their sovereign exposures. In applying the Standardised Approach, in turn, EU authorities have set a zero risk weight not just to sovereign exposures denominated and funded in the currency of the corresponding Member State, but also to such exposures denominated and funded in the currencies of any other Member State.
As a consequence of these differences, applied sovereign risk weights vary considerably for large international banks, including global systemically important ones. In fact, the variation in sovereign risk weights is an important source of the variability in risk-weighted assets across banks. It is the national authorities' responsibility to implement the IRB approach in a manner consistent with the Basel framework so as to achieve appropriate risk weights for sovereigns.
Sovereign exposures comprise those to the central government and corresponding central bank. Basel I's treatment of sovereign risk was based on the distinction between OECD and non-OECD members. Under Basel I, banks assigned a 0% risk weight to exposures to OECD member countries; exposures to non-OECD countries were assigned a 100% risk weight. The Basel I framework remains the minimum standard in some jurisdictions. See Basel Committee on Banking Supervision, Regulatory consistency assessment programme (RCAP) - Analysis of risk-weighted assets for credit risk in the banking book, July 2013. Where this discretion is exercised, and in order to ensure a level playing field, bank supervisory authorities in other jurisdictions may also permit their own banks to apply the same risk weights to the given sovereign under the same conditions, ie as long as those exposures are denominated and funded in the corresponding currency. Basel Committee on Banking Supervision, Progress report on implementation of the Basel regulatory framework, October 2013. This provision will be phased out gradually between 2017 and 2020. The new framework, governed by the Capital Requirements Directive IV (CRD IV) and coming into force from January 2014, supersedes the treatment enshrined in CRD III. It requires that, following the phasing-out, the corresponding exposures rely on credit rating agencies' assessments.
The perceived riskiness of banks has also increased relative to that of non-financial corporates. While the overall ratings of many US, UK and euro area banks deteriorated steadily over the past five years, those of non-financial corporates remained largely stable. As a result, the pool of highly rated banks shrank relative to that of highly rated corporates (shrinking dark blue bars in Graph 7, right-hand panel). And as banks' relative credit outlook worsened, their relative borrowing costs remained high (Graph 5, centre panel). This is likely to have contributed to a weakening of banks' intermediation capacity and, unless reversed, does not augur well for their future.
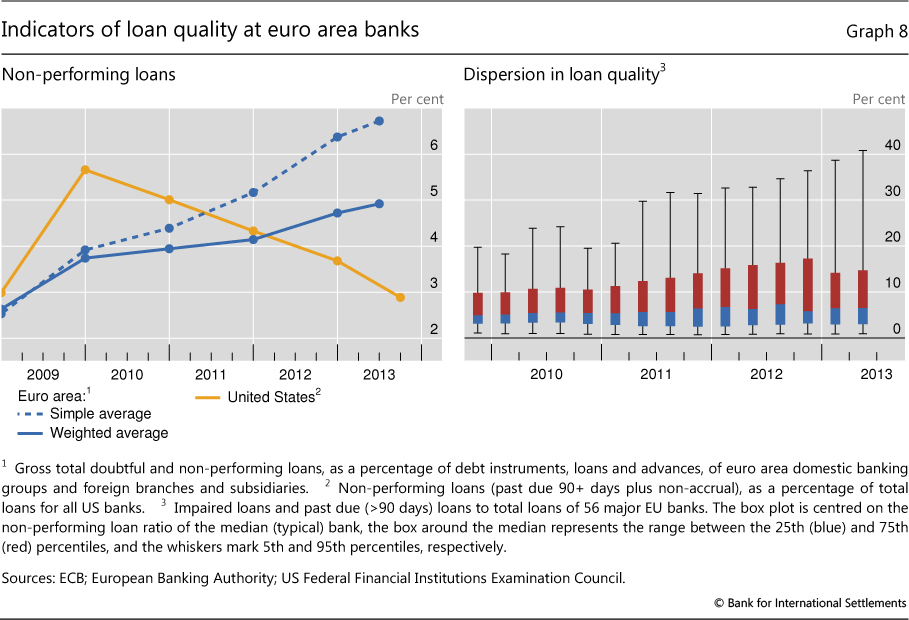
Market perceptions of banks' riskiness were driven by various factors ranging from lawsuits to lingering doubts about asset quality, especially at European banks. Reported numbers indicate that the share of non-performing loans trended up after 2008 in the euro area, but subsided after 2009 in the United States (Graph 8, left-hand panel).7 At the same time, reported aggregates conceal large differences across banks and countries (Graph 8, right-hand panel). The gradual build-up of such strains went hand in hand with the contraction in euro area bank lending. Since mid-2012 alone, European banks shed more than €2 trillion in assets, judging by industry estimates.
Policymakers have acknowledged that the uncertainty surrounding banks stands in the way of a broad-based recovery. To strengthen the banking system, on 23 October the ECB announced the terms of a comprehensive 12-month assessment of 130 major credit institutions. The muted equity market response suggests that these terms were broadly anticipated. The assessment consists of a harmonised asset quality review followed by a forward-looking stress test. Its stated goal is to enhance transparency on the condition of banks, repair balance sheets, and restore confidence in the soundness of the euro area banking sector. Accordingly, banks will be required to adopt corrective measures if their Common Equity Tier 1 ratio is deemed insufficient with respect to an 8% benchmark, either because of asset revaluations or in a stress scenario.
1 This article was prepared by the BIS Monetary and Economic Department. Questions about the article can be addressed to Nikola Tarashev (nikola.tarashev@bis.org) and Goetz von Peter (goetz.von.peter@bis.org). Questions about data and graphs should be addressed to Agne Subelyte (agne.subelyte@bis.org) and Alan Villegas (alan.villegas@bis.org).
2 The term premium is estimated using the methodology outlined in P Hördahl, O Tristani and D Vestin, "A joint econometric model of macroeconomic and term structure dynamics", Journal of Econometrics, vol 131, 2006.
3 The size of mREITs was $443 billion in March 2013, based on 10-Q reports filed with the Securities and Exchange Commission (see S Pellerin, D Price, S Sabol and J Walter, "Assessing the risks of mortgage REITs", Federal Reserve Bank of Richmond, Economic Brief, no 13-11, November 2013).
4 Net issuance equals gross issuance of new debt securities minus repayment of maturing debt. As such, the measure roughly corresponds to the change in bank loans outstanding that enters the calculation of loan growth.
5 In 2007, those shares were below 25% on both sides of the Atlantic.
6 For a discussion of banks' stand-alone and overall (or all-in) ratings, see F Packer and N Tarashev, "Rating methodologies for banks", BIS Quarterly Review, June 2011.
7 While trends over time are telling, the levels may not be comparable across regions due to differences in definitions, disclosure and regulatory treatment.