International debt securities of the corporate sector in emerging market economies
(Extract from pages 18-19 of BIS Quarterly Review, March 2013)
Private portfolio capital inflows to emerging markets are rising rapidly. According to the Institute of International Finance, private non-bank inflows into emerging market economies (EMEs) increased from $155 billion to $365 billion between 2009 and 2012 and have since remained close to the historical peak they reached in 2011. While private inflows intermediated through debt capital markets jumped, bank inflows fell slightly from $154 billion to $147 billion in the same period.1 In particular, strong demand from foreign investors led to a surge of activity in EME corporate bond markets during 2012 and early 2013. This box discusses some changes observed in the light of heightened activity in markets for international debt securities issued by financial and non-financial corporates of EMEs and reviews some structural aspects.
Investor surveys revealed that assets under management benchmarked to the emerging corporate bond index rose by 60.5% in 2012, posting a greater increase than any other asset class followed by these surveys. By comparison, assets managed against the emerging market broad index benchmarks - comprising sovereign and corporate international bonds and sovereign local-currency bonds - grew by just under 30% to $560 billion in 2012.2 The demand for emerging market corporate bonds has been dominated by high net worth retail investors. Although institutional demand for EME international corporate bonds has remained comparatively small - less than 10% of the market compared to about 50% of the international sovereign bond market - this share may well continue to increase. Greater activity by global money managers is likely to help the deepening of this market.
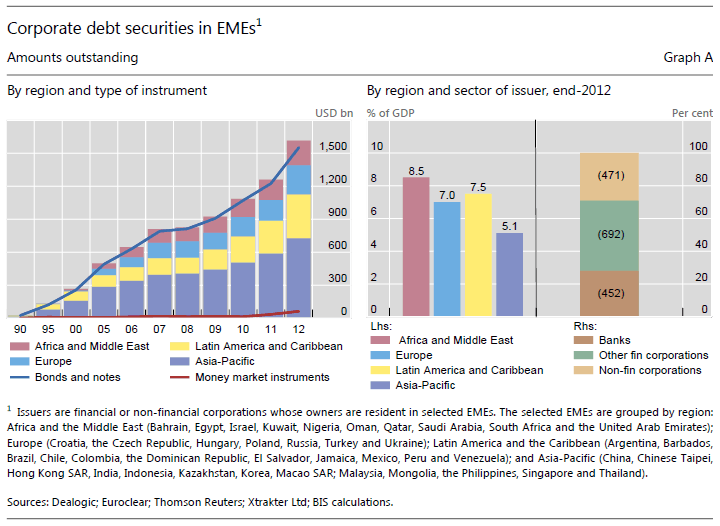
International debt securities statistics3 compiled by the BIS show that the stock of corporate debt securities issued by financial and non-financial corporations headquartered in EMEs totalled more than $1.6 trillion at end-2012 (Graph A, left-hand panel). Foreign and international bonds and notes account for some 95% of the total stock. Money market instruments make up the difference.
Debt securities issued by banks and other financial institutions make up the bulk of the stock of international corporate debt securities (Graph A, right-hand panel). As of end-2012, financial institutions had more than $1.1 trillion worth of debt securities outstanding, about two thirds of the total. This is smaller than the sector's share in developed economies (84%), where the universe of securities is 10 times larger.
Asian entities are the largest issuers in the international market for EME corporate debt securities, followed by Latin American firms. The stock of debt securities issued by emerging European and Middle East and African entities is smaller, but has grown rapidly in recent years. However, the relative sizes change considerably if debt issuance is viewed in relation to regional output. From this perspective, Middle East and Africa has the largest share, and Asia the smallest one (Graph A, right-hand panel).
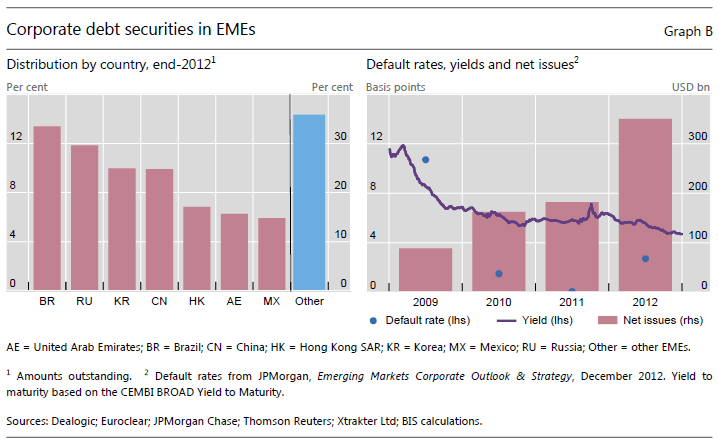
The regional pattern shows that this market is concentrated within a handful of economies. At a country level, national entities from Brazil, China, Hong Kong SAR, Korea, Mexico, Russia and the United Arab Emirates hold the largest market shares in the outstanding stock. A group of about 30 other EMEs account for the remaining debt securities (Graph B, left-hand panel).
The investable share of the stock of international corporate debt securities available to international investors is rather smaller due to size, liquidity and risk characteristics. The broadest benchmark index for emerging corporate bond markets (CEMBI) covers debt securities in the form of bonds that are worth about $620 billion. Financials account for 36% of this amount, much less than their share in the total stock. The investable index allows global investors to gain exposure to EME sectors such as oil and gas (13.5%); telephone, media and technology (11.1%); and commodities (10.5%). Fewer opportunities exist in real estate (5%) and consumer goods (6%), sectors that are usually linked to fast-growing domestic demand in EMEs.
The perceived credit quality of EME corporate bonds still depends heavily on that of the sovereign. Within the limits set by this sovereign credit "ceiling", higher macroeconomic volatility in EMEs is reflected in changes in perceived risk and volatility. An improvement in perceived credit risk has translated into the reduced yields and compressed spreads seen at present (Graph B, right-hand panel). Default rates have remained low (about 2.7% by one estimate) in the aftermath of the financial crisis. But the historical fluctuations in these rates have been considerable. At times of macroeconomic and financial stress, default rates have seen significant increases: in 2002, for example, they jumped to 15.4% and in 2009 they topped 10.7%. Under the less challenging macroeconomic conditions of recent years, they have fluctuated between 0 and 2.7%.
1 "Capital flows to emerging market economies", IIF Research Note, 22 January 2013.
2 G Kim, "2012 Index Review", JPMorgan Fixed Index Product Guide, January 2013.
3 For details about the universe of securities covered, see B Gruić and P Wooldridge, "Enhancementsto the BIS debt securities statistics", BIS Quarterly Review, December 2012, pp 63-76.


