The trifurcated renminbi foreign exchange markets: a transactions perspective
(Extract from page 44 of BIS Quarterly Review, December 2011)
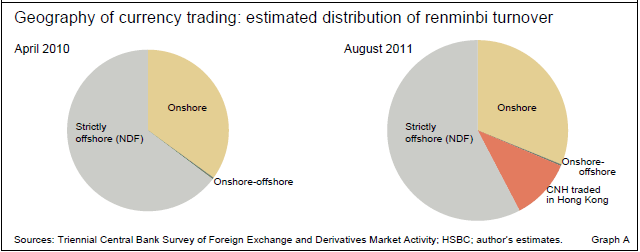
To complement the point made in the main text - that, in terms of pricing, the renminbi trades in a trifurcated market - this box gives a transactions perspective. According to the triennial central bank survey of April 2010, the largest share of trading in the renminbi was the $23 billion per day virtual trading of the NDF outside China (Graph A, left-hand pie chart). The onshore deliverable market in April 2010 reported only $10 billion (though this may have been an undercount). By centres, trading volume was about $10 billion per day on the mainland and in Hong Kong SAR, with another $7 billion per day in Singapore and London and $3 billion per day in New York. Market estimates for August 2011 put trading offshore in the deliverable renminbi, CNH, at $4 billion per day. If turnover on the mainland and that in non-deliverable forwards outside China are assumed to have continued at the April 2010 rate, then the trifurcation of activity would be as portrayed in the right-hand pie chart in Graph A.

