Measuring counterparty credit exposures in the OTC derivatives market
(Extract from pages 30-31 of BIS Quarterly Review, September 2011)
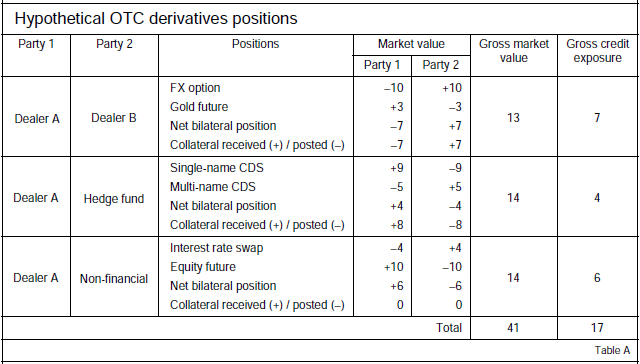
One key mechanism through which the failure of Lehman Brothers in September 2008 weakened the rest of the financial system involved potential counterparty credit exposures. Lenders withheld credit, fearing that borrowers might have significant claims on the investment bank that were not fully secure. Such claims could have arisen from bilateral derivatives trades in the over-the-counter (OTC) market, where total counterparty credit exposures vastly exceeded the total collateral posted by market participants. Since then, this gap has narrowed, reducing but perhaps not eliminating this particular systemic risk. This box discusses how to measure counterparty credit exposures across the OTC derivatives market. It does so based on the hypothetical positions in Table A.
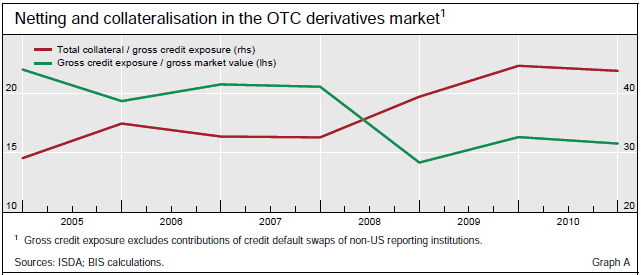
Bilateral netting and collateralisation reduce counterparty credit exposures.1 Dealers A and B in Table A are counterparties to an FX option that has a positive market value of 10 to B (and hence a negative market value of 10 to A). If A became bankrupt, B may never get to collect this value. B therefore has a counterparty credit exposure to A via the FX option of 10. To neutralise this counterparty risk, B could request collateral worth 10 from A, which it would retain if A defaulted on its contractual obligations. But A and B are also counterparties to a gold future, which has market value of +3 to A (and hence -3 to B). With a legally enforceable netting agreement, A and B could net market values over these two positions. This would compress the counterparty credit exposures between A and B to a single claim of B on A of 7. B would then only need collateral worth 7 from A to eliminate current counterparty credit exposures. Across all the positions in Table A, the sum of positive market values (or, equivalently, the sum of negative market values), known as the "gross market value", is 41. The sum of positive (or negative) market values after bilateral netting, known as the "gross credit exposure", is 17. Graph A (green line) shows that the ratio of gross credit exposure to gross market value in the OTC derivatives market has fallen in recent years, notably so in 2008, consistent with an increase in bilateral netting.2 In addition, Graph A (red line) shows that total collateral received (or, equivalently, total collateral posted) has risen relative to gross credit exposures, as rates of collateralisation of net positions have increased. Data on collateral used in the numerator of this ratio came from the International Swaps and Derivatives Association (ISDA), although the reported figures were halved, as ISDA calculates the amount of collateral on a different basis, whereby "collateral assets are counted twice, once as received and once as delivered".3
An average collateralisation rate of 100% does not ensure that all current counterparty exposures have been eliminated. This is because counterparty credit exposures are often over- or undercollateralised, as is the case for the positions in Table A between Dealer A and the hedge fund and Dealer A and the non-financial corporation respectively. Firms may demand overcollateralisation to protect against losses on potential future counterparty credit exposures, which could be significantly larger than current exposures depending on how position values evolve. They may concede undercollateralisation if counterparties cannot easily source collateral or have low perceived default probabilities. A better measure of collateralisation than average rates is therefore to cap the collateral of any individual position at 100%. This would be equivalent to measuring the fraction of current counterparty credit exposures backed by collateral. Only a high value of this metric could generate confidence that there were no large uncollateralised counterparty credit exposures in the financial system.
1 Counterparty credit risk may also be reduced via trade compression, which tears up redundant contracts on a multilateral basis. See, for example, N Vause, "Counterparty risk and contract volumes in the credit default swap market", BIS Quarterly Review, December 2010.
2 Including via the transfer of positions vis-à-vis multiple original counterparties to a much smaller number of central counterparties, which is explained in Vause (2010), op cit.
3 See, for example, ISDA, ISDA Margin Survey 2011, April 2011. This also reports an aggregate collateralisation rate, which is the average rate of collateral received against pre-collateral counterparty credit exposures by its membership, which includes the major derivatives dealers. For this to be representative of the whole market, however, it would require ISDA non-members to receive collateral at similar rates against exposures (or, almost equivalently, for ISDA members to post collateral at the same rate).


