Country-to-country banking interlinkages
(Extract from pages 72 to 73 of BIS Quarterly Review, September 2010)
To illustrate the importance of both group- and office-level balance sheet data in the analysis of interlinkages, it is instructive to see the results that can be obtained from analysing only one of these data dimensions. In the main text, the discussion starts at the consolidated level to then show why office location can be important. This box uses the BIS locational banking statistics by residency, perhaps the most familiar of the four international banking datasets maintained by the BIS, to look at interlinkages at the country level. These statistics include the size, currency, counterparty type and, critically, the counterparty location of claims and liabilities of banks in one country to borrowers located in another country. They do not contain information on the nationality of the reporting banks in each location. Thus, the data provide a particular picture of geographical (ie country-to-country) interlinkages and the flow of funds between them, but are less well suited for more structural balance sheet analysis.
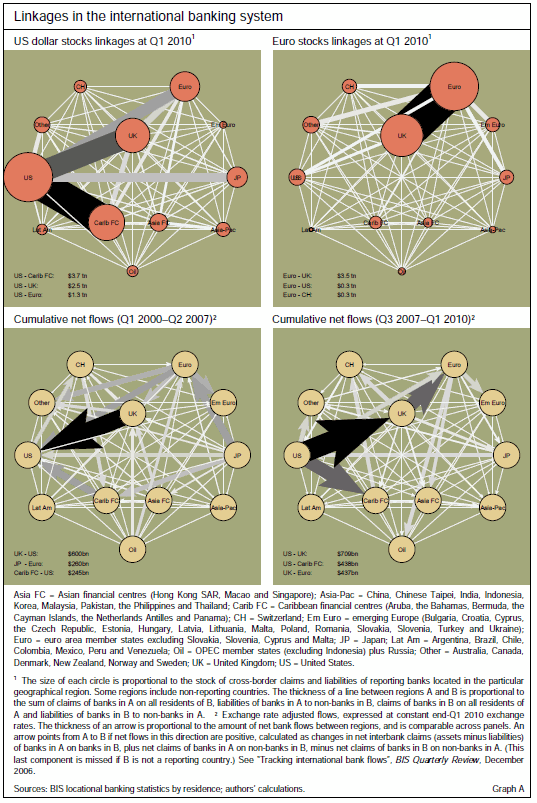
A broad-level illustration of these geographical interlinkages between banks' local operations is presented in Graph A, where the nodes depict countries or regions where banks are located. In the top panels, the size of the nodes is proportional to the share (in the global total) of cross-border bank assets and liabilities booked by banks located in that country node. The thickness of the lines, in turn, is a measure of the amount of finance (size of the linkage) across nodes, shown separately for US dollar- and euro-denominated positions.1The lower panels show the cumulative net flow of capital (in all currencies) which was transacted across bank balance sheets in the seven years before the start of the crisis and the three years since. The estimated net capital flows, depicted by the thickness and direction of the arrows, take into account changes on the assets and liabilities side of the balance sheets of all reporting banks located in both countries in each bilateral pair.2
At least two key points emerge from Graph A. First, capital flows saw a phenomenal reversal in the wake of the recent crisis (lower panels), in particular out of the United States. Up to mid-2007, banks facilitated international capital flows out of Japan and the euro area as well as from Asian financial centres and oil-exporting countries. Banks routed these funds via offices in the United Kingdom and in Caribbean financial centres, ultimately transferring them to borrowers in the United States and in emerging markets. After the start of the crisis, the direction of many of the bilateral flows reversed, in part generated by capital movements back to the United Kingdom, and in part reflecting asset writedowns.
Second, and more important, cross-border banking is very concentrated in a few locations (top panels). That is, a large chunk of the world's cross-border banking business is booked (or has a counterparty) in the United Kingdom and a few other key banking centres. As McCauley et al (2010) discuss, however, the activity on the ground in these locations can be largely driven by the activity of foreign banks (ie affiliates of foreign-headquartered institutions). Thus, these location-level linkages say little about the actual consolidated exposures of residents of a given country or of the banks that are headquartered there.
In short, Graph A, and similar more detailed analyses with these data, can be used to illustrate what happened to the financial linkages between countries before and after the crisis: cross-border financial flows to borrowers in the United States and many emerging market countries surged, and then reversed direction. Yet it offers little information on why this happened, since the strictly residency-based perspective effectively aggregates the balance sheets of entities from different banking groups in a particular location, thus precluding any serious analysis of balance sheet stresses. Uncovering these stresses requires a deeper, more structurally based view of banks' balance sheets - one that combines the location-based information in Graph A with headquartersbased consolidated reporting, as discussed in the main text.
1 See footnote 1 in Graph A for a definition of the term linkage. There is nothing special about this choice of definition, other than that it nicely summarises the relative strength of the overall banking connection across countries. Similar charts based only on assets or liabilities, or only on interbank positions, are also possible.2A fundamental problem in the flow calculation is that banks increasingly rely on debt securities liabilities and, unlike with deposits, they often do not know the identity and location of the holder, since the securities are bought and sold in secondary markets. Bilateral net flow figures are thus biased. The calculations in the bottom panels of Graph A attempt to correct for this by backing out the counterparty location using debt securities claims on the assets side of the balance sheet, and allocating the remainder of the liabilities to counterparty countries using weights based on observable liabilities. See McGuire and Tarashev (2007) for more details.

