The size of the global CDS market - BIS and DTCC data
(Extract from pages 24-25 of BIS Quarterly Review, December 2009)
Recent developments in CDS markets have led to the availability of additional CDS data sources. In conjunction with the well known ISDA market survey and the BIS semiannual central bank survey on OTC derivatives markets, these new sources can be used to monitor global market trends more closely. One source that has attracted much attention is the Depository Trust & Clearing Corporation (DTCC) data on CDS. DTCC stores OTC credit derivatives data in a global repository called the Trade Information Warehouse (TIW). It then performs post-trade processing functions such as automated calculation, netting and central settlement of payment obligations, as well as settlement of credit events such as bankruptcies. Below we examine the DTCC data and briefly compare them with the data from the BIS semiannual central bank survey on outstanding CDS.
In early November 2008, DTCC started weekly publication of aggregated data as part of efforts to address market concerns about the lack of transparency in CDS markets. Initially, the data included outstanding gross and net notional values of CDS contracts for the top 1,000 underlying single-name reference entities as well as all CDS indices. Over time, more information has been published, but as yet no information is provided on market values or exposures. The DTCC data are based on CDS records registered in the warehouse, while the BIS data rely on dealers' reports to national central banks.
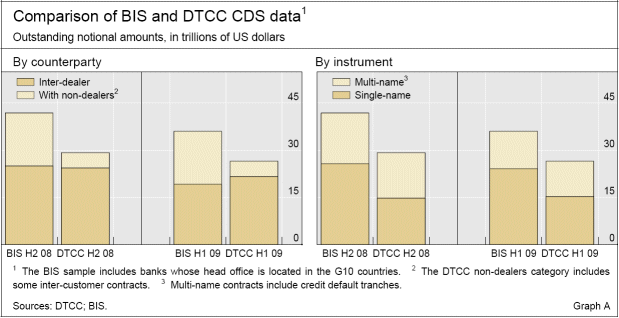
One indicator of the size of global CDS markets is the gross notional amounts outstanding, available in both the BIS and DTCC datasets. By counterparty, the BIS data distinguish between reporting dealers, other financial institutions and non-financial customers. By contrast, the DTCC data identify as counterparties only dealers and non-dealers (customers). To facilitate comparison, we combine the two non-reporting counterparty groups in the BIS survey in a single aggregate nondealer category (Graph A, left-hand panel). In addition, for the DTCC data we include direct trades between non-dealers, which amount to only 0.1% of the total.
At first glance, the DTCC and BIS subsample data for the total gross amounts outstanding between dealers as of end-2008 match perfectly. This is, however, not the case for the mid-2009 data, where DTCC reports 12% higher volume of outstanding contracts than the BIS. The likely explanation for this difference is that DTCC covers more dealers.
The amounts outstanding of dealer/non-dealer contracts in the BIS survey are considerably larger than those reported by DTCC. The probable reason is that CDS providing protection on less standardised contracts such as collateralised debt obligations (CDOs) and asset-backed securities (ABS) are typically not confirmed electronically, so that CDS are less well covered by DTCC. In the future, CDOs and ABS might be included in the DTCC data.
By instrument, the BIS-compiled data distinguish between single- and multi-name CDS contracts. The DTCC data, on the other hand, distinguish three categories of instrument: contracts on single names; contracts on credit default indices; and contracts on credit default tranches. Here we treat credit default indices and credit default tranches as multi-name contracts. For both periods, the BIS data report around 60% higher amounts outstanding in single-name instruments, while the amounts for multi-name instruments appear broadly comparable (Graph A, right-hand panel).
The combined pattern across counterparties and instrument types suggests that a main reason for the differences between the two datasets may be that outstanding single-name contracts used in the more customised transactions between dealers and non-dealers (including other financial institutions) are covered by the BIS but not yet by DTCC.
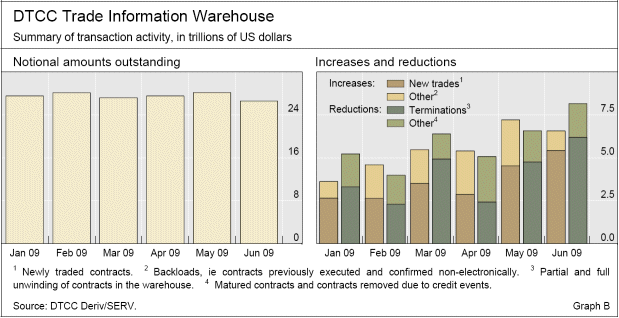
From the perspective of understanding developments in the CDS market, an important advantage of the DTCC data is that, while the BIS survey is semiannual, they are published weekly. This permits higher-frequency assessment of market size (Graph B, left-hand panel). DTCC also provides more information on the factors driving changes in the outstanding amounts. Increases due to relatively new trades and the inclusion of legacy transactions ("backloading") are identified separately, while reductions are broken down into those reflecting contracts that are fully or partially terminated because of netting and those reflecting contracts that mature or exit due to a credit event (Graph B, right-hand panel). The data for the first half of 2009 indicate that, on a monthly basis, new trades together with backloading added $3-7 trillion each month, while reductions were slightly larger, mainly owing to terminations of offsetting contracts.
The BIS and DTCC data combined with information provided by TriOptima and Markit, both of which offer multilateral termination services to OTC derivatives dealers, indicate that around 85% of all terminations take place in the more liquid CDS indices. All portfolio compression / tear-up activity occurs between dealers using these services. The DTCC data also suggest that there may be more tear-ups towards the end of each quarter, which may reflect the fact that CDS contract maturity dates are standardised on a quarterly cycle (20 March, 20 June, 20 September and 20 December) to match the International Monetary Market Cycle.


