Capital flows via banks reverse direction during the crisis
(Extract from pages 24-25 of BIS Quarterly Review, June 2009)
The financial crisis has led to significant changes in the flow of funds via banks across countries. The top panels of Graph A map the cumulative net transfer of funds between countries through the international banking system during the six quarters before and after the onset of the crisis. The estimated net capital flows, depicted by the thickness and direction of the arrows, take into account changes on the assets and liabilities side of the balance sheets of banks located in both countries in each bilateral pair.
Prior to the crisis, banks facilitated international capital flows out of surplus regions. This is illustrated by the arrows emanating from Japan and the euro area, as well as from Asian financial centres and oil-exporting countries. Banks routed funds from these regions via offices in the United Kingdom and in Caribbean financial centres, ultimately transferring funds to borrowers in the United States (a cumulative $492 billion between the first quarter of 2006 and second quarter of 2007).
During the crisis, the direction of the bilateral flow of funds between several of the largest economies reversed. Between the second quarter of 2007 and fourth quarter of 2008, the cumulative net flows from the United States to the United Kingdom totalled $482 billion, and those to Caribbean financial centres $213 billion. Similarly, flows from oil-exporting countries, which mainly reflected deposits placed with banks in the United Kingdom and euro area, reversed as residents of these countries repatriated deposits.
The determinants of these flows differ for each bilateral pair. The bottom panels of Graph A break down by sector the cumulative flows for three bilateral linkages with the United States. Negative (positive) values represent flows into (out of) the United States. By far the largest swing since the start of the crisis has been the rapid rise in net flows to the United Kingdom, the result of reduced claims on non-bank entities in the United States booked by banks located in the United Kingdom (blue line, bottom left-hand panel). This is the result of reduced lending and writedowns of positions vis-à-vis US residents by the London offices of the major European-headquartered banks.
In contrast to the US-UK bilateral pair, the net flow of funds between Japan and the United States overall did not change direction. Throughout the crisis, banks in Japan have continued to channel money to US non-banks (blue line, bottom centre panel). At the same time, interbank flows reversed direction (red line), as Japanese banks transferred a net $120 billion to their US offices since the start of the crisis. The BIS consolidated banking statistics (immediate borrower basis) show that Japanese banks' locally booked US dollar positions vis-à-vis residents of the United States increased by a similar amount, in part reflecting greater claims on the US public sector.1
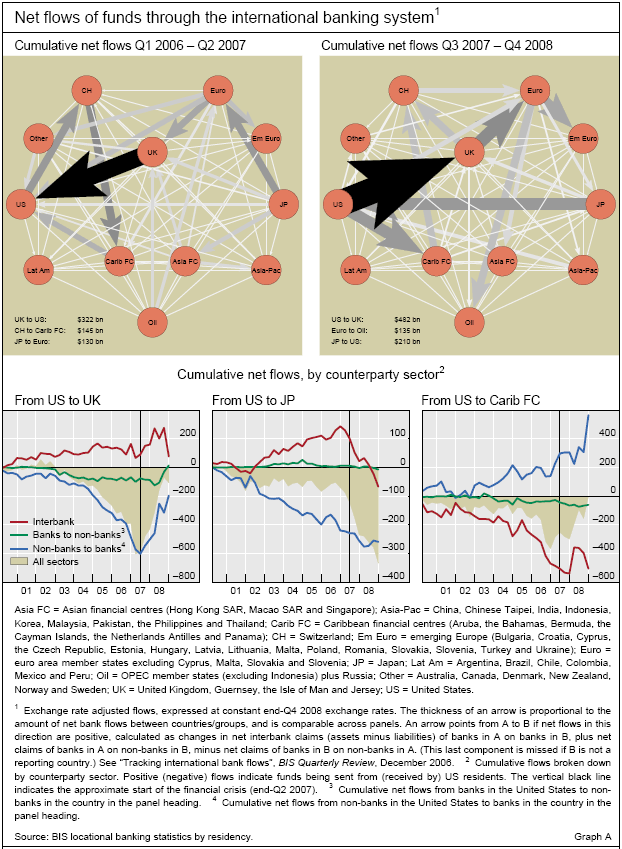
1 The consolidated banking statistics (ultimate risk basis) show that $45 billion of the $60 billion increase in Japanese banks’ worldwide claims on the US public sector in the fourth quarter of 2008 was booked by Japanese banks’ offices in the United States.