OTC derivatives statistics at end-December 2021

Key takeaways
- The notional amount of OTC derivatives declined modestly in the second half of 2021, to $600 trillion. The gross market value and gross credit exposure also fell during the period.
- Amid rising prices for commodities, the gross market value of commodity derivatives rose by 30% during the second half of 2021.
- The notional amount of forward rate agreements (FRAs) contracted sharply in the second half of 2021, as investors prepared for Libor benchmarks to be phased out at the year-end.
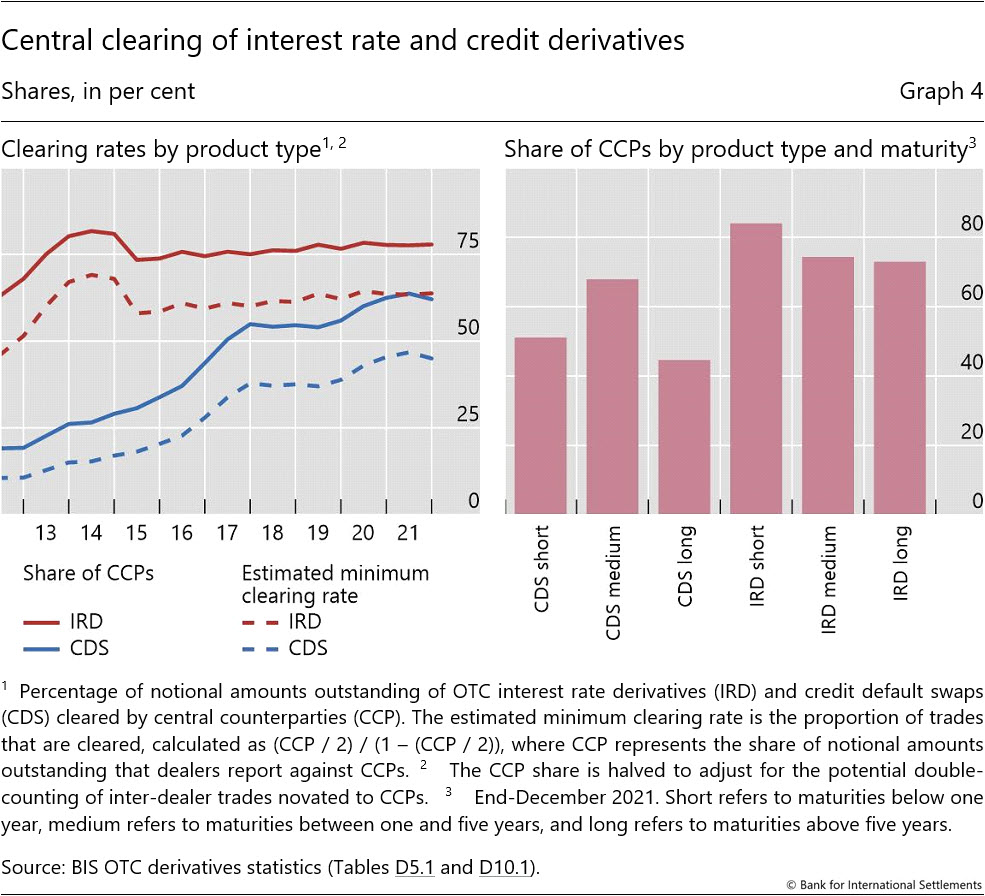
- Central clearing rates remained stable for both interest rate derivatives (IRDs) and credit default swaps, standing at a respective 78% and 62% of notional amounts.
Outstanding positions of OTC derivatives declined
The notional value of outstanding derivatives contracts fell modestly between end-June and end-December 2021, from $610 trillion to $600 trillion (Graph 1, left-hand panel). This reflected mainly a seasonal decline whereby year-end amounts contract relative to end-June values, creating a sawtooth pattern in the data. This pattern is most evident for interest rate derivatives (IRDs) (red bars).
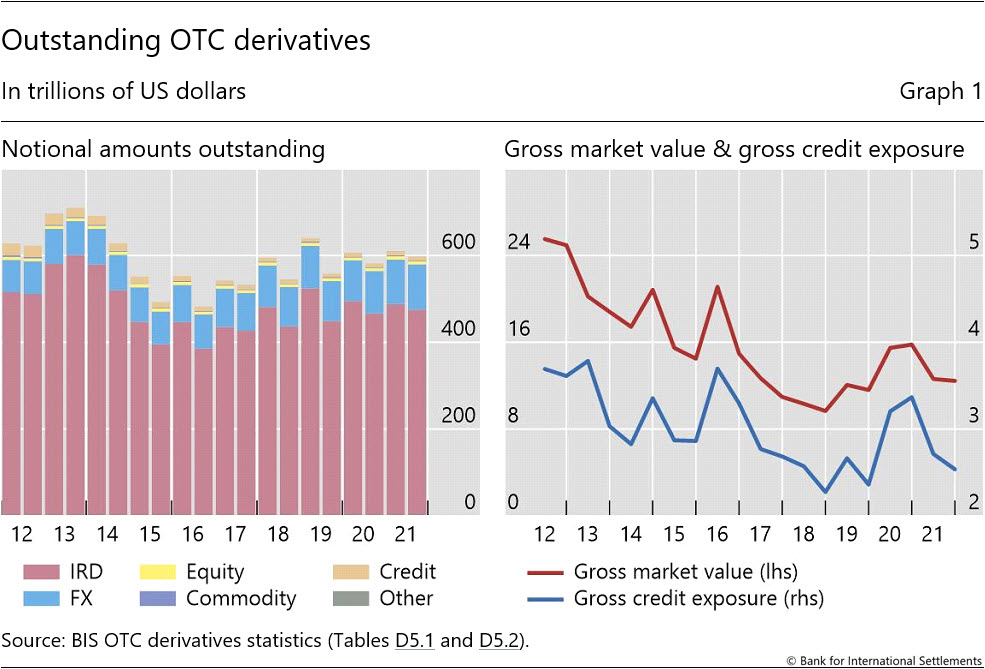
The gross market value of derivatives contracts – a measure of amounts at risk – stood at $12.4 trillion at end-2021, slightly below its end-June 2021 level (Graph 1, right-hand panel). The small decrease mainly came from IRDs, whose market value fell from $8.9 trillion at end-June 2021 to $8.6 trillion at end-2021. The gross credit exposure of derivatives contracts – which adjusts gross market values for legally enforceable bilateral netting agreements (but not for collateral) – also contracted, standing at $2.5 trillion at end-2021. The two measures had jumped noticeably in 2020 amid heightened market uncertainty following the Covid-19 shock.
Gross market value of commodity derivatives rose sharply
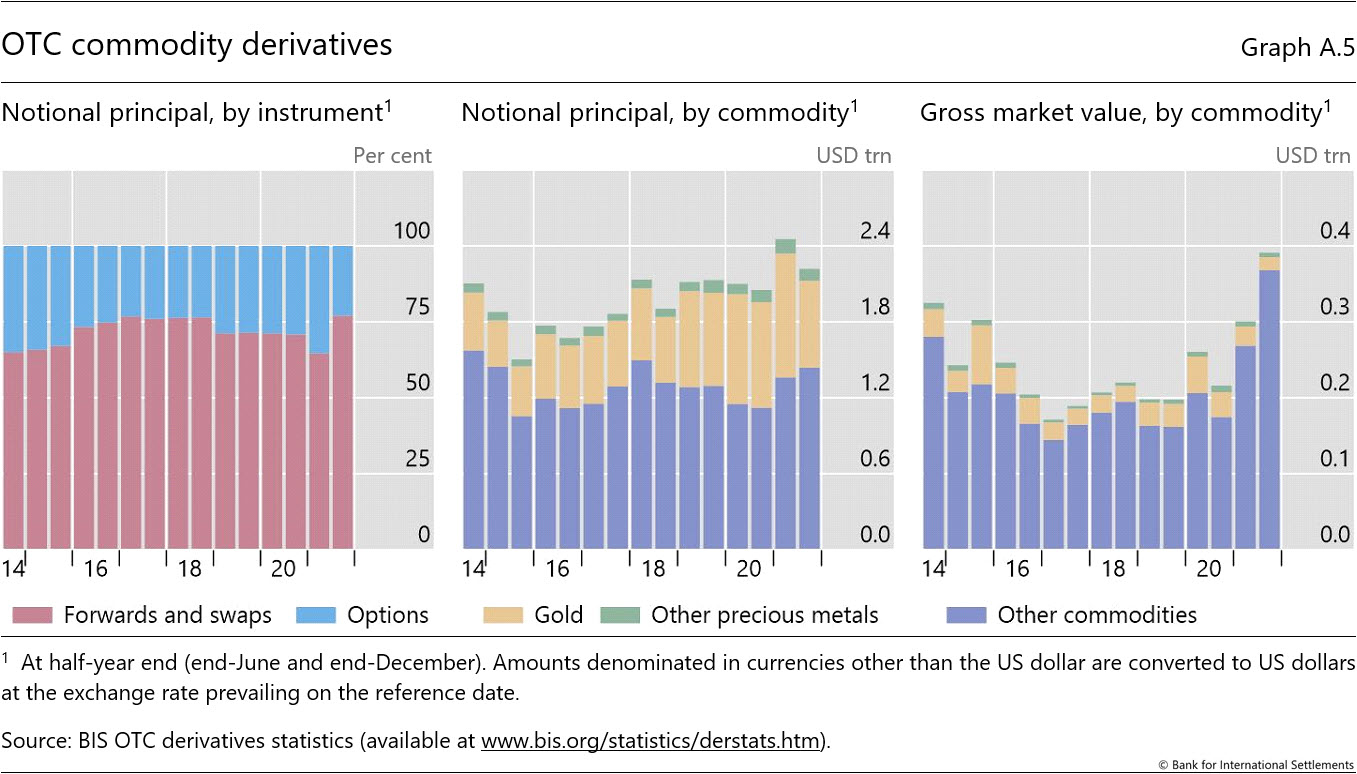
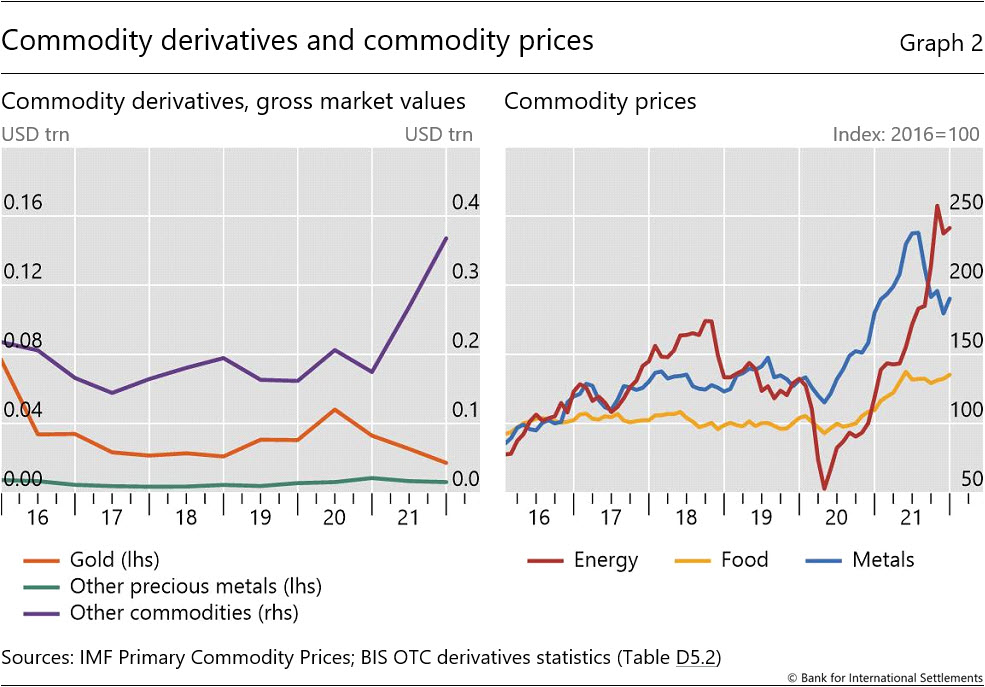
The gross market value of commodity derivatives increased by 30% in the second half of 2021, against a backdrop of rising prices for commodities. The increase was driven mainly by derivatives on commodities other than precious metals, whose gross market value increased by 37% over the same period (Graph 2, left-hand panel, purple line; see also Annex Graph A.5). This went hand-in-hand with notable rises in food and energy prices in 2021 during the rapid economic recovery after the pandemic (right-hand panel).
Significant decline in FRAs following the Libor transition
The reform of benchmark interest rates has reshaped the IRD landscape. From January 2022, Libor reference rates in IRD have been replaced by backward-looking rates (ie overnight risk-free rates, RFRs).1 As the backward-looking rates are no longer compatible with the structure of forward rate agreements (FRAs), investors increasingly turned to single-period interest rate swaps (IRS) as an imperfect replacement for FRAs.2
The transition away from Libor is clearly evident in the data for the second half of 2021. The notional value of outstanding FRAs dropped substantially, with those denominated in Swiss francs and sterling contracting by 77% each, and in US dollars by 60% (Graph 3, left-hand panel). Japanese yen-denominated FRAs dropped 41%, but from a much lower base. Euro-denominated FRAs saw the smallest drop (36%), probably due to the continuation of Euribor.3
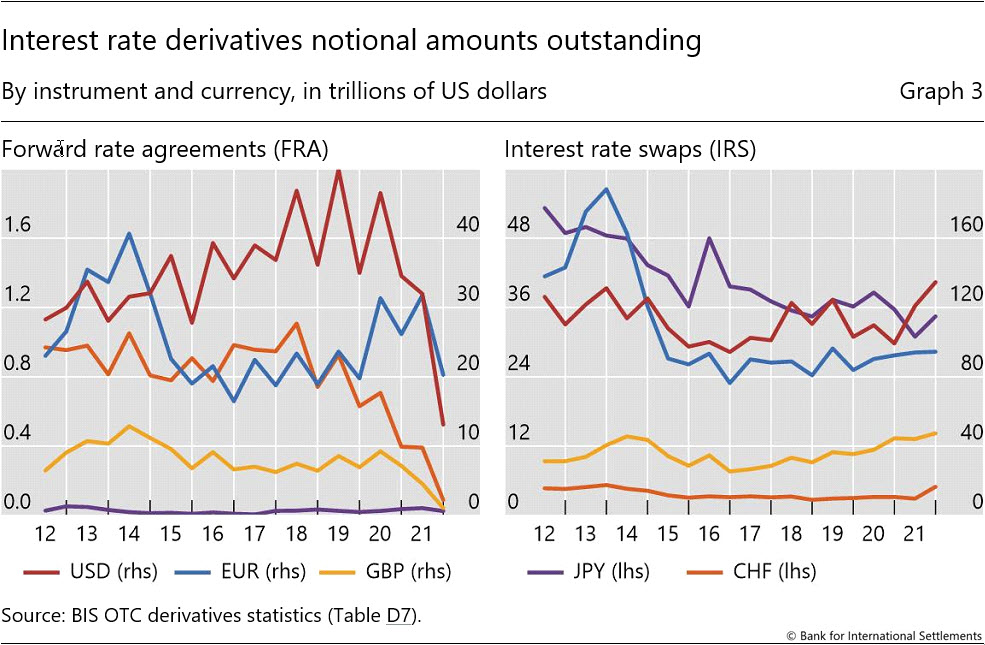
The notional amount of IRS denominated in US dollars rose by $14 trillion in the second half of 2021 (Graph 3, right-hand panel), roughly equivalent to the $19 trillion drop in dollar-denominated FRAs. Similarly, sterling-denominated IRS increased by $3.3 trillion, while FRAs in that currency fell by $3.5 trillion (yellow lines). In addition, strong demand for new contracts to manage interest rate risks may have also driven the increases in IRS, against an outlook for higher inflation and expectations of future rate hikes. This is, for instance, suggested by the fact that IRS in Japanese yen and Swiss franc saw larger increases than the corresponding decreases in FRAs.
Central clearing rates remained stable
The shares of central cleared derivatives remained roughly unchanged in the second half of 2021. The share of IRD contracts (notional amounts) cleared by central counterparties (CCPs) plateaued at 78% at end-2021, unchanged from end-June 2021. The same measure for credit default swaps dropped from 64% to 62% in the second half of 2021 (Graph 4, left-hand panel).
Clearing rates continued to vary by both the type and the maturity of contracts. The rate for medium-term contracts is the highest among credit default swaps, having reached 68% at end-December 2021 (Graph 4, right-hand panel). This probably reflects the popularity of central clearing in the typically liquid five-year contracts. The clearing rates of all maturities are high for IRD contracts, with the short-term contracts standing out at 84% at end-December 2021. The medium- and long-term IRD contracts have clearing rates of 74% and 73%, respectively.
1 According to the FSB Statement to Support Preparations for LIBOR Cessation, publication of all GBP, EUR, CHF and JPY LIBOR panels and the one-week and two-month USD LIBOR settings will cease at end-2021, after which no new contracts should reference USD LIBOR. The only exceptions are certain key USD rates that still support the rundown of legacy contracts (which will cease by end-June 2023).
2 FRAs reference forward-looking term rates and pay out at the start of an interest period, rather than at the end, in order to mitigate credit risk. By contrast, single period IRS reference backward looking rates and pay out at the end of the interest period.
3 Euribor, or the Euro Interbank Offer Rate, is a reference rate that is constructed from the average interest rate at which euro zone banks offer unsecured short-term lending on the interbank market. It is different from EUR Libor, the unsecured short-term euro lending rate in the London interbank market. Although EUR Libor has been discontinued, there is no plan to discontinue Euribor.