OTC derivatives statistics at end-December 2018
- Notional amounts of OTC derivatives declined from end-June to end-December 2018, from $595 trillion to $544 trillion. The market value of OTC derivatives fell from $10.3 trillion to $9.7 trillion, led by declines in US dollar interest rate derivative contracts. Gross credit exposure sankto its lowest point since 2007.
- Reflecting structural changes in OTC derivatives markets, the gross market value share of interest rate contracts fell from 80% at end-June 2014 to 66% at end-December 2018, while that of foreign exchange contracts rose from 11% to 23%.
- The share of outstanding OTC derivatives cleared through central counterparties remained near 75% for interest rate contracts and 55% for credit default swap (CDS) contracts.
Outstanding OTC derivatives amounts decline in H2 2018
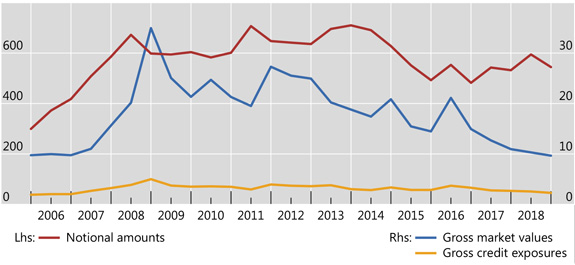
Graph 1: Outstanding OTC derivatives, USD trillions (interactive graph).
Source: BIS OTC derivatives statistics (Table D5.1).
In the two years prior to 2018, notional amounts outstanding increased in the first half of the year and decreased in the second. 2018 was no different. In the second half of 2018, the notional amounts - which determine contractual payments - decreased from $595 trillion at end-June 2018 to $544 trillion at end-December (Graph 1, red line). The bulk of OTC derivatives notional amounts are accounted for by interest rate derivatives (80% at end-December 2018), and the decline in the latter contracts (from $481 trillion to $437 trillion) drove the total decline.
The gross market value of derivative contracts (blue line), which provides a more meaningful measure of amounts at risk, continued the trend decline observed since the Great Financial Crisis (GFC). Market values fell to $9.7 trillion at end-December 2018, from the peak of $35 trillion at end-December 2008.
Gross credit exposures (yellow line), which adjust gross market values for legally enforceable bilateral netting agreements (but not for collateral), fell to $2.3 trillion at end-December 2018. This is its lowest point since before the GFC.
Notional decline driven by USD and EUR interest rate derivatives
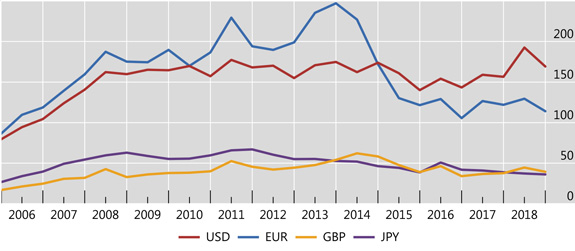
Graph 2: Outstanding notional amounts of OTC interest rate derivatives, USD trillions (interactive graph).
Source: BIS OTC derivatives statistics (Table D7).
Notional amounts of USD- and EUR-denominated interest rate contracts both fell noticeably in the second half of 2018 (Graph 2, red and blue lines). USD contracts, which has become the largest currency segment in the past few years, declined from $193 trillion at end-June 2018 to $169 trillion at end-December; this slightly reversed the upward trend observed since 2016. As for EUR contracts, they declined slightly in the second half of 2018, from $129 trillion to $114 trillion, in line with the average amounts observed in recent years, and well below (by around 50%) the record amounts observed in 2010-14. Notional amounts in GBP and JPY remained at low levels, $39 trillion for sterling (yellow line) and $36 trillion for the yen (purple line).
Much of the decline in notional amounts for interest rate derivatives occurred in short-term contracts, which account for 46% of the total notional amounts. The total declined from $481 trillion to $437 trillion, while the segment with maturity up to and including one year fell from $231 trillion to $201 trillion.
Gross market values continue to decline
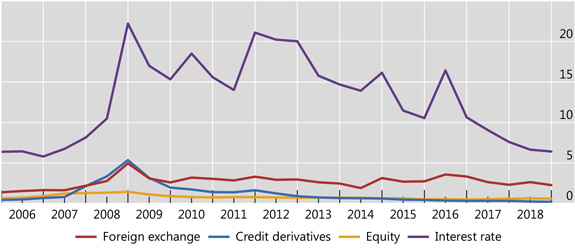
Graph 3: Outstanding gross market values of OTC derivatives, trillions USD (interactive graph).
Source: BIS OTC derivatives statistics (Table D5.1).
From end-June to end-December 2018, the market value of interest rate contracts declined from $6.6 trillion to $6.4 trillion (Graph 3, purple line). This decline was in large part due to USD-denominated contracts, which fell slightly, to $1.2 trillion, while EUR-denominated contracts remained roughly unchanged at $3.1 trillion.
Market values for foreign exchange OTC contracts also declined, from $2.6 trillion to $2.3 trillion (red line). Nevertheless, they have been fairly stable over the past 10 years, in contrast to the significant drop for interest rate contracts (whose amounts are one fourth of their GFC levels). Thus, the market value share of interest rate contracts fell from 80% at end-June 2014 to 66% at end-December 2018, while the share for foreign exchange contracts rose from 11% to 23%.
Central clearing of OTC derivatives levels off
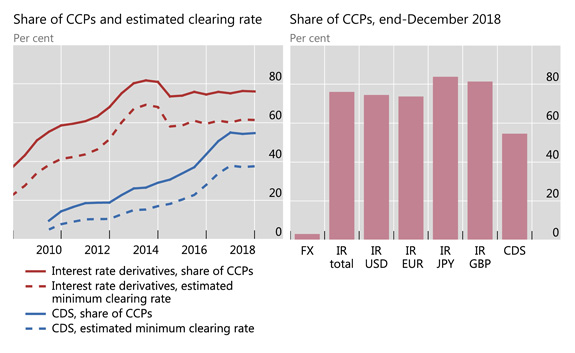
Graph 4: Percentage of notional amounts of OTC derivatives cleared with central counterparties (CCPs). See footnotes for Graph A8 in the Annex for details on the data.
Source: LCH.Clearnet Group Ltd; BIS OTC derivatives statistics; BIS calculations. (Tables D5.1 and D10.1).
Central clearing had been making steady inroads in the OTC derivatives market for many years. Emphasis on it was a key policy response following the GFC, and additional clearing requirements continue to be implemented. In the last few years, the upward trend has levelled off. The share of notional amounts of interest rate derivatives with CCPs has been stable, near 75% since end-June 2015 (Graph 4, left-hand panel, solid red line). Similarly, the estimated minimum clearing rate - which adjusts for potential double-counting of inter-dealer trades novated to CCPs1 - has stayed around 60% (dashed red line). For CDS contracts, the share with CCPs levelled off around 55% since the second half of 2017 (solid blue line), while the estimated minimum clearing rate held just below 40% over the same period (dashed blue line).
Data at end-December 2018 show differences in clearing rates across different derivatives categories (Graph 4, right-hand panel). For interest rate contracts, 74% of USD and EUR contracts were with CCPs, while the respective figures for JPY and GBP contracts were 84% and 81%. By contrast, only 3% of OTC foreign exchange contracts were with a CCP, while the share for equity-linked contracts was negligible. For CDS contracts, 49% of single name contracts are held against CCPs. Multi-name instruments, on the other hand, have 60% of their notional amounts held against CCPs, as they consist mostly of standardised index products.
The rise of central clearing has been an important structural change in OTC derivatives markets over the past decade. This change has gone hand in hand with an increase in trade compression - the elimination of economically redundant derivatives positions - both of which primarily affected interest rate contracts, driving down their market values. New practices such as settle-to-market - where banks, instead of posting collateral against the change in market value (ie variation margin), make outright payments to restore the market value to zero - have additionally contributed to the observed decline in their market values. Market values for foreign exchange contracts have been less affected by these developments, as only the non-deliverable forwards segment is cleared. These patterns help illuminate the decline in market values relative to notional amounts for interest rate contracts, and the relative increase in the gross market value share of foreign exchange contracts.
1 The estimated minimum clearing rate is calculated as (CCP / 2) / (1 - (CCP / 2)), where CCP represents the share of notional amounts outstanding that dealers report against CCPs. CCPs' share is halved to adjust for the potential double-counting of inter-dealer trades novated to CCPs. The true clearing rate is likely to be higher than this, as many trades will be initiated with CCPs.