I. Progress and peril

- Chapter I: Data behind the graphs
- Press release: Global economic pressure points call for policy discipline: BIS
Key takeaways
- The global economy displayed surprising resilience despite successive shocks, from tariffs to the Middle East conflict. This was partly driven by optimism around progress in artificial intelligence (AI), which fuelled large AI-related investments and sustained accommodative financial conditions.
- But the perils have grown with pressure points around risks of persistent inflation, the sustainability of AI-related investments, growing financial vulnerabilities and weakening fiscal positions.
- Safeguarding price stability, restoring fiscal space, strengthening financial stability beyond the banking perimeter and structural reforms are key priorities. Discipline in each area expands the room the others have to act.
Resilience tested
The 12-month period under review falls into two phases. The first was one of surprising resilience. Global growth and trade held up despite the sharp tariff hikes, supported by easy financial conditions and strong artificial intelligence (AI)-related investment and sentiment. With a few exceptions, most notably the United States and China, inflation stabilised at, or was converging to targets, paving the way for policy easing in many jurisdictions. These benign macroeconomic conditions were, however, jolted by the conflict in the Middle East in late February 2026. In this second phase of the review period, the ensuing crisis of energy supply and other raw materials, following the historic closure of the Strait of Hormuz, cast shadows over the global outlook.
A resilient start
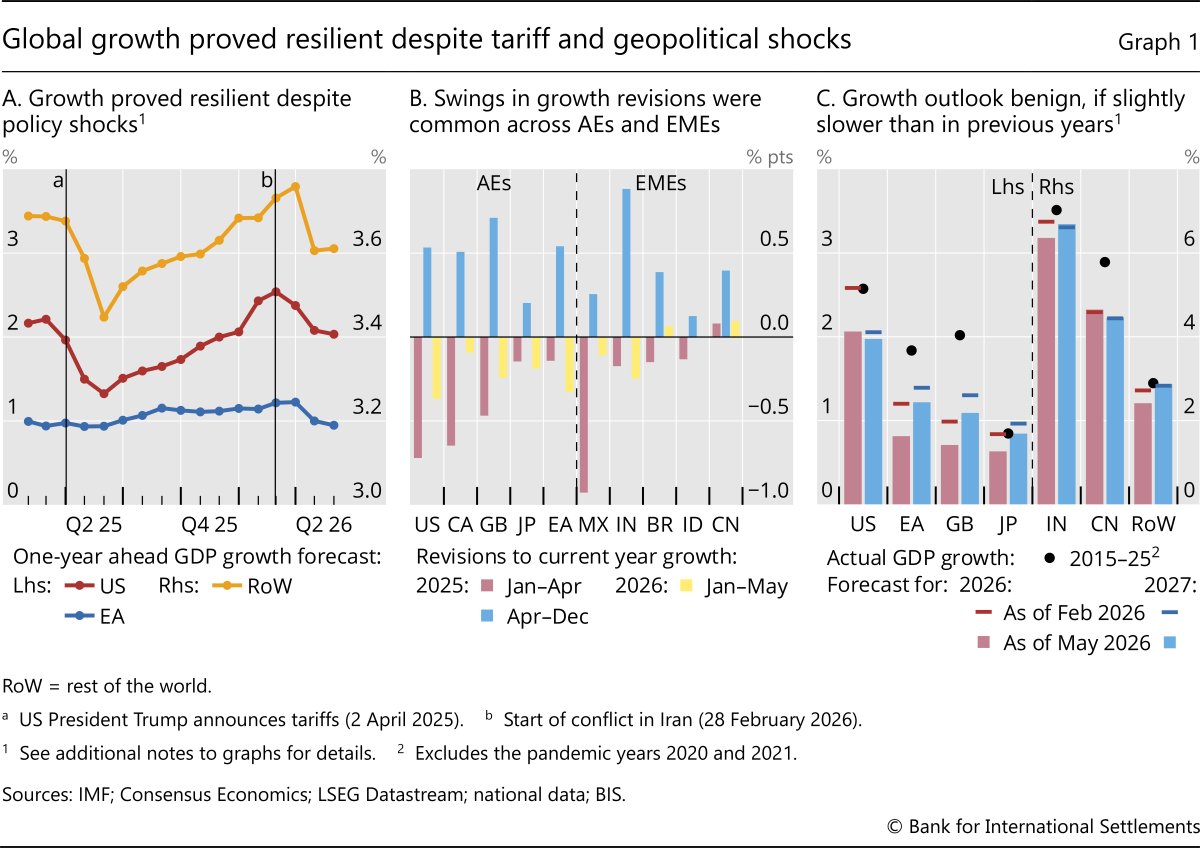
The global economy absorbed the sharp hikes in US tariffs during 2025 – the most significant disruption to the multilateral trading system in decades – with remarkably little damage. Global trade continued to expand, with merchandise volumes growing nearly 5% in the first half of 2025, despite skyrocketing trade policy uncertainty. Growth forecasts, initially cut sharply in response to tariff news especially for the United States, were subsequently revised upward to pre-April 2025 levels (Graph 1.A). The upward revisions were observed in both advanced economies (AEs) and emerging market economies (EMEs) (Graph 1.B). In China, robust exports helped sustain growth despite real estate overhang and subdued domestic demand. By end-2025, global growth ended up close to pre-tariff expectations. Reflecting this underlying resilience, analysts expected output to expand steadily across most jurisdictions, if slower than past averages (Graph 1.C).
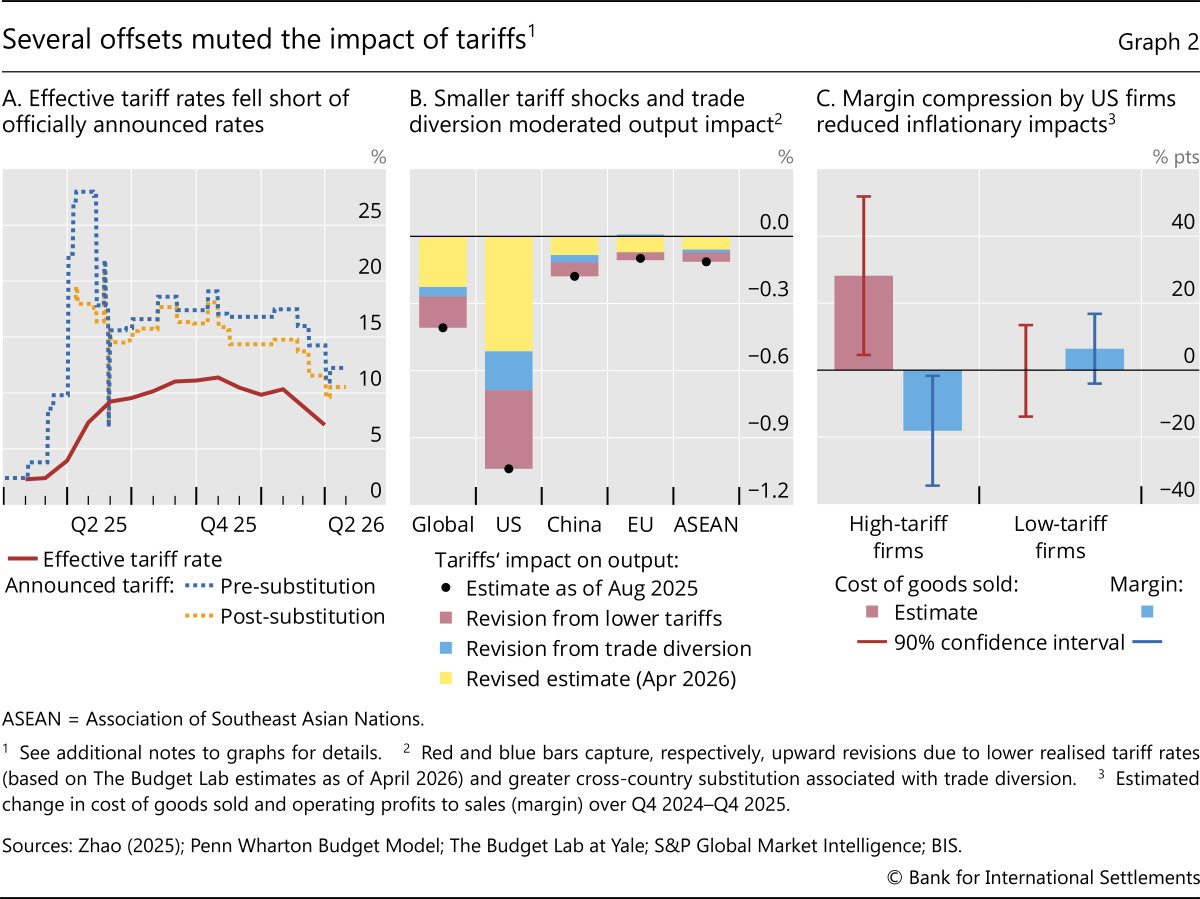
Three main factors can explain the relatively muted effects of tariffs. One is their smaller than expected size. Because of exemptions, trade agreements and measured responses from trading partners that averted escalation, the effective average US tariff rate stabilised at 10% in the second half of 2025, significantly lower than the peak announcement of more than 25% (Graph 2.A). Accounting for this lowers the global output loss by about a third from initial estimates (Graph 2.B, red bars).
Second, trade realignment also mitigated the impact of tariffs. In the case of China, the sharp fall of US-bound exports was compensated by higher exports to other parts of Asia, reflecting substitution and transshipments (see Box A on the adaptability and potential vulnerability of global supply chains). Moreover, China's increased competitiveness in higher value added goods, whose exports grew by 13% in 2025, also helped propel its overall exports.
Third, faced with the prospect of higher tariffs, firms adapted their trading strategies. Significant front-loading of trade before tariffs took effect cushioned both exporters and importers. At the same time, US firms accepted compressed margins, which temporarily limited the price pass-through. Estimates for US firms suggest those most affected by the tariffs absorbed about two thirds of the cost increases through lower profits, while only passing on one third to consumers (Graph 2.C). To manage higher trade policy uncertainty, firms may have delayed passing through higher import prices that would have been difficult to reverse.
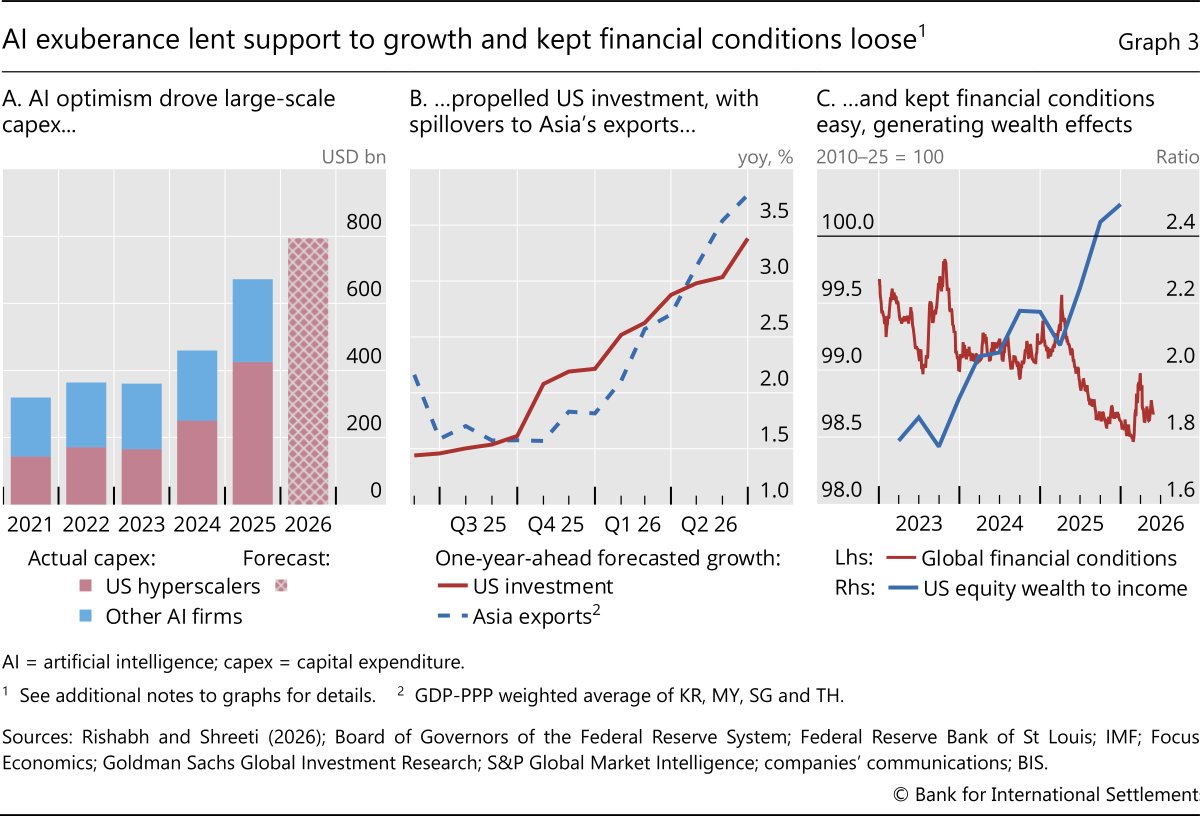
In addition to the tariffs' weakened effects, AI optimism provided an important tailwind to global growth through capital expenditure (capex) and associated intermediate goods trade. Capex in semiconductor purchases, data centre construction and expansion in power infrastructure surged in the United States, driven by the so-called hyperscalers (Graph 3.A). This spending provided impetus to aggregate investment, which became an important driver of growth surprises in the United States (Graph 3.B). The rest of the world, notably Asia, also benefited from demand spillovers through AI supply chain linkages, from semiconductors to data storage units and digital infrastructure (Box A). In China, investment rotated from the property sector to advanced manufacturing. In Europe, investment helped offset tepid consumption amid weak household confidence.
Monetary policy easing provided further support to economic activity in this first phase. With benign growth and moderating inflation, most central banks had lowered interest rates from restrictive to near-neutral levels, where many have paused since late 2025. In a few exceptional cases, central banks hiked interest rates including in Japan due to low real interest rates, and in Australia and Colombia because of domestic inflationary pressures. Meanwhile, central bank balance sheets remained large in key jurisdictions.
Accommodative financial conditions were also a key factor supporting growth during this phase. Financial conditions eased throughout 2025 (Graph 3.C), as the strong surge in global risk appetite fuelled by AI optimism dominated the effects of trade policy uncertainty. Global stocks enjoyed strong rallies on robust corporate earnings, led by major technology and AI-related stocks. Rising equity values, whose ratio to income has more than doubled since 2010, in turn supported household consumption through wealth effects. Corporate credit spreads continued to narrow in major jurisdictions, with robust primary issuance across the ratings spectrum and record volumes from AI-related firms. Investors' risk appetite was also evident in the private credit space, which contributed to the financing of AI infrastructure build-out.
The conflict and its peril
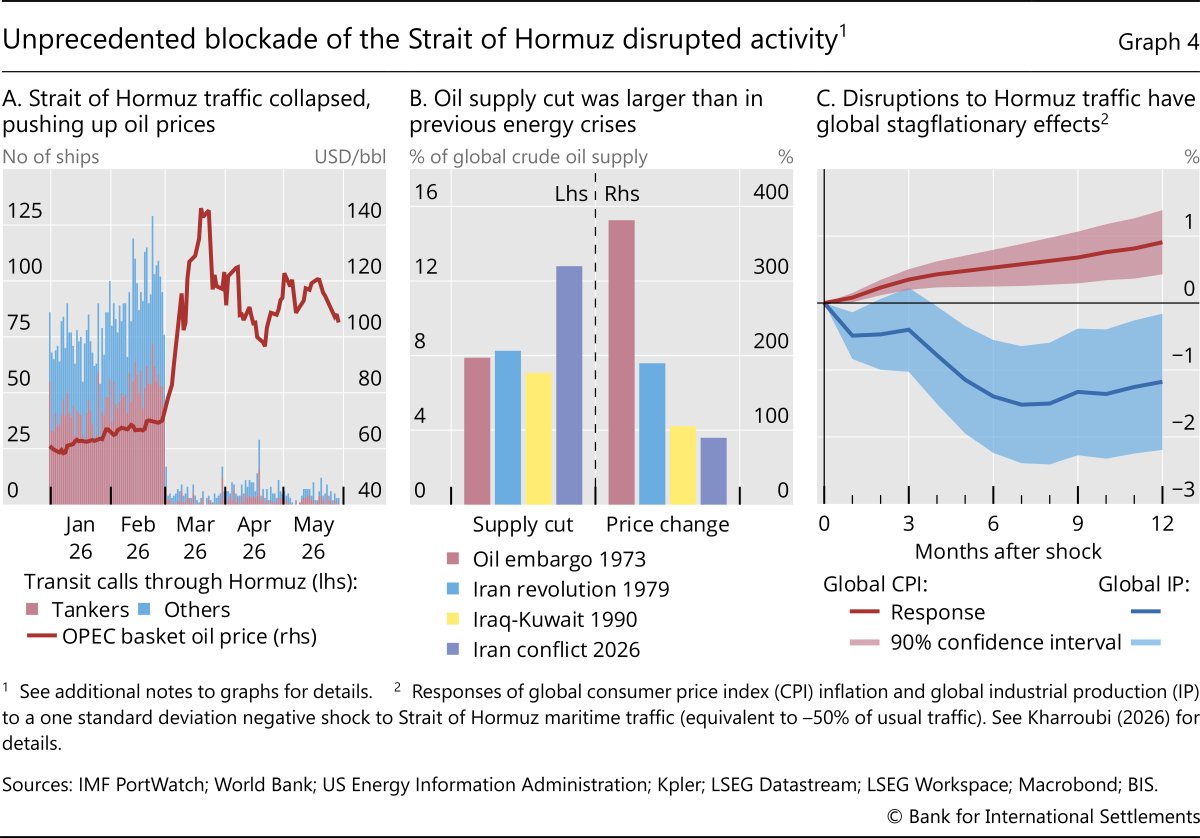
The start of the conflict in Iran in late February 2026 and subsequent escalation – including attacks on energy infrastructure across the Persian Gulf and the effective closure of the Strait of Hormuz – posed a renewed threat to the global outlook. In early March, the unprecedented blockade of the world's most critical energy chokepoint brought the Strait's traffic to a standstill (Graph 4.A). The supply disruption was historically large in terms of volumes lost, with a cut in crude oil flow of over 10 million barrels a day, equivalent to 13% of normal supply (Graph 4.B). By comparison, supply losses in the 1970s energy crises were around 8%. That said, oil prices increased proportionally less than in previous crisis episodes, cushioned by oil reserve drawdown and market participants' conviction that the crisis would prove short-lived.
The prolonged disruption to Strait of Hormuz traffic could have persistent global stagflationary effects, given the Strait's vital role. Past interruptions have weighed on global industrial production and lifted global inflation for a sustained period even after their resolution (Graph 4.C). Compounding the supply disruption this time was the severe lack of immediate substitutes. Bypassing the Strait of Hormuz offers only partial offsets – the Saudi East-West pipeline to Yanbu on the Red Sea can reroute five million barrels a day at most for exports and is itself exposed to attacks. The strategic reserve release of 400 million barrels by the International Energy Agency (IEA), the largest in history, covered only 20 days of lost Hormuz flow.
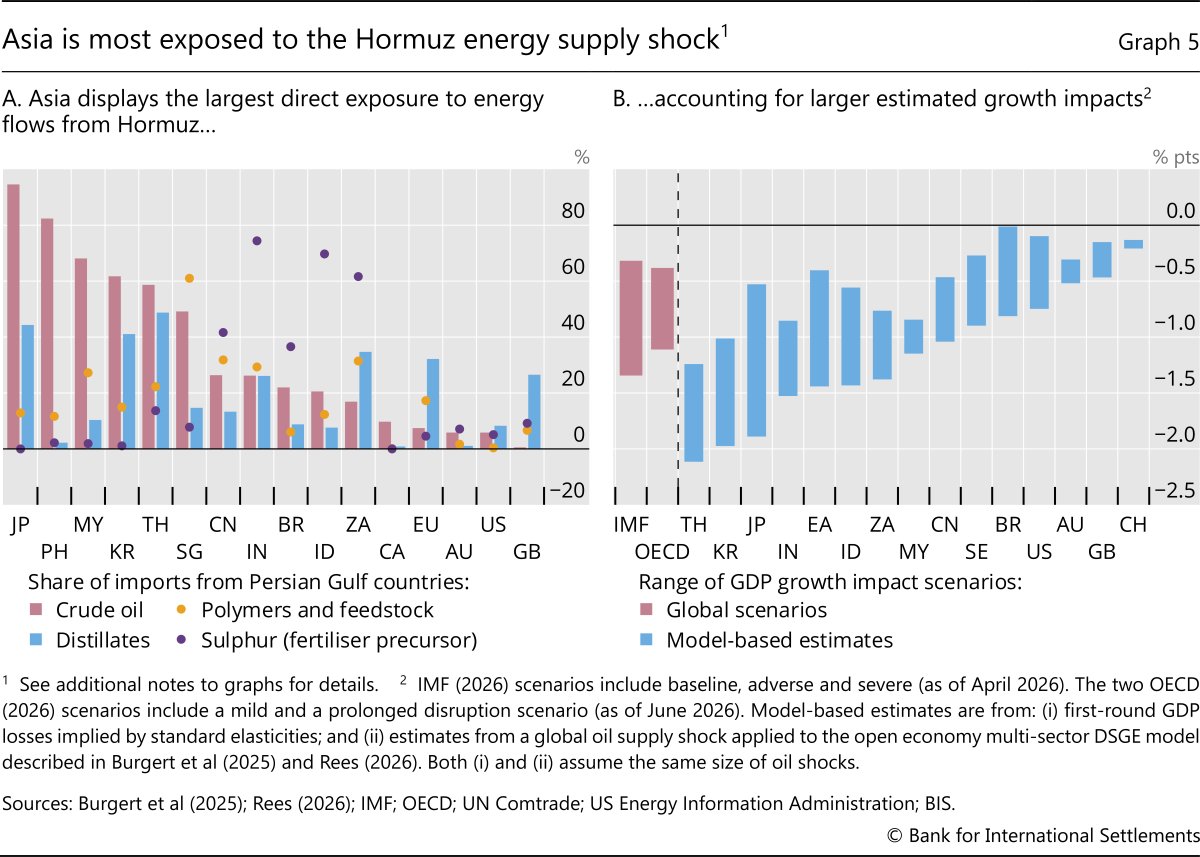
Asia bore a disproportionate brunt of the Strait's closure. Before the conflict, over 80% of crude and natural gas transiting Hormuz was destined for Asia. Japanese refiners sourced 95% of crude from Gulf states, with 70% shipped through Hormuz (Graph 5.A). Malaysia, Korea and Thailand imported between 60 and 70% of their oil from the Gulf, leaving them similarly exposed to Hormuz closure. Consistent with this, model-based estimates point to significant output losses across Asia, with the euro area also exposed through its reliance on distillate imports from the Gulf (Graph 5.B).
The breadth of the supply shock extended well beyond oil and gas, also affecting fertilisers, petrochemicals, plastics and other critical inputs. The Middle East accounts for around a third of global seaborne exports of liquefied petroleum gas, fertilisers and helium – and close to half of seaborne sulphur, a key fertiliser input. Petrochemical plants in South Korea, Japan and Chinese Taipei faced curtailments as both key feedstock (naphtha) and liquefied natural gas (LNG)-dependent electricity were simultaneously constrained. Fertiliser shortages could have persistent effects on global food supply, as missed planting windows cannot be recovered and weaker harvests constrict the next cycle of working capital. Food insecurity impacts would be most acute in low-income economies.
Physical damage to energy infrastructure means supply losses are likely to persist even after the end of the conflict. By late March, more than 40 energy assets across nine Middle Eastern countries had been severely damaged. In Qatar, damage to LNG facilities cut capacity by 17%, with full recovery expected to take up to five years. Equipment bottlenecks compound the problem, with producers of gas turbines needed for LNG compressors carrying order backlogs of three to five years. Even without a blockade, global oil and gas supply could remain well below pre-conflict capacity for months or even years.
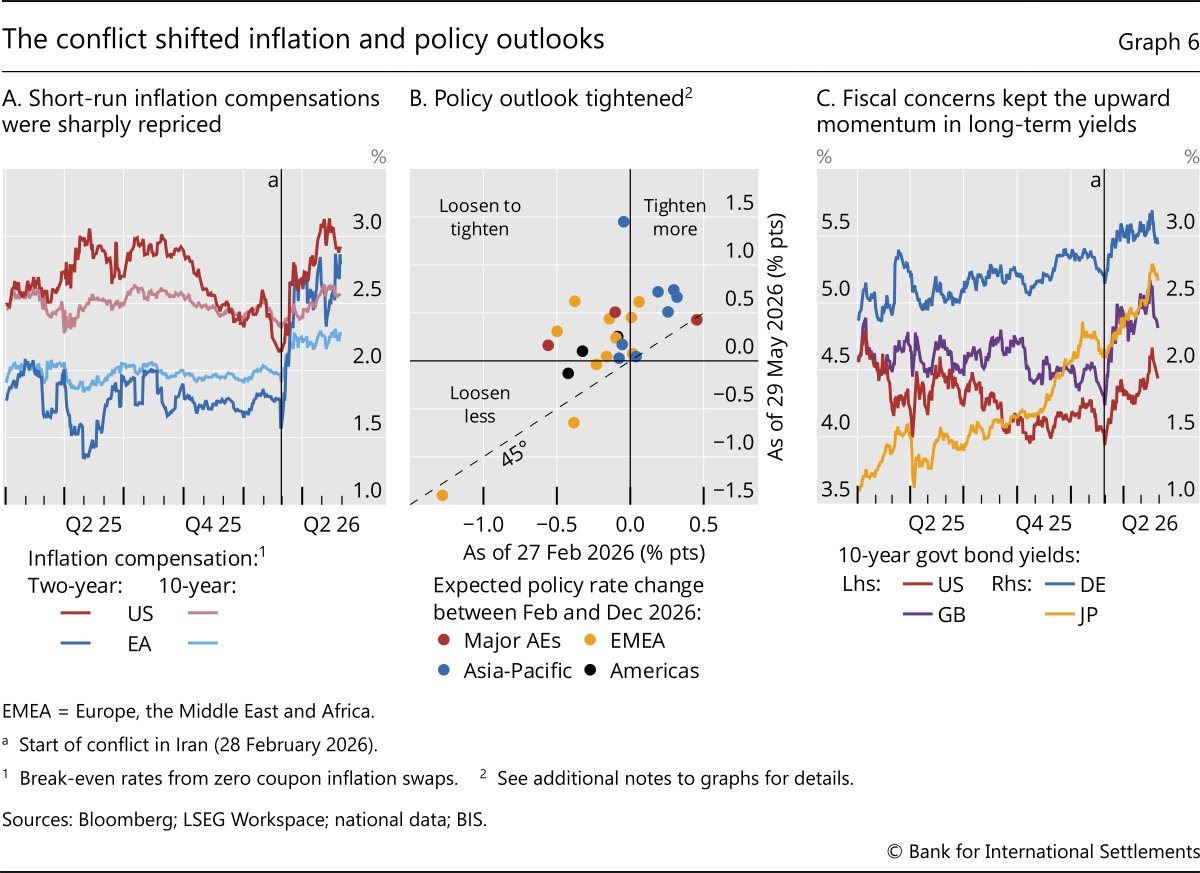
The conflict shifted the perceived inflation and monetary policy outlook. Inflation compensation surged across core markets, particularly in Europe, given its greater exposure to energy supply shocks (Graph 6.A). With looming increases in inflation, market participants started to price in a tighter monetary policy stance across a broad set of countries (Graph 6.B). Central banks that were previously expected to ease or hold rates steady are now expected to raise them, including in the United States, the euro area, the United Kingdom and Canada.
The shift in inflation and policy expectations led to a material increase in nominal yields. The initial adjustment was more pronounced at the short end of the curve, leading to significant flattening in core sovereign markets. But as the conflict dragged on, expectations of higher-for-longer rates and concerns about the fiscal implications raised long-term yields (Graph 6.C). Unwinding in leveraged positions in the cash market may also have contributed to the yield rise, amid the increased presence of non-bank financial intermediaries (NBFIs) in sovereign bond markets (Chapter II). Nevertheless, real short-term rates declined as the nominal rate increase still fell short of the expected pick-up in near-term inflation.
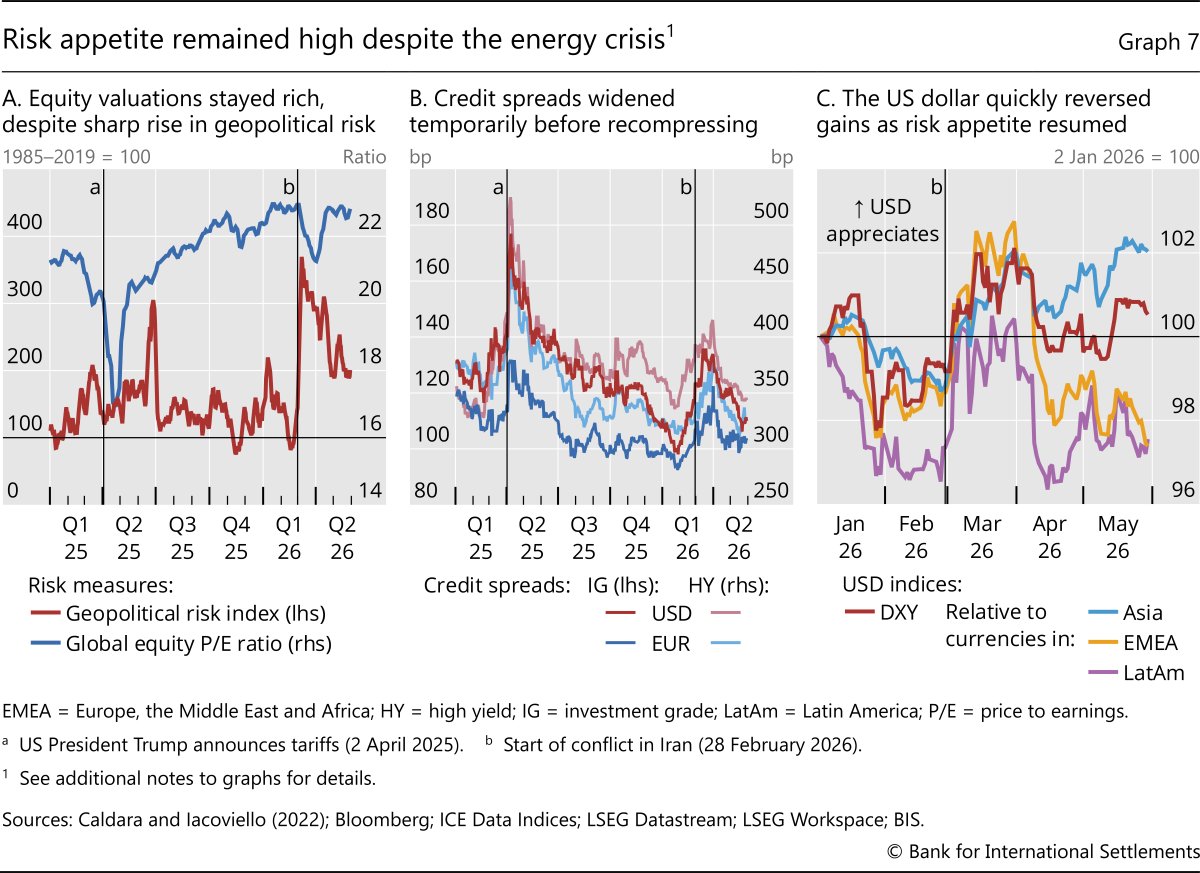
Risk appetite in broader financial markets retreated at the outbreak of the conflict but later recovered strongly. Global equity markets declined 9% from late February to end-March 2026, with the S&P 500 index down 8% over the same period. However, the sell-off was contained relative to previous episodes, such as the 2025 tariff hike (19%), the 1990 Gulf War (17%) or the 1979 Iranian revolution (17%). Even after accounting for strong earnings, equity valuations remained elevated, in an apparent disconnect with the sharp spike in geopolitical risk (Graph 7.A). Similarly, credit spreads widened initially before compressing to levels that were low by historical standards (Graph 7.B). The US dollar followed a similar pattern: it appreciated at the start of the conflict, before paring back some of these gains as risk appetite returned (Graph 7.C). Terms of trade appeared to influence cross-rate movements, as dollar appreciation proved more persistent vis-à-vis Asian currencies, due to the region's reliance on Middle East energy imports.
The dichotomy between buoyant market sentiment and uncertainty about the conflict's macroeconomic fallout is striking. Expectations of a quick and lasting resolution may have been one factor behind the rapid resumption of risk appetite. Confidence in underlying growth resilience, on the back of AI-related spending, is another. At the same time, there are signs that financial markets may not have fully incorporated attendant downside risks. Market-implied volatility and tail risk indicators have moved back close to pre-conflict levels. This benign view contrasts with lingering uncertainty regarding the persistent ramifications of damage already done, particularly for inflation (see below).
Navigating progress and peril
The resilience that characterised the global economy through the review period rested on a specific set of conditions – accommodative financial conditions, synchronised monetary easing and an investment boom sustained by expected transformative technological progress from AI. Each is coming under strain. Four pressure points stand out in particular: risks of persistent inflation, the sustainability of AI-related investment, growing financial vulnerabilities and weakening fiscal positions.
An inflation comeback
The macroeconomic impacts of the Hormuz disruption may not have run their course. The ultimate consequences will depend on how long it will take for the Strait traffic to fully and sustainably resume, and for damaged energy infrastructure to be repaired. Meanwhile, the inflationary impacts are already being felt and could prove persistent, for several reasons.
First, a 10% oil supply loss was significant, and markets could take considerable time to rebalance. The disruption initially caused a violent shift in oil markets, turning the ample inventories prior to the conflict into an acute shortage. Brent prices surged by 67% to an intraday peak of $120 in less than two weeks and have since been subject to significant volatility. Physical crude prices have reacted even more to tighter supply conditions, with some regional crude oil prices matching mid-2008 peaks. Granted, recent de-escalation has brought relief and oil prices have pulled back significantly. But, as argued in Box B, large imbalances in the physical markets remain and could lead to further strains and volatility.
Second, there are already signs of rising inflationary pressures. Global inflation has jumped by half a percentage point since the conflict started (Graph 8.A). Several commodities have seen double-digit price growth. For instance, prices of plastics and fertilisers were both up by 50% – consistent with purchase managers reporting significantly higher input prices. Higher costs and shortages of key inputs could propagate through supply chains, raising the costs of other intermediate goods and amplifying price pressures on final goods (Graph 8.B). Given the time lags in production, the upstream cost increases could continue to pressure inflation well after energy flows and oil prices normalise.
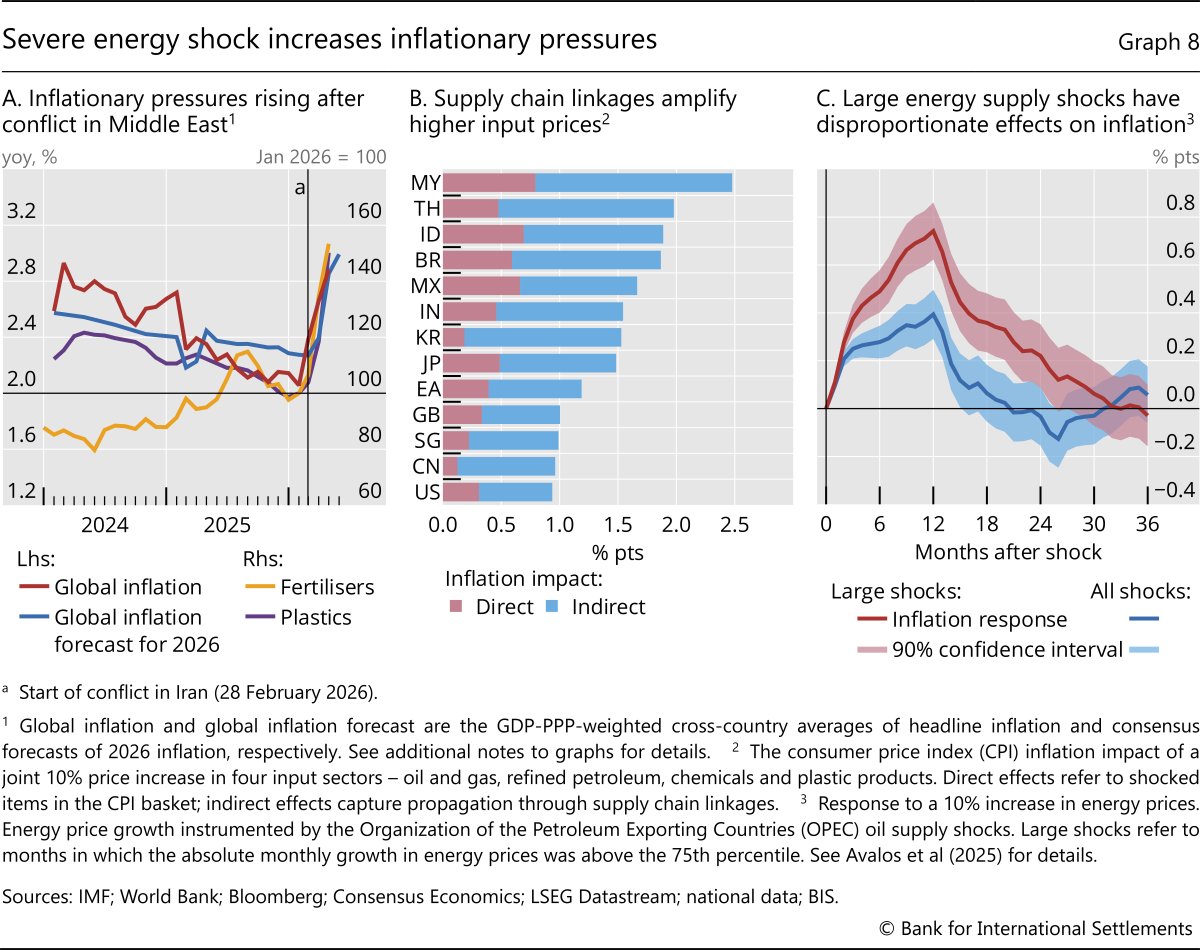
Third, the inflationary impact may scale non-linearly with the size and duration of the oil disruption. Evidence for AEs suggests that inflation is more sensitive to larger energy price shocks (Graph 8.C). One possible reason is that firms are less able to absorb large cost increases and more likely to pass them through to final goods prices. A larger and more persistent energy shock is also more likely to affect a broader set of other commodities, triggering second-round responses of non-energy prices. The cascading effects of the cost increases to date through the supply chain could thus compound and amplify the effects on consumer prices. Post-pandemic high inflation may have also weakened the anchoring of inflation expectations.
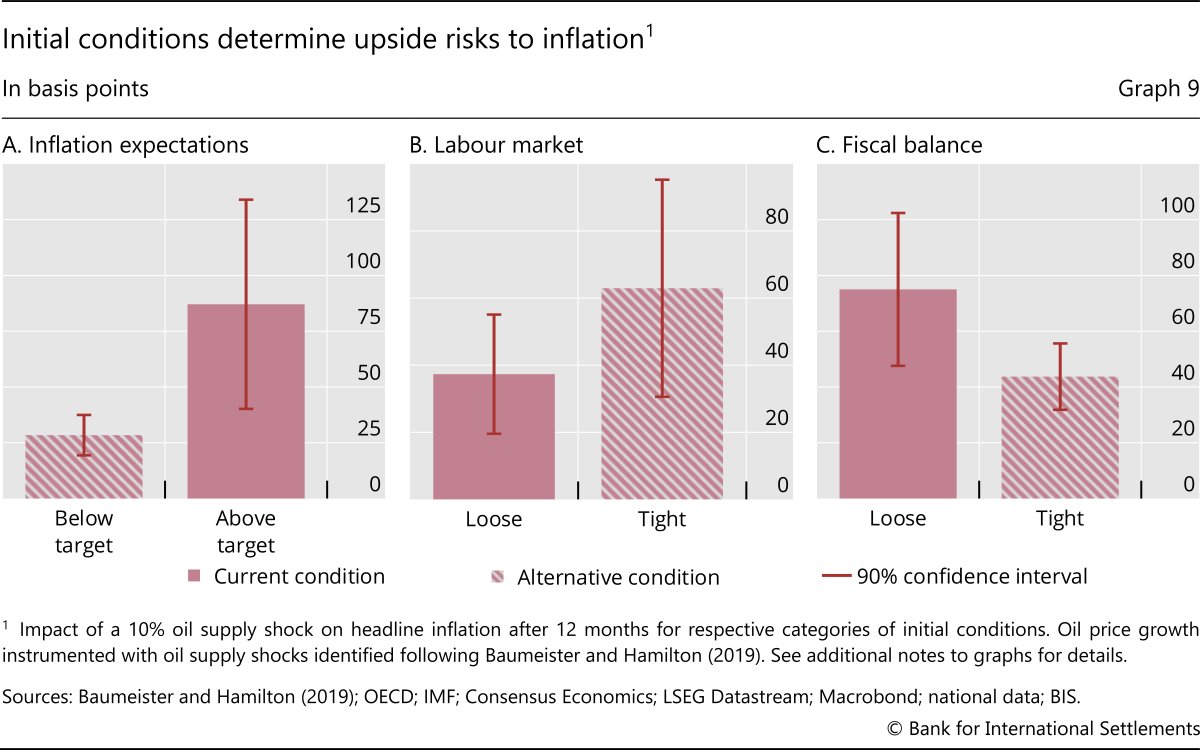
Several mitigating factors could help contain the inflationary impact of the current oil shock. First, the prospective resumption of oil flows through the Strait, if sustained, should help truncate the upside tail risk to inflation. Another is the reduction in energy intensity, which has fallen by more than half in some countries over the past two decades. This reduces the sensitivity of domestic economic activity to higher oil prices, although these gains may be tempered by the embedded energy costs of imported goods. Another mitigating factor is the more favourable macroeconomic context relative to previous inflation surges. Inflation expectations, while still above target in some jurisdictions (Graph 9.A), are lower now than after the start of the Russia-Ukraine war in 2022. Labour market normalisation since 2022 has further reduced the risk of second-round effects and wage-price spirals (Graph 9.B). And while fiscal balances remain looser than average (Graph 9.C), relief spending that is more targeted this time should help strengthen fiscal discipline and lessen the inflationary impact of the current energy shock.
AI progress and investment boom under pressure
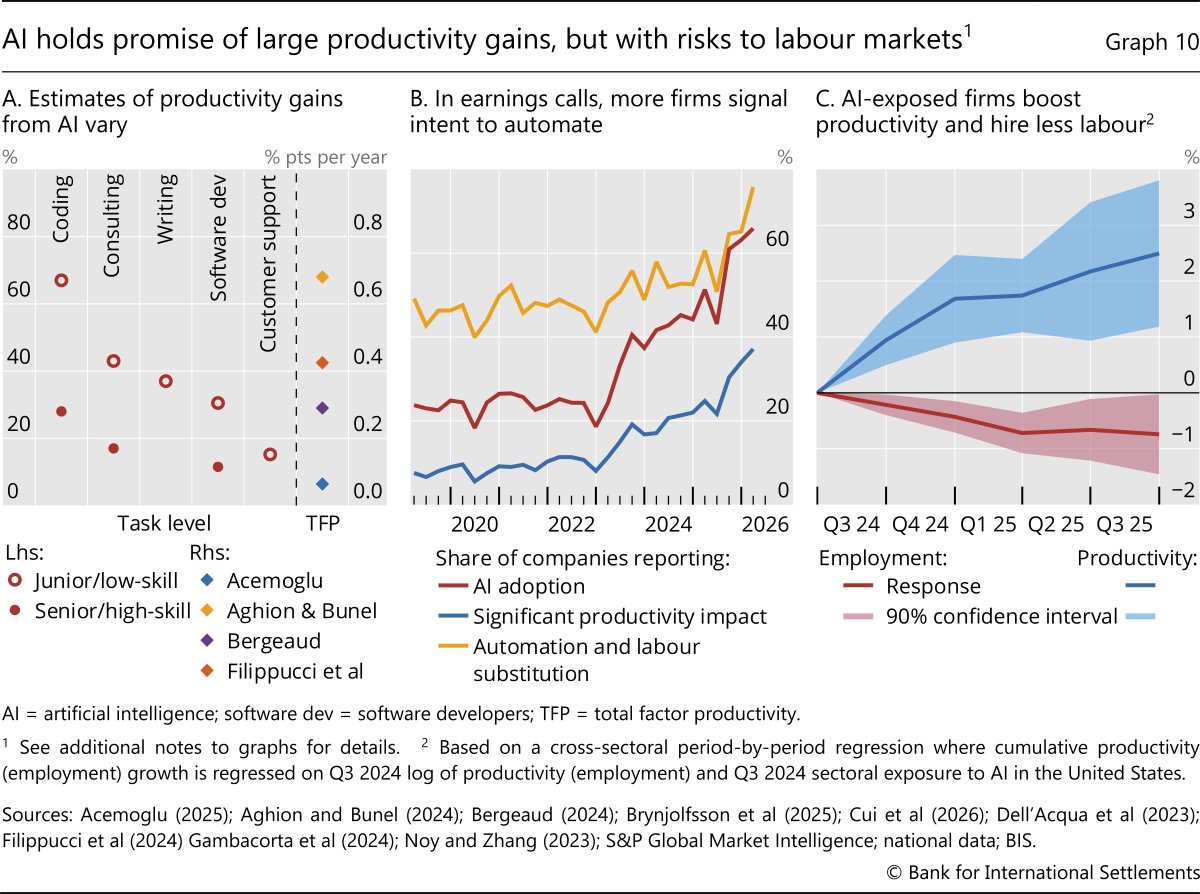
AI has the potential to raise productivity significantly over the coming decade. Task-level studies consistently report large efficiency gains, often to the tune of between 20 and 50% in time savings (Graph 10.A). Aggregate productivity growth estimates tend to be more conservative at less than 1% over a long horizon, reflecting challenges in adopting the technology at scale and integrating it with production processes. Still, there are further upside productivity gains, particularly if the technology improves to the point at which knowledge creation can be automated. The potential implications of such transformative AI for growth, income distribution and monetary policy are profound (Box C).
The transition to a more productive AI-driven economy entails risks, however. As more capable AI tools find applications in more tasks and occupations, labour displacement could intensify. Whether or not AI advances create new jobs – or expand demand for existing ones – sufficiently to make up for such displacements remains uncertain. Unlike past general purpose technologies, AI competes directly with human cognitive abilities, possibly narrowing the scope for workers to move up the value chain or find new non-disrupted tasks. To date, such disruptive labour displacements have yet to occur at scale. But there are signs of possible adjustments to come. In earnings calls, more firms are acknowledging potential productivity gains from AI, signalling their intent to automate an increasing share of production processes and engage in labour substitution (Graph 10.B). Consistent with this, US sectors with higher exposure to AI have also seen higher productivity gains, partly at the expense of lower employment growth relative to other sectors (Graph 10.C).
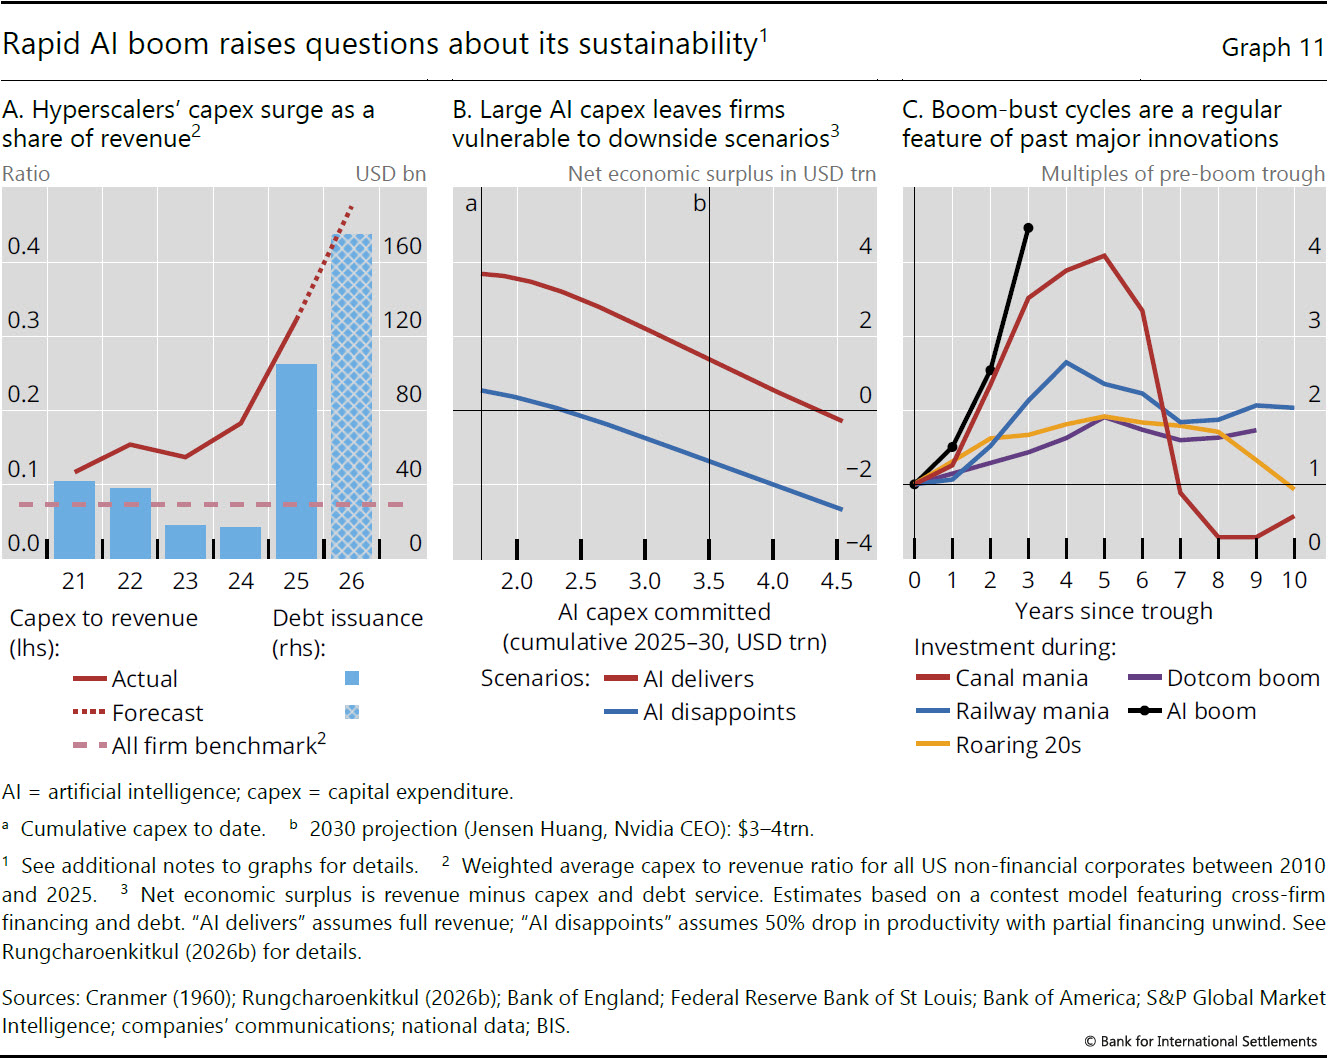
In the near term, the ongoing AI investment boom raises questions about the sustainability of the current economic expansion. The five largest hyperscalers are set to spend over a trillion US dollars on AI-related capital expenditure from 2025 through 2026. These commitments are outpacing earnings and the free cash flow of these firms, leading some to issue debt to raise additional financing (Graph 11.A). This investment race may be partly driven by the perception that only a small number of players with superior technology will ultimately dominate the market shares. The intense competition raises the risk of firms over-committing resources to investment projects with still uncertain returns, leaving all firms vulnerable to disappointments in AI payoffs. Model analysis based on such contest motives highlights the downside risk of current AI exuberance. As competitive pressure drives capex higher, the net economic surplus – the total payoff less investment costs – declines for the sector as a whole and could turn negative in adverse scenarios (Graph 11.B). Disappointment in returns could trigger a sudden pullback in financing and turn the capex boom into a protracted investment bust, with potential knock-on effects on financial conditions (see below).
Another risk is that the AI boom runs into a supply side roadblock. The AI build-out has recently been facing growing bottlenecks in electricity, advanced semiconductors and grid equipment. Fast-growing demand for computing power is already pressuring electricity prices and input costs, with potential spillovers to inflation. Looking ahead, these temporary shortages may also amplify over-investment, as firms attempt to lock in future capacity through long-dated contracts that further expose them to any disappointments in demand.
Historical episodes of investment booms offer instructive parallels (Graph 11.C). The canal mania of the 1830s, the British railway mania in the 1840s, the electrification exuberance of the late 1920s (roaring 20s) and the dotcom boom of the late 90s all shared one common trait: a genuine technological breakthrough that attracted capital in excess of what commercial returns could ultimately justify. These episodes ended with an eventual reversal in investment, inducing economy-wide recessions. The scale and pace of the current AI investment boom accompanied by expectations of large productivity payoffs bear resemblance to these precedents, highlighting potential downside risks in the near term.
Financial vulnerabilities as amplifiers
Should inflation rise significantly or AI-led investment turn to a bust, the macroeconomic consequences could be amplified by existing financial vulnerabilities. A tightening of policy rates needed to contain inflation could precipitate a sharp pullback in asset prices after a prolonged period of exuberant risk-taking, triggering disruptive macro-financial feedback loops. A reversal of AI optimism could likewise have major financial consequences, given AI firms' rising leverage and growing footprint in credit markets. Vulnerabilities extend to their supplier ecosystem, including engineering, procurement and construction (EPC) contractors whose balance sheets are comparatively weak, leaving them exposed to any capex pullback by hyperscalers.
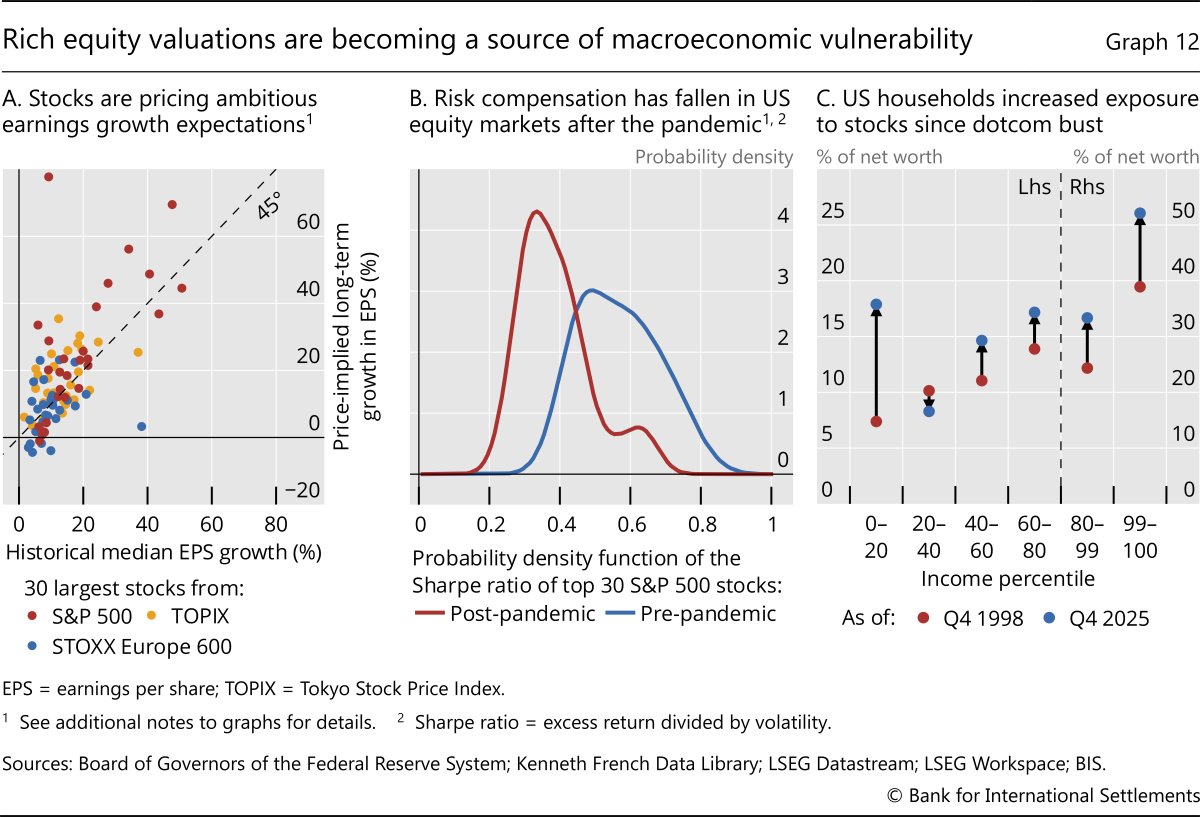
Equity valuations are elevated, particularly for firms at the core of AI development. The implied long-term earnings growth for the largest corporations sits well above recent historical benchmarks (Graph 12.A), with US stocks often trading at large premia to peers in other major markets. These implied rates often exceed even the elevated growth that some of the technology firms have delivered in their relatively short lifetimes. As these firms mature and command a larger share of the market, sustaining such high growth could become increasingly challenging.
Sentiment has also been a major driver of current valuations. Risk premia on the largest US stocks have compressed markedly since the Covid-19 pandemic, with the distribution shifting clearly to the left (Graph 12.B). This points to growing investor complacency and reduced compensation for risk-bearing. Post-pandemic exuberance has been largely broad-based across sectors and countries, coinciding with the rapid rise of AI as an investment theme following the release of generative AI tools in late 2022.
A major equity market correction could have larger macroeconomic consequences today than in the past. Household equity exposures have grown over the past few decades, both relative to total wealth (Graph 12.C) and income (Graph 3.C). A large correction in valuations could have more pronounced wealth effects and sharper consumption pullback than in the past. And with US stocks accounting for an outsized share of global equity markets – about 64% of the MSCI Global index – the wealth impact from a US-led repricing could propagate globally.
Financial stability could also be at risk in the event of an AI bust. Fixed income markets are one obvious vulnerability, given the high volumes of debt issued by hyperscalers, AI labs and EPC firms (Graph 13.A). Should hyperscalers slow or halt the aggressive pace of capex deployment, many borrowers across the supply chain could struggle to replace lost revenue and service their debt. The credit spreads of some AI firms have already begun to widen somewhat to reflect this risk (Graph 13.B), even as equity markets continue to price in significant upside gains.
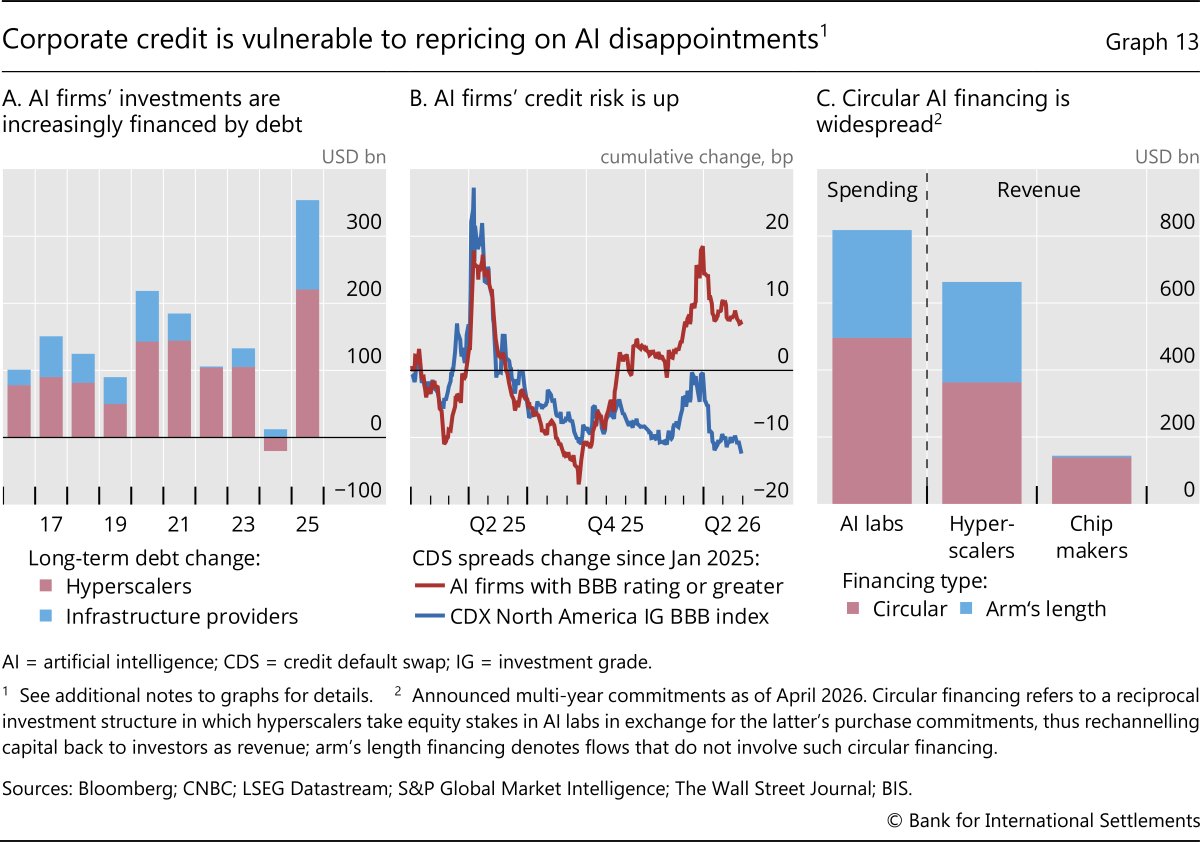
The opacity of AI-sector financing compounds these vulnerabilities. Hyperscalers, chip makers and AI labs are linked through a complex web of private arrangements. The most prominent is circular financing: chip makers and hyperscalers take equity stakes in AI labs or neocloud providers, who in turn commit to multi-year purchases of chips or computing power. Data centre construction is increasingly outsourced to third parties that lease facilities back to hyperscalers on long-dated contracts with embedded exit clauses. The terms of such deals are typically poorly disclosed, with risks of the same asset being pledged multiple times. Together, such arrangements account for a sizeable share of sector-wide financing and forward revenue (Graph 13.C).
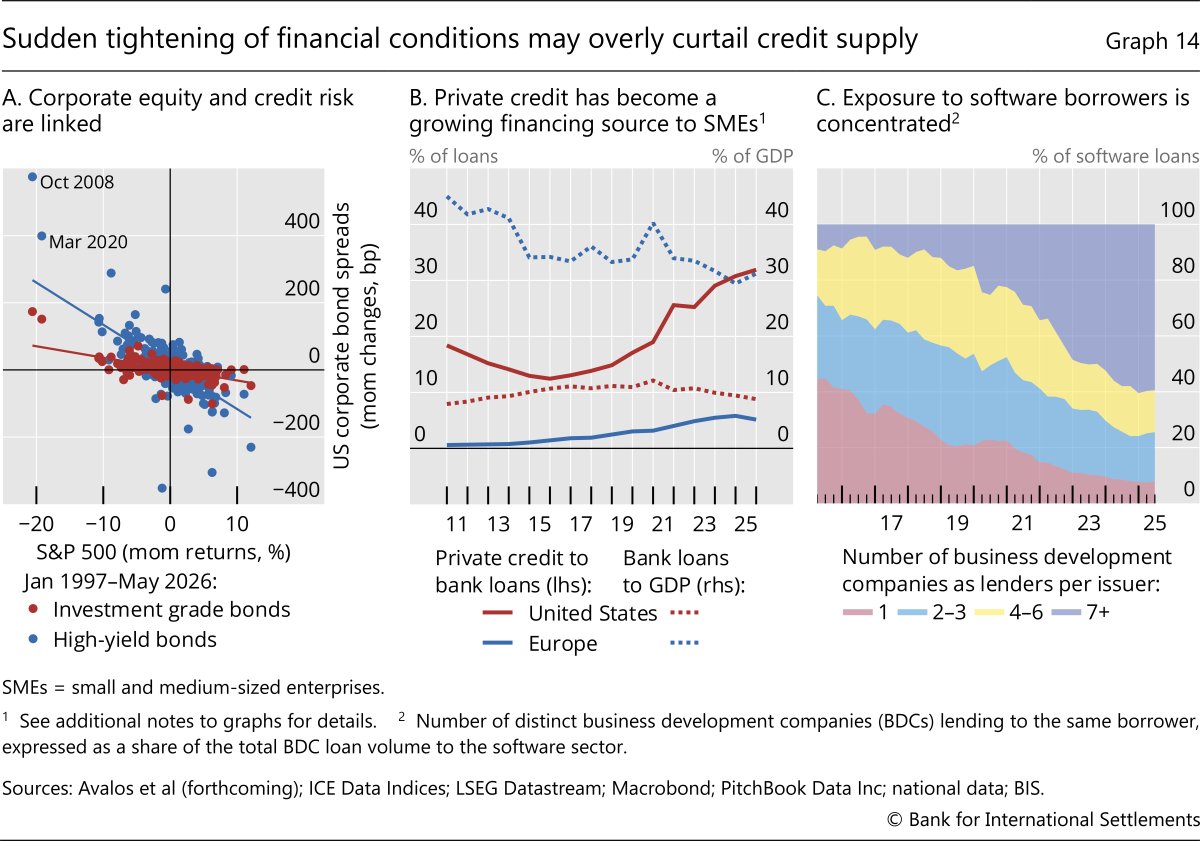
A sharp repricing of equity risk could prompt a reassessment of corporate credit risk and lead to tighter credit conditions more broadly.1 Indeed, broad indices of credit spreads tend to correlate negatively with stock market returns (Graph 14.A), more so for the high-yield than the investment grade segment. While large, synchronised corrections in both markets are rare, there are notable precedents such as the Great Financial Crisis and the March 2020 dash for cash episode. A repricing of risk this time, whether triggered by higher interest rates or an AI bust, has the potential to be similarly disruptive by triggering a corporate credit freeze with wider implications for aggregate investment.
Any tightening in credit conditions could expose existing vulnerabilities in the less transparent private credit space, whose reach has expanded among middle market and small firms (Graph 14.B). Signs of stress are already visible: direct lending funds catering to retail investors have faced mounting redemption requests, forcing some to liquidate assets and return capital despite having no contractual obligation to do so. A larger shock, whether from a renewed inflation surge or a sharp AI-led repricing, could trigger a more widespread credit crunch. The consequences could extend beyond the non-bank perimeter, given banks' growing and opaque exposure to private credit funds, compounded by overlapping ties through insurance companies' balance sheets. Given that the affected segment is smaller corporates that account for a large share of job creation, the real economy implications could be substantial.
The growing role of private credit also raises concentration risks. Direct lending funds, dominant players in the private credit ecosystem, have quadrupled their lending to the AI and information technology (IT) sectors in the past five years, to about 15% of their portfolios.2 These loans tend to be larger than those in other sectors, while their terms such as tenor and pricing remain broadly similar, raising questions about lending standards and risk pricing. Investor enthusiasm has allowed more funds to participate, increasing concentration risks as software firms draw on multiple private credit lenders simultaneously (Graph 14.C).
Cyclical vulnerabilities are compounded by secular forces reshaping the financial system. NBFIs, beyond their roles in private credit activity, are shifting credit and leverage outside the banking sector and interacting with fiscal risks (Chapter II). Advances in AI and digitalisation are changing the contours of financial stability risk. Frontier AI models lower the cost and accelerate the pace of cyber attacks. Money-like digital assets such as stablecoins (Chapter III) introduce run-prone instruments outside the bank perimeter. These challenges are testing the adequacy of the current regulatory framework.
Fiscal positions under increasing strain
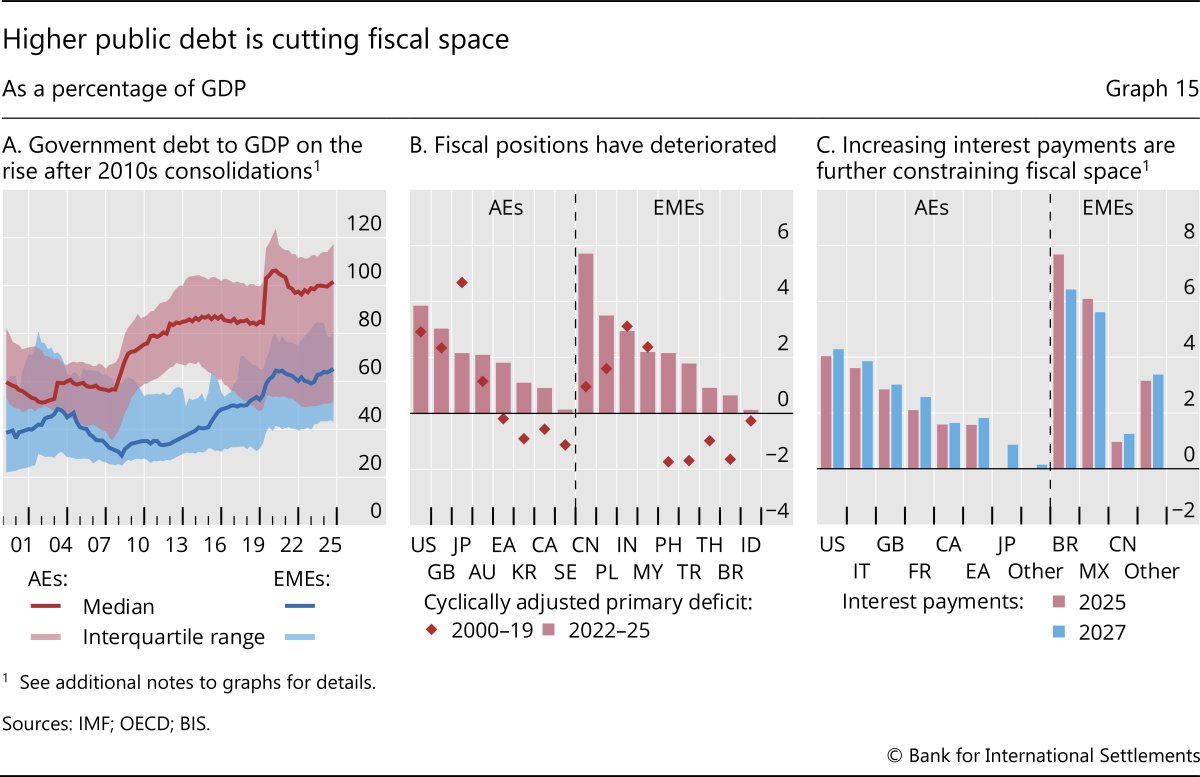
Many countries entered the current energy crisis with limited fiscal space. Public debt in AEs has risen steadily over recent years (Graph 15.A), reducing governments' ability to cushion fallout from higher energy prices. Although the increase partly reflects successive shocks, from the Covid-19 recession to the war in Ukraine, persistent failures to make meaningful progress on fiscal consolidation during economic expansions have also played a part. Cyclically adjusted primary deficits in AEs averaged 1.9% of GDP from 2022 onwards (Graph 15.B), nearly double the 1.1% recorded over the two preceding decades. EMEs have seen an even sharper deterioration (1.8% since 2022 versus 0.1% between 2000 and 2019). Fiscal positions are set to remain strained over the coming years. Debt servicing costs are unlikely to ease soon, as higher interest rate payments continue to weigh on fiscal accounts (Graph 15.C). Deficits in 2027 are projected at or above 2025 levels in most jurisdictions.
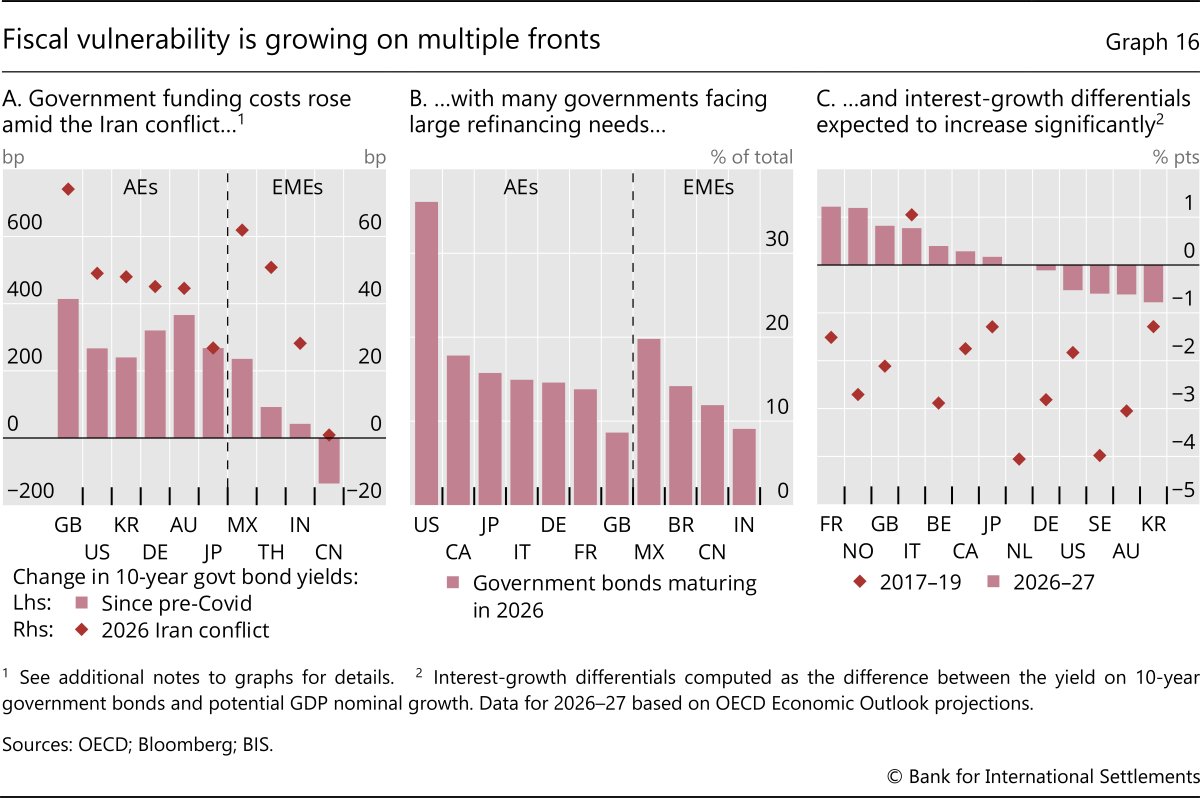
The energy shock exacerbates fiscal pressures on several fronts. Rising energy costs intensify demands for government relief, straining already tight fiscal constraints. Though higher inflation in isolation may relieve fiscal burden, the required responses from monetary policy to rein in inflation may entail higher nominal and real interest rates. The net effects would be further increases in debt servicing costs, more so if inflationary pressures were higher and more persistent (Graph 16.A). Sizeable refinancing needs amplify this impact, as debt coming due is rolled over at higher rates (Graph 16.B). Finally, fiscal arithmetic has become less favourable. The gap between bond yields and nominal GDP growth, previously deeply negative, has reversed and turned positive in many countries (Graph 16.C). Countries can no longer count on nominal growth to stabilise debt dynamics. They now must run primary surpluses or significantly smaller deficits to maintain stable debt-to-GDP ratios.
Policy implications
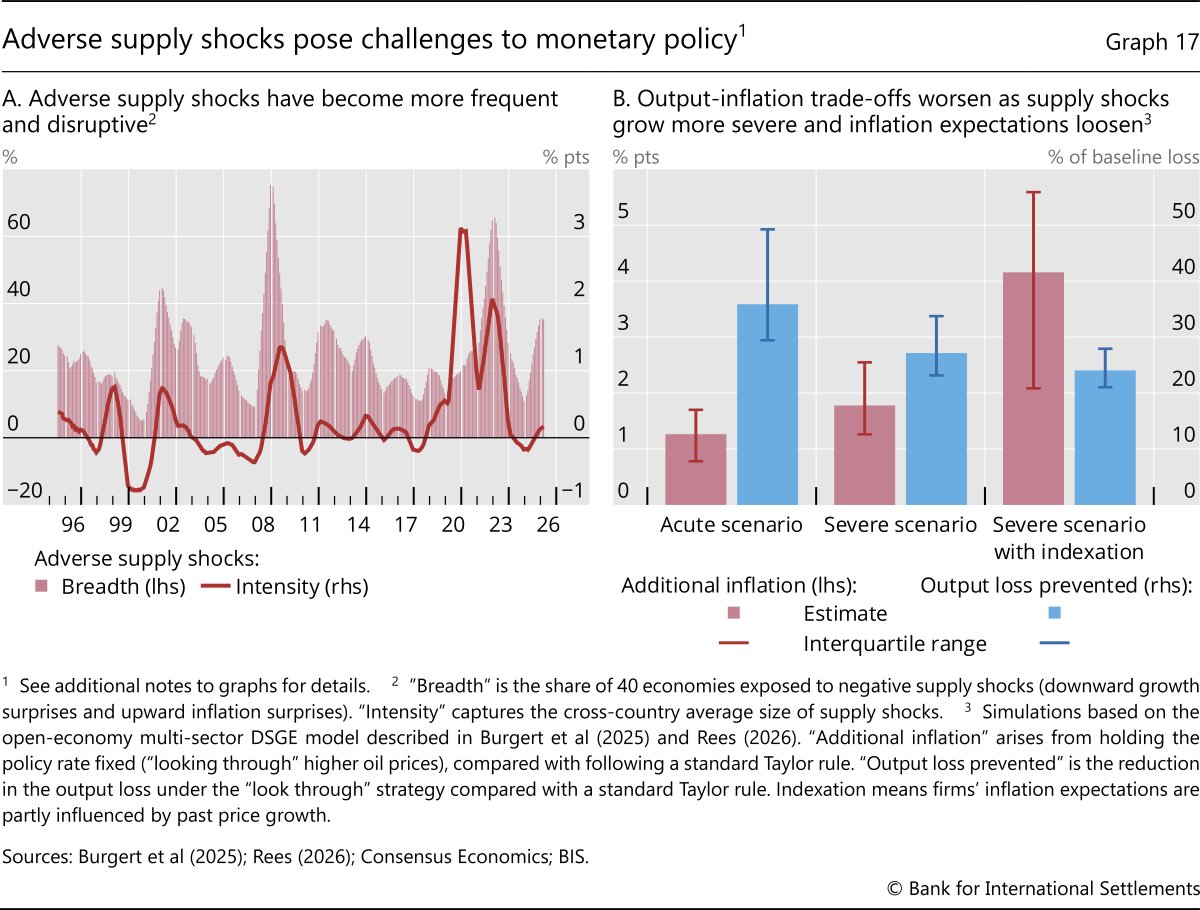
The global economy remains caught in the crosscurrents of progress and peril. Progress in AI and its promise kept financial conditions easy and supported economic activity. At the same time, successive global shocks, from higher tariffs to the conflict in the Middle East, threaten to undermine stability. The global economy and financial markets have so far proven resilient against these shocks. But this resilience is being increasingly tested and strained. Indeed, the new geopolitical environment could be significantly more volatile and precarious than in the past. Adverse supply shocks have become more frequent and more intense (Graph 17.A) – a condition that is set to stay.3
In this context, authorities may have to contend with the increasingly interwoven roles of fiscal and monetary policy. Supply shocks, if persistent, make it harder for central banks to keep inflation in check without adversely affecting growth and unemployment. Meanwhile these shocks also put fiscal policy under pressure to ease households' cost of living burdens. Yet higher public debt crowds out monetary space, weakening the central banks' ability to contain inflationary pressures without further worsening public finance. The separation between fiscal and monetary policies – long a cornerstone of central bank independence and credibility – is coming under growing strain.
Policymakers must also come to grips with multiple structural shifts and their uncertain implications ahead. The AI revolution could boost productivity and ease supply constraints, but there is also significant uncertainty about both the near-term transition and the longer-term payoff. Other structural shifts, from demographic challenges and geoeconomic fragmentation, are likely to shape inflation and growth dynamics across jurisdictions. Macroeconomic policy needs to be robust to these multifaceted uncertainties.
Monetary policy
In response to stagflationary headwinds that worsen policy trade-offs, the rationale to look through temporary supply shocks remains compelling – but only up to a point. As monetary policy can do little to directly offset the first-round effects of a supply shock, accepting a one-off rise in the price level helps avoid amplifying the real income loss, particularly if energy price increases are temporary. But central banks must also be alert to signs of second-round effects and any loosening of inflation expectations. With more protracted supply shocks and more backward-looking expectation formation, the case for looking through weakens, as the inflation costs rise while the ability to prevent large output losses decline (Graph 17.B). With the post-pandemic inflation surge still fresh in the memory, the risks of even transient supply shocks triggering second-round effects and persistent inflation should not be discounted.
The right policy calibration varies across economies, depending on how expectations are formed as well as the magnitude of the growth impact. The Strait of Hormuz disruption has disproportionately affected energy-intensive manufacturing hubs in Asia that depend heavily on oil shipments through the Strait. Where the growth fallout is severe, but inflation expectations remain firmly anchored, there is greater room to look through the shock and adopt a more measured policy response. But there is also an intertemporal consideration – allowing inflation expectations to drift today can worsen future policy trade-offs. In an environment of more frequent supply shocks, the payoff to investing in inflation credibility has increased.
The ongoing AI boom also poses several challenges for monetary policy. While the rapid acceleration of capital expenditures on AI infrastructure has provided a tailwind to global growth, a sustained rapid expansion in the coming years could usher in more pronounced demand pressures, especially via power, construction and specialised input bottlenecks. At the same time, the highly concentrated, partly debt financed AI build-out, with interconnected cash flows and exposures, underscores downside risks to global growth, particularly if any investment pullback is amplified by existing financial vulnerabilities. Over the longer term, AI's eventual effects on productivity, labour markets, income distribution and the role of monetary policy remain highly uncertain. Monetary policy strategies should be robust across a wide range of scenarios.
For EMEs and small open economies (SOEs), these policy trade-offs are sharper still and are shaped by a shifting external environment. Capital flows could become more selective and volatile as geoeconomic fragmentation redraws the cross-border investment landscape along strategic as well as financial lines. This could leave EMEs and SOEs more exposed to sudden and less predictable capital flow reversals. A flexible inflation-targeting approach with judicious use of foreign exchange intervention remains the appropriate core framework, but it must be complemented by deeper domestic capital markets and prudent reserve buffers.4
Safeguarding price stability could become more challenging as fiscal positions deteriorate and pose risks to inflation themselves. Higher defence and energy support spending, alongside rising interest burdens, are adding to budget pressures, at a time when public debt is elevated by historical standards in many countries. At this juncture, monetary policy has a key role to play. By continuing to fulfil its mandate and prioritising medium-term price stability, even when policy actions may have near-term fiscal implications, central banks can help anchor inflation expectations and keep inflation risk premia contained. Staying focused on its inflation mandate also provides a clear signal that supports policy coherence and complements credible medium-term fiscal frameworks aimed at placing public finances on a sounder footing.
Fiscal and structural policy
The overarching task confronting fiscal policy is to reconcile three demands that have become increasingly difficult to satisfy jointly: cushioning households and firms from more frequent supply shocks, meeting rising defence and security commitments, and placing public finance on a sustainable path. The first two cannot be delivered credibly if the third is not. Failure to put fiscal positions on a sound footing in a timely manner could also result in higher risk premia, making the consolidation even more difficult and painful in the future.
These growing challenges call for greater efficiency and more realistic scope for discretionary spending. Support measures in response to current energy supply shocks, where necessary, should be temporary, targeted and tailored. Broad-based subsidies and price caps may be politically expedient but are economically blunt: they distort the relative prices that guide adjustment and compound deficits as shocks persist. They also tend to outlast the circumstances that justified them. Targeted one-off transfers to the most exposed households and firms preserve more fiscal space, leave price signals intact and are easier to withdraw as conditions normalise.
Over the medium-term, authorities must carve out a credible plan that reconciles foreseen increases in defence and social spending with a sound fiscal framework. Adherence to a rule-based consolidation path, together with renewed urgency in delivering on it, would underpin that credibility. Securing such credibility would help keep risk premia contained and secure fiscal space that otherwise could be eroded.
Authorities must resist the temptation to seek monetary escape valves. Pressures on central banks to accommodate fiscal needs – whether through lower interest rates, extended balance sheet support or forbearance on sovereign exposures – may offer apparent short-term reliefs, but they undermine the core pillar on which low and stable financing costs rest. Past episodes in which fiscal-monetary lines have blurred provide unambiguous lessons: the gains are temporary while the costs of restoring credibility are large and protracted, with the ultimate burden falling on households and firms in the form of higher inflation and macroeconomic instability.
The latest Middle East conflict has put energy security and supply chain resilience to the fore, highlighting the role of structural policies. Diversifying suppliers and transit routes lessens exposure to single chokepoints. Maintaining larger strategic reserves can provide a cushion to weather the initial impact of disruptions while markets adjust. Sustained investment in domestic energy sources, including renewables, would also make economies less exposed to external energy shocks. Beyond energy, there is also a need to strengthen supply chain resilience including that of critical inputs. Potential steps include mapping input dependencies, streamlining regulatory approvals for alternative suppliers and, where appropriate, pooling strategic stockpiles with international partners.
Structural policy could also help transform AI's promises into durable output gains. Promoting investment in skills and capabilities to leverage AI across sectors, as well as the digital backbone and energy infrastructure on which AI-enabled productivity depends, are key levers. Competition policy also has a role to play in ensuring that the gains from the technology are diffused and shared widely rather than becoming unduly concentrated among a small number of firms. Broader labour and goods market reforms would also facilitate the efficient reallocation of resources at a time when the global economy is undergoing major technological transformation.
Prudential policy
The combination of exuberant financial markets and elevated geopolitical risks raises the stakes for macroprudential policy to build resilience. The pockets of risk are by now familiar, but their interconnections have deepened. Private credit has grown rapidly and extended into retail channels; leveraged hedge funds have taken on ever-larger roles in core funding and treasury markets; and AI-related financing has become more concentrated and circular within the ecosystem. These interlinkages could turn into powerful amplifiers at times of stress.
A policy response to these interconnections begins with finalising and implementing Basel III consistently across jurisdictions and resisting calls for broad-based deregulation under the umbrella of simplification. The gains in bank resilience over the past decade are encouraging, but not self-sustaining. Unwinding them in pursuit of short-term competitive considerations would forfeit a key buffer on which the global financial system relies. Macroprudential and regulatory policy may also need to lean more firmly against the persistently strong risk appetite and rising opacity that typically accompany financial booms.
Another challenging task lies beyond the banking perimeter. Similar risks warrant comparable treatment regardless of where in the system they sit, which argues for extending rigorous prudential standards to NBFIs, using a mix of entity- and activity-based approaches. These could include imposing minimum haircuts on securities financing transactions, tightening liquidity management requirements for open-ended funds and using central clearing more broadly.5 The data gaps themselves, not least in relation to private credit, also represent a vulnerability, as authorities cannot respond to risks they cannot see. Progress on granular reporting of NBFI leverage, bank-NBFI interconnectedness and private credit exposures must not stall.
Finally, the regulatory and supervisory framework must keep pace with rapid advancements in AI and digitalisation. Supervisory visibility into AI use by market participants needs to improve to capture model-driven correlated exposures, herding behaviour and the potential for algorithmic collusion. Cyber resilience requirements need to reflect the financial system's reliance on a few technology providers and the emergence of frontier AI models capable of identifying and exploiting vulnerabilities at scale. The guiding principle is to reap the benefits of technological progress while ensuring that the broader financial system continues to serve the real economy safely.
Endnotes
1 If a firm's valuation falls, the buffer of the value of its assets over and above the value of its liabilities (ie its net worth) falls too, increasing default probabilities.
2 Aldasoro et al (2026).
3 Since the pandemic, the frequency of adverse supply shocks has surpassed that of negative demand shocks, breaking the pre-pandemic pattern in which negative demand shocks typically dominated.
4 See BIS (2022).
5 See Chapter II for a discussion of the trade-offs that pursuing such regulatory changes would entail.
Additional notes to graphs
Graph 1: Using consensus forecasts.
Graph 1.A: Rest of the world is a GDP-PPP weighted average of 34 countries.
Graph 1.C: Rest of the world is a GDP-PPP weighted average of 30 countries.
Graph 2.A: The effective tariff rate reflects the average rate observed in customs data, which is computed as the value of customs duties as a percentage of the value of imports. Pre-substitution announced tariffs are based on pre-tariffs trade patterns, as published in The Budget Lab's reports. Post-substitution announced tariffs account for post-tariffs adjustments in trade patterns. The announced tariff rates reflect the most conservative scenarios in The Budget Lab's scenarios, including Section 122 extensions, Greenland tariffs and tariff rates before the International Emergency Economic Powers Act (IEEPA) ruling. Not including later revisions by The Budget Lab.
Graph 2.B: Estimates based on the multi-sector trade model of Zhao (2025).
Graph 2.C: Based on regressions across US sector–tariff pairs, run separately for (i) cost of goods sold (COGS) growth and (ii) the change in the ratio of operating profits to sales (margin) between Q4 2024 and Q4 2025. Each outcome is regressed on its corresponding Q4 2024 ratio (COGS to sales or margin), sales growth over the same period, and exposure to tariffs announced on 2 April 2025. Tariff exposure is a dummy variable that is equal to one for firms whose largest pool of suppliers is located in a country tariffed at or above 20% on 2 April 2025. All variables included in the regression are medians at the sector-tariff pair level, weighted by total sales.
Graph 3.A: Total capital expenditures for seven US hyperscalers and 364 other global AI firms, as classified in Rishabh and Shreeti (2026). 2026 capital expenditure forecasts collected from company earnings calls and press releases.
Graph 3.B: One-year-ahead consensus forecasts of investment (gross fixed capital formation) and exports year-on-year growth.
Graph 3.C: US equity wealth to income = corporate equities and mutual fund shares held by US households divided by their disposable personal income. Global financial conditions refer to adjusted Goldman Sachs financial conditions index, excluding policy rate contributions.
Graph 4.A: Others include transit calls by container, dry bulk, general cargo and roll-on/roll-off vessels.
Graph 4.B: Peak supply cuts divided by average of global crude oil supply in the three months prior to the event. Price changes calculated from the month prior to the event to peak using Saudi Arabian Light oil benchmark (until 1980), Dated Brent prices sourced from World Bank Commodity Price Data (1990 episode) and the Brent crude prompt price for delivery in 10 days at the Sullom Voe terminal (2026 episode).
Graph 4.C: Based on local projection regression where log of global CPI (global IP) index h month ahead is regressed on current log of global CPI (global IP) and the current shock to maritime traffic in the Strait of Hormuz. Traffic shocks are computed as deviations of observed traffic from average across time and chokepoints, considering the period 2019–26 and the 12 busiest chokepoints worldwide, yielding 21 observations with a traffic deviation larger than one standard deviation, 10 of which were on the negative side (disruptions).
Graph 5.A: Share of total trade value imported from the following Persian Gulf countries in 2024: AE, KW, SA and QA. Polymers = PE, PP, PET and PVC; feedstock = methanol, PTA and MEG.
Graph 5.B: 2026 growth impact used for both IMF and OECD. IMF global impact scenarios cover three scenarios; a baseline (upper bound) scenario, an adverse and a severe scenario. The baseline scenario is constructed bottom-up from individual country projections before and after the outbreak of the latest Middle East conflict. The adverse (severe) scenario assumes an oil price increase of 80 (100)% and gas price increase of 160 (200)% starting in Q2 2026, relative to the January 2026 World Economic Outlook Update, with the increase mostly unwinding in 2027. OECD impact scenarios cover two scenarios – a mild and a prolonged disruption scenario. The prolonged disruption scenario assumes oil, gas and fertiliser prices rise by 50% relative to the mild disruption scenario until Q3 2027, followed by a gradual decline as supplies recover. It also assumes lower technical efficiency due to energy rationing and supply chain disruptions, higher household saving and tighter financial conditions. The mild scenario assumes disruptions to be shorter-lived. See OECD (2026) for details.
The range of model-based scenarios is based on a model of first-round GDP losses, and from a multi-sector model. First-round GDP loss estimates capture two first-round channels: the income drain from higher oil import costs and the demand drag due to any transfers from consumers to domestic oil producers with lower marginal propensity to consume (MPC). The consumer's MPC is set at 0.6 based on the literature. The producer's MPC is set at 0.2, calibrated to replicate a 0.1 percentage point US GDP impact per $10/barrel shock (Briggs et al (2026)). Estimates are based on an increase of oil prices of $30/barrel.
Graph 6.B: Americas = CA, CL and MX; Asia-Pacific = AU, CN, IN, KR, MY, NZ, PH and TH; EMEA = CH, CZ, DK, GB, HU, IL, MA, NO, PL, SE and ZA; major AEs = EA, JP and US.
Graph 7.A: Seven-day moving averages. Geopolitical risk index constructed as number of articles related to adverse geopolitical events as a share of the total number of articles in 10 newspapers each month. See Caldara and Iacoviello (2022) for details.
Graph 7.B: Corporate spreads of ICE BofAML index yields to OIS rates with matched maturities. Ten-year OIS for US investment grade, five-year for the rest. The USD OIS rate is based on SOFR. The EUR OIS rate is based on ESTR.
Graph 7.C: US Dollar Index (DXY) is a weighted index of EUR, JPY, GBP, CAD, SEK and CHF to the US dollar. Simple averages of nine Asian; nine EMEA and five Latin American economies.
Graph 8.A: Global inflation is the GDP-PPP weighted average of headline inflation across 16 AEs including EA and 22 EMEs excluding AR and TR. Global inflation forecast for 2026 is based on consensus data and is the GDP-PPP-weighted average of headline inflation across 16 AEs including EA and 18 EMEs.
Graph 9: Each panel shows estimates from sample splits based on the listed variable at the time of shock. The latest available simple average of countries in the sample defines which initial condition is referred to as the current condition (solid bars). Sample = AR, BR, CA, CN, CZ, GB, HU, IN, JP, KR, MX, MY, NO, PL, SE, TR and US, subject to data availability. See Banerjee et al (forthcoming) for details.
Graph 9.B: Loose (tight) labour market measured as below (above) median labour market gap based on a Hodrick-Prescott (HP) filtered unemployment rate.
Graph 9.C: Loose (tight) fiscal balance measured as the headline fiscal balance being below (above) median over the sample.
Graph 10.A: Data sources for task level productivity gains: coding output from Gambacorta et al (2024); consultant tasks from Dell'Acqua et al (2023); clerical tasks and writing from Noy and Zhang (2023); software developers' productivity from Cui et al (2026); and customer support from Brynjolfsson et al (2025).
Graph 10.B: Share of companies reporting the following in their earnings calls: early stage or advanced use of AI within the business, significant positive impact of AI on company productivity and actual or potential reduction in labour input due to AI or automation. Based on earnings call analysis using a large language model.
Graph 10.C: Sectoral exposure to AI measured as the fraction of data scientists in sectoral employment in Q3 2024, as reported in the US Bureau of Labor Statistics occupational employment survey (OES). Data on sectoral real value added comes from the US Bureau of Economic Analysis national income and product accounts (NIPA) tables.
Graph 11.A: Based on financial data of the five biggest US based hyperscalers: Alphabet, Amazon, Meta, Microsoft and Oracle. Simple averages for capex to revenues ratio and total gross debt issuance. 2026 capital expenditure and revenue expectations collected from earnings calls and press releases. 2026 debt issuance as projected by Bank of America.
Graph 11.B: Cross-firm financing involves hyperscalers engaging in partnerships with labs, by taking on equity stakes in exchange for purchase commitments (circular financing). Financial unwind involves partial dissolution of partnerships and debt fire sales. Calibration is disciplined by observed AI deal data and historical technology boom evidence.
Graph 11.C: Episodes refer to the following series and pre-boom troughs refer to the following years. Canal mania = US canal construction spending, 1835; railway mania = GB real investment, 1843; roaring 20s = US private fixed asset investment, 1921; dotcom boom = US private fixed investment in information processing equipment and software, 1995; AI boom = AI hyperscalers' capital expenditure, 2023. AI hyperscalers' 2026 capital expenditure collected from earnings calls and press releases.
Graph 12.A: Long-term yearly EPS growth calibrated from Campbell-Shiller present value equations for each stock, under the maintained assumption that in the long run dividends will grow in line with earnings. Historical median EPS growth is based on February 2003 to January 2026. Data for thirty largest stocks by market capitalisation in each of the S&P 500, STOXX Europe 600 and TOPIX as of 26 March 2026.
Graph 12.B: Kernel distributions are constructed using monthly Sharpe ratios of an equally weighted portfolio of the 30 largest stocks in the S&P 500. Pre-pandemic period corresponds to January 2014 through December 2019. Post-pandemic period corresponds to January 2021 through January 2026. The largest 30 stocks in the S&P 500 represent 56% of the index value as of 26 March 2026.
Graph 13.A: Yearly changes in long-term debt (net). Based on global financial statements data for seven hyperscalers and 43 global infrastructure providers operating in the following business segments: power and distributions, engineering and construction, networking, cooling systems and AI neoclouds.
Graph 13.B: Cumulative changes in five-year CDS spreads since 1 Jan 2025. Simple average of AI-firms with a BBB or greater long term credit rating: Alibaba, Alphabet, Amazon, AMD, Baidu, Broadcom, Intel, Meta, Microsoft, Nvidia, Oracle, SK Hynix, Tencent and TSMC.
Graph 13.C: Authors' calculations based on company announcements and SEC filings, and on reporting/estimates from Bloomberg; CNBC and The Wall Street Journal.
Graph 14.B: Outstanding bank loans in the United States (commercial and industrial loans) and Europe (loans to non-financial corporates in EA and GB). Invested capital of private credit funds in the United States and Europe.
Graph 15.A: Quantiles are weighted by the logarithm of each country's nominal GDP. Based on data for 12 AEs and 16 EMEs.
Graph 15.C: General government, net interest payments; OECD (2026) data if available, IMF (2026) data otherwise. For the regions, GDP-PPP weighted averages for ten other AEs and 19 other EMEs.
Graph 16.A: Changes since pre-Covid period refers to changes since January 2020. For the Iran conflict, changes are 27 February–27 March 2026.
Graph 17.A: Adverse supply shock intensity is constructed as 0.5 (CPI surprises – GDP surprises), reported as the simple average across 40 economies. Only country-months where growth and inflation surprises move in opposite directions consistent with supply shocks are included in calculations. Breadth and intensity are both shown as 12-month moving averages. Growth and inflation surprises are based on annual consensus forecasts. 2026 uses data up to March.
Graph 17.B: Acute scenario features a 50% increase in global oil prices that decays at a rate of 40% per quarter. Severe scenario features a 50% increase in global oil prices that decays at a rate of 5% per quarter. Severe + indexation scenario features a 50% increase in global oil prices that decays at a rate of 5% per quarter and an assumption that industry-level price growth is indexed to its rate in the previous quarter for firms outside the oil, agriculture and mining industries. Estimates correspond to the effects in the first 12 quarters in each scenario.
References
Acemoglu, D (2025): "The simple macroeconomics of AI", Economic Policy, vol 40, no 121.
Aghion, P and S Bunel (2024): "AI and growth: where do we stand?", mimeo.
Aldasoro, I, S Doerr and D Rees (2026): "Financing the AI boom: from cash flows to debt", BIS Bulletin, no 120.
Avalos, F, R Banerjee, M Burgert, B Hofmann, C Manea and M Rottner (2025): "Commodity prices and monetary policy: old and new challenges", BIS Bulletin, no 96, January.
Avalos, F, G Cornelli and E Eren (forthcoming): "Software exposure and vulnerabilities to AI disruption in private credit", BIS Bulletin.
Banerjee R, F De Fiore, M Lombardi and G Lombardo (forthcoming): "Monetary policy responses to supply-side shocks", BIS Bulletin.
Bank for International Settlements (BIS) (2022): "Macro-financial stability frameworks and external financial conditions", report submitted to the G20 Finance Ministers and Central Bank Governors.
Baumeister, C and J Hamilton (2019): "Structural interpretation of vector autoregressions with incomplete identification: Revisiting the role of oil supply and demand shocks", American Economic Review, vol 109, no 5.
Bergeaud, A (2024): "The past, present and future of European productivity", POID Working Paper, no 103.
Briggs, J, M Peters and S Dong (2026): "Global economics comment: global economic impacts of the war in Iran", Goldman Sachs Economics Research.
Brynjolfsson, E, D Li and L Raymond (2025): "Generative AI at work", Quarterly Journal of Economics, vol 140, no 2.
Burgert, M, G Cornelli, B Erik, B Mojon, D Rees and M Rottner (2025): "The BIS multisector model: a multi-country environment for macroeconomic analysis", BIS Working Papers, no 1297.
Caldara, D and M Iacoviello (2022): "Measuring geopolitical risk", American Economic Review, vol 112, no 4.
Cranmer, H (1960): "Canal investment, 1815–1860", in W Parker (ed), Trends in the American economy in the nineteenth century, Princeton University Press.
Cui, K, M Demirer, S Jaffe, L Musolff, S Peng and T Salz (2026): "The effects of generative AI on high-skilled work: evidence from three field experiments with software developers", Management Science.
Dell'Acqua, F, E McFowland III, E Mollick, H Lifshitz-Assaf, K Kellogg, S Rajendran, L Krayer, F Candelon and K Lakhani (2023): "Navigating the jagged technological frontier: field experimental evidence of the effects of AI on knowledge worker productivity and quality", Harvard Business School Working Paper, no 24-013.
Dutta, A (2026): "US LPG exports hit record high in April on curtailed Hormuz Strait traffic", S&P Global Energy News, 5 May.
Falakshahi, H (2026): "Running out of barrels: cumulative oil losses hit 133 mbbls since the star of the war", Kpler, 20 March.
Falk, B and G Tsoukalas (2026): "The AI layoff trap", 2603.20617.
Fattouh, B and A Mehdi (2026): "Through the looking glass: oil and the search for direction", OIES Energy Comment, March.
Filippucci, F, P Gal and M Schief (2024): "Miracle or myth? Assessing the macroeconomic productivity gains from artificial intelligence", OECD Artificial Intelligence Papers, no 29.
Food and Agriculture Organization of the United Nations (2026): "FAO chief economist warns of severe global food security risks from disruption to Strait of Hormuz trade corridor", 26 March.
Fornaro, L and M Wolf (2026): "Macroeconomic policies for AI", mimeo.
Gambacorta, L, H Qiu, D Rees and S Shan (2024): "Generative AI and labour productivity: a field experiment on coding", BIS Working Papers, no 1208.
Garduno, J and G King (2020): "Managing risks and reducing damage from well shut-ins", Journal of Petroleum Technology, April.
I'Anson, R (2026): "Iran war and the Strait of Hormuz: oil markets implications six weeks in", Kpler, 7 April.
International Monetary Fund (IMF) (2026): World Economic Outlook, April.
Jones, C and C Tonetti (2026). "Past automation and future AI: how weak links tame the growth explosion", mimeo.
Kharroubi, E (2026): "On the real and financial implications of the closure of the Hormuz chokepoint", mimeo.
Mayer, M (2020): "Well intel: shut-in or shut down, how do shut-ins impact well performance?", TGS.
Noy, S and W Zhang (2023): "Experimental evidence on the productivity effects of generative artificial intelligence", Science, vol 381, no 6654.
Organisation for Economic Co-operation and Development (OECD) (2026): Economic Outlook, no 1, June.
Rees, D (2026): "Why do the effects of oil price shocks vary across countries? An industry perspective", mimeo.
Rishabh, K and V Shreeti (2026): "The geography of AI firms", BIS Working Papers, no 1343.
Rungcharoenkitkul, P (2026a): "Transformative AI, demand bottlenecks and R-star", mimeo.
-----(2026b): "AI investment race", mimeo.
Rystad Energy (2026): "Ceasefire pulls oil off war highs, but physical markets need time to rebalance", 8 April.
Trammell, P and A Korinek (2023): "Economic growth under transformative AI", NBER Working Paper, no 31815, revised 2026.
US Department of Agriculture (2026): Prospective plantings.
Van Nieuwerburgh, S (2026): "Financing the AI buildout", Journal of Economic Perspectives, forthcoming.
World Trade Organization (WTO) (2025): World Trade Report 2025: making trade and AI work together to the benefit of all, September.
Zhao, H (2025): "Assessing the macroeconomic impacts of the 2025 US tariffs", BIS Working Papers, no 1316.