On the global retreat of correspondent banks
Correspondent banks have been paring back their cross-border banking relationships for the past decade. The retreat is broad-based, but affects some countries more than others. Jurisdictions with weaker governance and deficient controls to prevent illicit financing have lost more relationships, while trade and growth were supportive. Technological developments, as well as private and public sector initiatives, could help to reduce frictions in cross-border payments. Further monitoring and action are warranted to ensure that all countries enjoy access to safe, low-cost cross-border payment channels.1
JEL classification: F23, F24, F35, G21, G28.
Cross-border payments are vital for economic development in a globalised economy. The bulk of payments flows through correspondent banks that operate a vast network of bank relationships. These critical linkages facilitate the cross-border payments that underpin global trade, finance and remittances.
Yet, over the past decade, cross-border correspondent bank relationships have declined by about one fifth. Policymakers across the globe have focused on understanding the causes and implications of the retreat.2 Complementing existing case studies and surveys, this article analyses the drivers of the retreat and identifies three issues that warrant particular attention going forward.
First, some jurisdictions could face inadequate access to the global financial system. Connections with particular countries, such as those from which migrants send remittances, provide a critical source of income to households. Remittances drive financial inclusion by promoting the use of transaction accounts. We find that a complete loss of access is rare, and typically linked to weak governance or deficient controls on illicit financing. Most countries can still be reached through longer payment chains.
Second, costs for sending cross-border payments remain high in some countries, despite international efforts to reduce remittance costs. Greater concentration in correspondent banking could keep costs elevated. While there is little evidence of rising costs, we do find that costs are higher in countries with more limited access to correspondent banking services.
Key takeaways
- The number of correspondent banks fell by 20% between 2011 and 2018, even as the value of payments increased.
- Banks withdrew more from countries where governance and controls on illicit financing were poor, and less where economic growth and trade were robust.
- The retreat of correspondent banks might hurt financial inclusion, raise the cost of cross-border payments or drive them underground.
Statistical data: data behind all graphs
Third (and related), if banks are not providing critical payment services, users may resort to less regulated or unregulated channels. Shifting payments outside the banking system may undermine international financial integrity. Information-sharing initiatives between financial institutions, as well as between jurisdictions, offer opportunities for reducing cross-border frictions.
The following section reviews recent trends in correspondent banking. We then examine what is driving the retreat of correspondent banks and explore some potential consequences. The final section concludes.
Correspondent banking trends
Correspondent banking is an arrangement whereby one bank (correspondent) holds deposits owned by other banks (respondents) and provides those banks with payment and other services (CPMI (2016)). Correspondent banking networks are critical for firms and households that conduct business or send payments internationally. The arrangement requires that respondents open accounts in the correspondent's books and are able to exchange messages to settle obligations by crediting and debiting those accounts (Bech and Hancock (2020, in this issue)).
Further reading
Historically, banks have maintained broad networks of banking relationships across the globe. As far back as the 14th century, the Venetian Senate recognised that banks were essential to support international trade (Dunbar (1892)). In the late 1800s, with globalisation and innovation in communications, an international network of correspondent banks began to emerge (Panza and Merrett (2018)). During the second wave of globalisation in the late 20th century, the scale and complexity of this network grew substantially.
Over the past decade, however, correspondent banks have been retreating. Correspondents have become less willing to provide such services to new respondent banks and have been selectively exiting the business or reducing their number of respondents (CPMI (2016), FSB (2017), IMF (2017)).
To investigate these trends, we examine changes in SWIFT payment messages from 2011 to 2018. As Box A explains, the messaging data map out a network of interbank relationships, for which SWIFT provides certain statistics on the value of payments and the number of banks involved. A payment message from one country to another identifies a corridor. A cross-border payment message from one bank to another identifies a correspondent bank relationship; the count of active correspondents (ACs) measures, corridor by corridor, the number of banks that have sent/received messages.3
Box A
Correspondents and corridors through the lens of SWIFT and the BIS banking statistics
Most payment systems are domestic in scope and operate in a single currency. The global network of correspondent bank relationships provides the main linkages between those payment systems. Most cross-border payments flow through a correspondent banking network (CPMI (2018)), and the overwhelming majority use the SWIFT financial messaging service (CPMI (2016)). These facts combined suggest that SWIFT data capture the bulk of cross-border payments, and deliver an accurate picture of the trends in correspondent banking payments. Those payments includes remittances and trade finance, but also wholesale payments related to financial market activity.
SWIFT messaging data cover payments between more than 200 countries and jurisdictions, mapping out a network of bilateral relationships. These relationships can be defined at the bank-to-bank or country-to-country level. A payment message from one country to another identifies a corridor. A cross-border payment message from one bank to another identifies a correspondent bank relationship; the count of active correspondents (ACs) measures, corridor by corridor, the number of banks abroad that have received messages sent by banks in a given country.
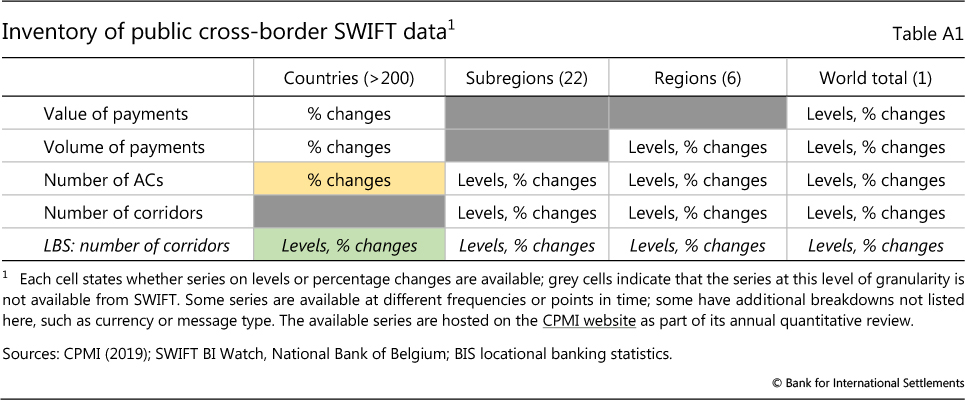
This article relies on data that SWIFT and its overseer, the National Bank of Belgium, have aggregated to the country or regional level. Our analysis is limited to the data received, as made available on the CPMI website. At the country level, only percentage changes are available, and they exclude data on corridors (Table A1). Information on levels, ie the number of ACs and corridors, is available only as (sub)regional averages. We examine the percentage change in the number of ACs from 2012 to 2018 by country (yellow cell). No SWIFT data on corridors are available at the country level. Since international access hinges on corridors from and to other countries, we estimate the number of corridors from the BIS locational banking statistics (LBS) instead (green cell).
Definitions of correspondent banking have in common that the correspondent holds deposits owned by respondent banks to provide payment and other services to those banks (CPMI (2016)). The bank in country A placing a deposit with a bank in B allows the bank in A to make a payment in country B. These accounts are part of the interbank positions captured in the BIS LBS, which include positions with unaffiliated banks as well as intragroup positions. The LBS cover positions of 47 BIS reporting countries (including major emerging market economies (EMEs) and offshore centres) with more than 200 countries and jurisdictions. Overlaying asset and liability data helps to enhance global coverage (Brei and von Peter (2018)). Even so, counts based on the LBS (Table A1, green cell) may understate the number of corridors for all but the 47 BIS reporting countries, since any positions between two non-reporting countries are unobserved.
Cross-border payment infrastructures include TARGET2, the euro area's interbank funds transfer system, as well as CLS and others featured in Bech, Faruqui and Shirakami (2020, this issue). Data relating to SWIFT messaging flows are published with permission of S.W.I.F.T. SC. SWIFT © 2020. All rights reserved. Because financial institutions have multiple means to exchange information about their financial transactions, SWIFT statistics on financial flows do not represent complete market or industry statistics. SWIFT disclaims all liability for any decisions based, in full or in part, on SWIFT statistics, and for their consequences. SWIFT data include retail and wholesale cross-border payments in all currencies; the message type distinguishes customer payments (MT103) from interbank payments (MT202) along the payment chain. (However, MT103 messages sent under the cover method may identify some pairs that do not have a correspondent bank relationship.)
The SWIFT data show that the number of ACs has declined by 20% since 2011 (Graph 1, left-hand panel). Virtually all countries and jurisdictions lost correspondents during that time. All regions have seen a drop, although to varying degrees: the rates of decline range from 12 to 30%, with Northern America at the low end and Latin America at the high end (centre panel).4 Latin America and Oceania experienced the largest decreases between 2011 and 2018.
SWIFT data also show that the number of corridors between countries fell by 10% over the same period. Between 2011 and 2018, the global number of corridors declined from 10,800 to 9,800, less than a quarter of the maximum number of country pairs that could in principle be connected through SWIFT payments. Here too, the decline was uneven across regions (Graph 1, dots in centre panel) and left some regions with fewer remaining corridors (right-hand panel). Unfortunately, SWIFT data on corridors are not available at the country level; only percentage changes of ACs, value and volume are (Box A). To explore implications for international access, we estimate the number of corridors from the BIS locational banking statistics (see below).
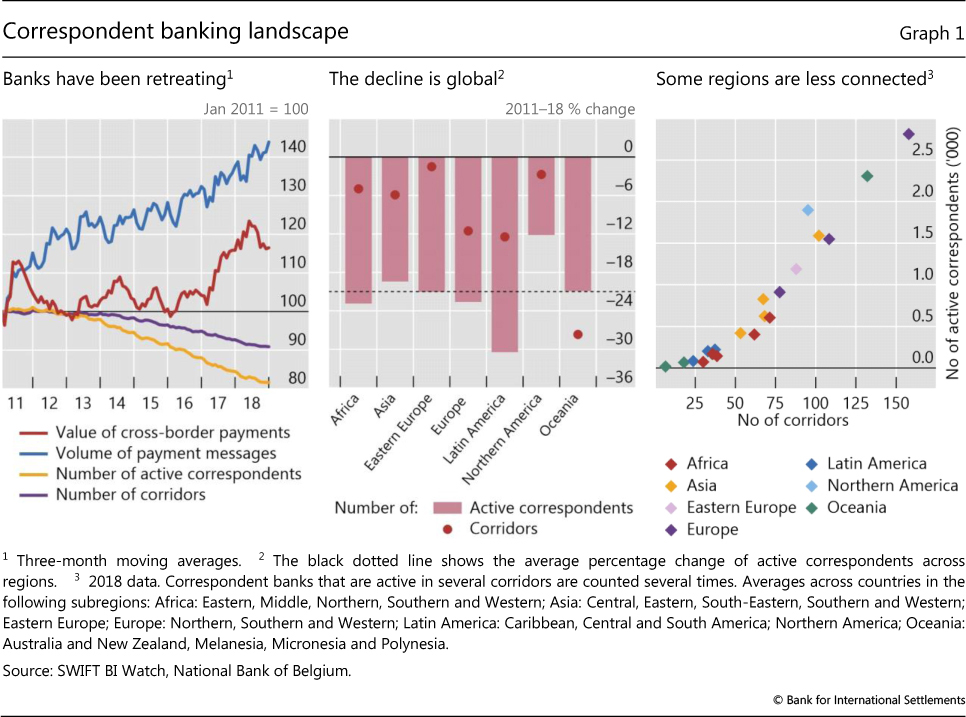
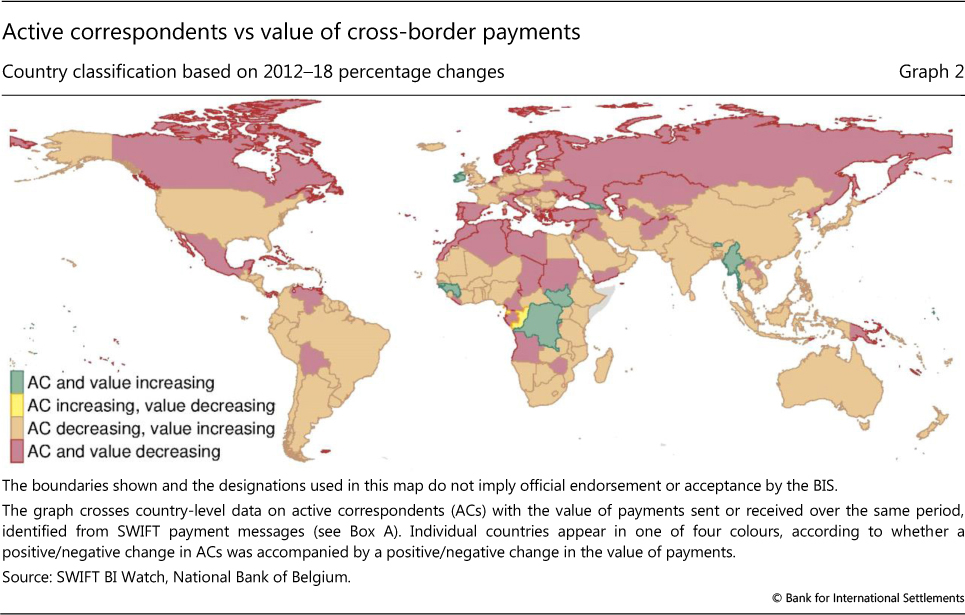
Even as the number of corridors and active correspondents declined, the global value and volume of payments continued to grow (Graph 1, left-hand panel). This divergence in the aggregate is widely shared (Graph 2): the countries shown in orange lost ACs, yet saw the value of cross-border payments increase between 2012 and 2018. Whether this increase reflects continued financial globalisation or a lengthening of payment chains is unclear in the absence of bilateral data. The map also identifies countries (in red) that experienced a decline in ACs and in the value of cross-border payments. Those countries either sent/received fewer payments altogether, or used other cross-border payment arrangements that are not reflected in SWIFT data.
What are the drivers of this retreat?
The broad-based changes in correspondent banking present a complex picture. An overarching theme is that in the aftermath of Great Financial Crisis, global banks have reassessed their business strategies against the backdrop of lower bank profitability, dampened risk appetite and tighter regulation and supervision.
One of the largest drivers appears to be banks' reconsideration of their business strategy. In a recent survey, about 40% of banks cited this as a reason for terminating relationships (FSB (2017)). About a third of banks reported that they exited relationships which were no longer profitable or cost-effective because of the required due diligence or other economic reasons (FSB (2017)). As a result, it is possible that smaller countries with less demand, trade or relative growth experienced a greater decline in relationships than larger and more dynamic markets.
Risk-related considerations ranked second among surveyed banks. As correspondent banks conduct business globally, they must comply with the relevant laws and regulations in all jurisdictions in which they operate. These include anti-money laundering and combating the financing of terrorism (AML/CFT) regulations, tax transparency codes and economic and trade sanctions. Jurisdictions have also cracked down on tax havens and offshore financial centres (Zucman (2015)). About 22% of correspondent banks terminated active relationships for reasons related to compliance and reputation (FSB (2017)).
In recent years, stringent enforcement of AML/CFT regulations, tax transparency requirements and economic and trade sanctions has resulted in high-profile actions and penalties across the banking industry (IMF (2017)). Authorities, particularly in the United States and European Union, have imposed fines for banks' misconduct and/or criminal behaviour (Carletti (2017)). As a result, banks and other financial institutions have had to step up their efforts to comply with the standards and regulations. Faced with higher regulatory expectations, banks may choose to scale up or stop providing correspondent services, concentrating the business in larger global transaction banks.
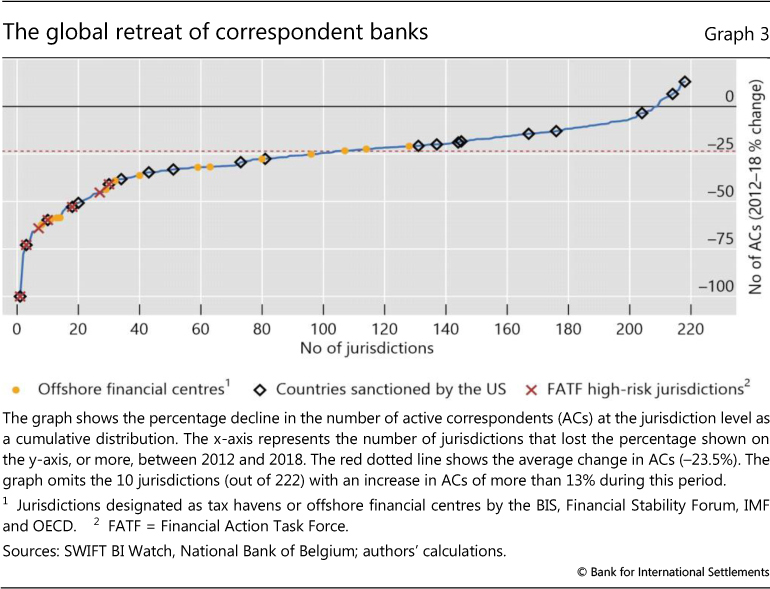
Jurisdictions which lack robust implementation and enforcement of international financial standards provide greater scope for actors to engage in illicit financing practices. Those designated in multiple areas (ie deficient AML/CFT compliance, sanctioned countries, tax havens/offshore centres) could be considered high-risk countries, and many have indeed lost large shares of active correspondents (Graph 3).
An additional set of drivers pertains to technological advances which could lead to more choices for making cross-border payments. Such developments have the potential to reduce the costs and increase the speed and transparency of payments. Some may complement correspondent banking, such as payment aggregators, which combine a large number of (generally small-value) payments and send them through the correspondent banking network, to be unbundled at the destination. Others may substitute for it in part, eg "netters", where only net imbalances need to be settled. While technological developments make it easier to send and receive payments digitally, they are unlikely to replace correspondent banking. Some netting models work only in corridors where flows balance over time.
Preliminary analysis
In our empirical section, we test the generality of these drivers. This simple, cross-sectional analysis provides insight into some of the drivers that could help explain which countries lost more relationships (Box B). Critically, ACs declined most in jurisdictions that stood out in terms of corruption and AML/CFT compliance. As banks reassessed their risks in such jurisdictions, those with a longer history of AML/CFT deficiencies lost 25 percentage points more ACs than the average. On the positive side, stronger macroeconomic performance and growth in trade helped maintain ACs. The demand for mobile phone services did as well.
Finally, the measured decline in ACs cannot be explained by purely mechanical factors. First, there has not been significant consolidation among global banks since 2012.5 And while emerging cross-border payment infrastructures could shorten the payment chain or curb the need for correspondent bank relationships, such systems are limited, and most handle small volumes and values (Bech, Faruqui and Shirakami (2020, in this issue)). Finally, banks could expand internal markets by opening branches and subsidiaries in more foreign countries, reducing their reliance on correspondent relationships. Bank-level data, however, do not suggest that banks are expanding their networks to the point that their internal markets are replacing ACs in a generalised way.
Box B
Explaining country variation in the loss of active correspondents
This box describes preliminary evidence on the extent to which measurable drivers help explain the loss of active correspondents (ACs) in a simple linear regression framework. We relate SWIFT data on percentage change in ACs from 2012 to 2018 (see Box A) to various explanatory variables in a large cross-section of countries. Table 1 tests three groups of drivers, starting with macroeconomic variables relevant for the demand side (users): countries experiencing low growth, crises or subdued trade face conditions that generally reduce banking services.
Moving on to the supply side (correspondent service providers), column 2 tests proxies for risks and activities that pose challenges to regulatory compliance for banks providing correspondent services. Countries subject to US sanctions, designated as high-risk for illicit financing or perceived to be corrupt may lose a greater share of ACs. Finally, column 3 examines how the use of digital technologies might affect the loss of ACs. In all columns, a negative estimate, if significant, indicates that the variable exacerbates the loss of ACs, itself a negative percentage.
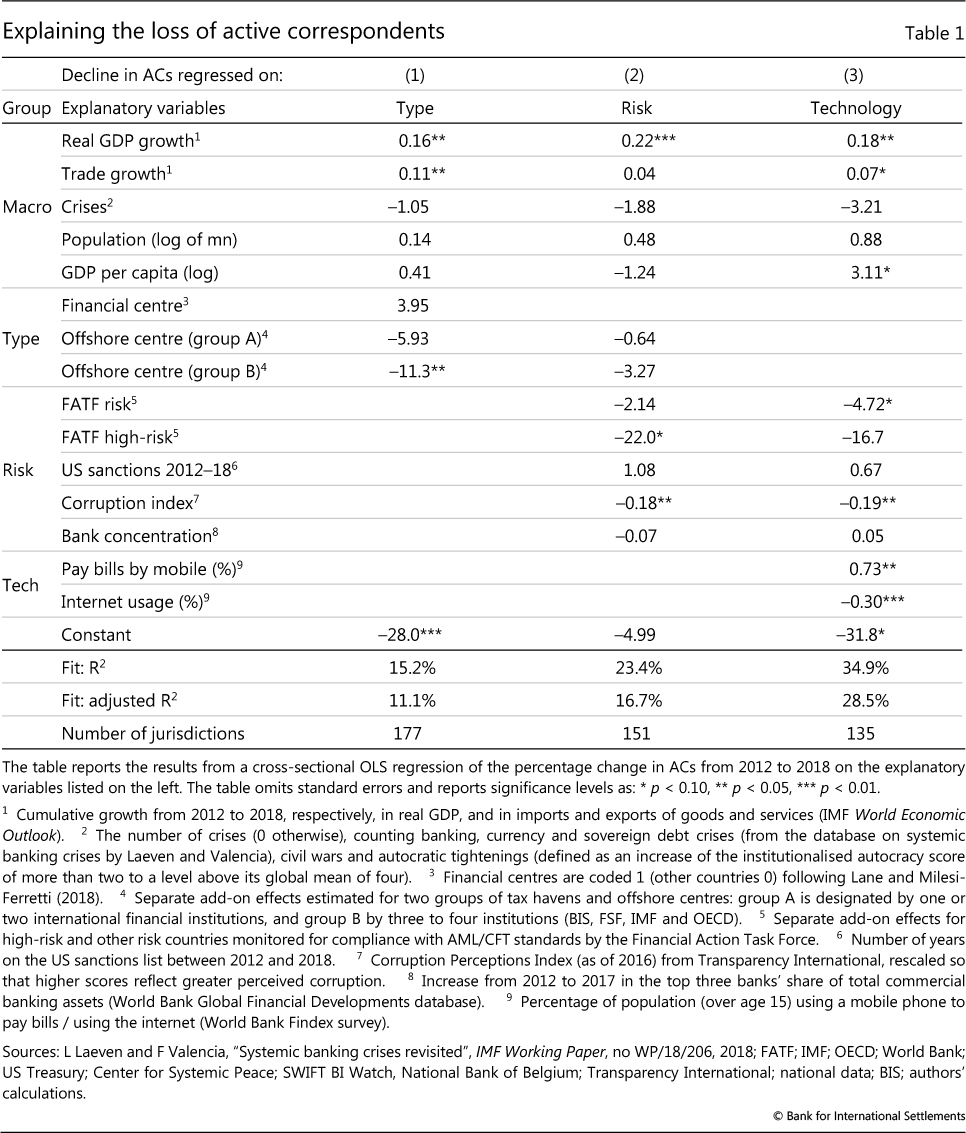
Looking across the columns suggests that the drivers identified in surveys and policy reports indeed help explain which countries lost more relationships. The negative constants reflect the generalised nature of the retreat. Stronger growth consistently stems the decline; conversely, shrinking economies lost more ACs. In addition, trade also tends to be supportive; indeed, facilitating trade always was a key purpose of correspondent banking. Next, countries in crisis tend to lose more ACs, though low growth rates and subdued trade already account for the effect, leaving "crises" insignificant. Testing five types of crises separately (not shown) reveals that banking crises reduce ACs the most (as do some sovereign debt crises).
Size controls matter little in most specifications. Richer countries or larger markets start with more ACs, but initial conditions hardly affect the rates of decline. Yet the retreat of correspondent banks is not indiscriminate. Jurisdictions widely designated as offshore centres lost 11 percentage points more ACs (even after controlling for population). It may be more difficult for correspondent banks to know their customers in offshore centres offering anonymity and secrecy. The Channel Islands and Bermuda, for example, lost more ACs than centres with fewer designations (eg Singapore or Ireland). Major international financial centres, including the United Kingdom, saw no such response.
More important than location, presumably, is the nature of the activities conducted in a jurisdiction. Column 2 tests variables posing challenges to regulatory compliance. Jurisdictions with deficient AML/CFT regimes lost far more ACs. Repeated designations by the FATF as being high-risk accelerated the loss of ACs by some 20 percentage points; shorter stints on the list of monitored countries has a weak effect if any. The number of years on the US sanctions list between 2012 and 2018 did not have the expected negative effect; some long-sanctioned countries gained ACs (eg Congo and South Sudan) while others (eg Syria, Yemen, North Korea) also happened to be FATF high-risk countries and saw negative growth.
The most robust risk-related driver is a corruption index. To capture perceived levels of public sector corruption, the composite index draws on 13 data sources capturing assessments of experts and business surveys. A higher perceived corruption score accelerates the decline of ACs, judging by the negative coefficient. The index explains more variation at the higher end (eg Eritrea, Sudan and Venezuela). Taken at face value, a 1-sigma (20-point) increase in the indicator results in 4% more ACs being lost.
Column 3 examines financial inclusion through digital technologies. Countries where more people use mobile phones to pay bills lost fewer ACs. The estimated coefficient suggests that an increase from the sample average to Kenya's 19% would cut the percentage of ACs lost from the sample average (-24%) in half (-12%). User demand for mobile technologies appears to complement banking services in this instance. By contrast, internet usage apparently went with greater loss of ACs, perhaps because it closely tracks a country's stage of development.
Finally, we find little evidence that mechanical factors explain the loss in active correspondents. The need for correspondent banks may be lower in Europe thanks to TARGET2; yet, a euro area dummy is insignificant (not shown). Another mechanical driver would be bank consolidation. Most mergers between major banks predate 2012; still, 70 countries in the sample experienced an increase in their top three bank concentration ratio since 2012. This variable explains 5% of variation in ACs in a bivariate context, but fails to register in the multivariate context when included in columns 2 and 3.
Overall, the findings suggest that the number of ACs declined most in jurisdictions that stood out in terms of corruption and AML/CFT compliance, while strong growth, trade and demand for mobile phone services help maintain banking relationships. The analysis is preliminary and limited by data availability, which precludes more systematic testing-down: large drops in sample size change the composition of countries. A separate caveat is that a linear approach may not capture threshold effects and regional dependencies when banks put countries in the same basket in their de-risking efforts.
In addition to growth in GDP and trade, the value of trade and remittances (log of shares to GDP, not shown) appear to have no robust effect on the loss of ACs. Offshore centre status loses its negative effect on ACs, because the added variables absorb some explanatory power and the sample loses several prominent offshore financial centres. The correlation of internet usage with log GDP per capita (also included in the regression) equals 89%, and the two variables largely offset each other in column 3.
Issues that warrant attention
The fact that many jurisdictions experienced a retreat remains a source of concern for the international community. Judging by the drivers reviewed so far, the global decline in the number of ACs results from a confluence of developments over the past decade. Part is natural, eg following banks' post-crisis reassessment of costs and benefits, or consolidation and tiering in global transaction banking. Part is also intended, a consequence of efforts to enhance international financial integrity. With this in mind, we consider three issues that warrant particular attention and further monitoring.
1. Loss of access
Did the retreat of ACs result in a critical reduction in access? A complete loss of access to cross-border payment services can entail hardship; in the extreme, migrants cannot send home remittances or firms do not receive payments for exports.6 Most countries experienced moderate retreats with less dramatic consequences. In eight EMEs surveyed by the World Bank, the macroeconomic impact was found to be limited; local banks and money transfer operators (MTOs) have been able to cope by maintaining fewer (if costlier) correspondent bank relationships (World Bank (2018a)). Evidence from Asia and the Pacific, however, illustrates the challenges facing small states, and the fragility of the remittance system (IMF (2017)).
We examine two questions related to international access. First, does the retreat of correspondents entail a loss of corridors? Second, does a loss of corridors threaten a country's access to the global financial system altogether? As country-level SWIFT data on corridors are unavailable, we identify corridors using the BIS locational banking statistics (LBS) knowing that correspondent arrangements rely on interbank deposits (Box A).7 Tracking the counts of interbank positions with other countries allows us to gauge which countries may have lost corridors and what corridors remain.
As banks cut respondents, we find that corridors tend to disappear as well - albeit at a lower rate. Graph 4 compares the percentage change of ACs (SWIFT) with that of corridors (LBS) from 2012 to 2018. Most countries are in the top left quadrant, suggesting that many correspondents can be lost without a commensurate loss of corridors.8 That said, many countries lost both ACs and corridors (bottom left). That would not happen if correspondent banks only consolidated their respondents within each jurisdiction. This includes some jurisdictions designated as tax havens or offshore centres or high-risk in terms of AML/CFT. The fitted line suggests that country corridors vanish at half the rate at which correspondent bank relations cease. Indeed, a 20% loss of ACs and a 10% loss in corridors matches the trend in the global aggregates (Graph 1).
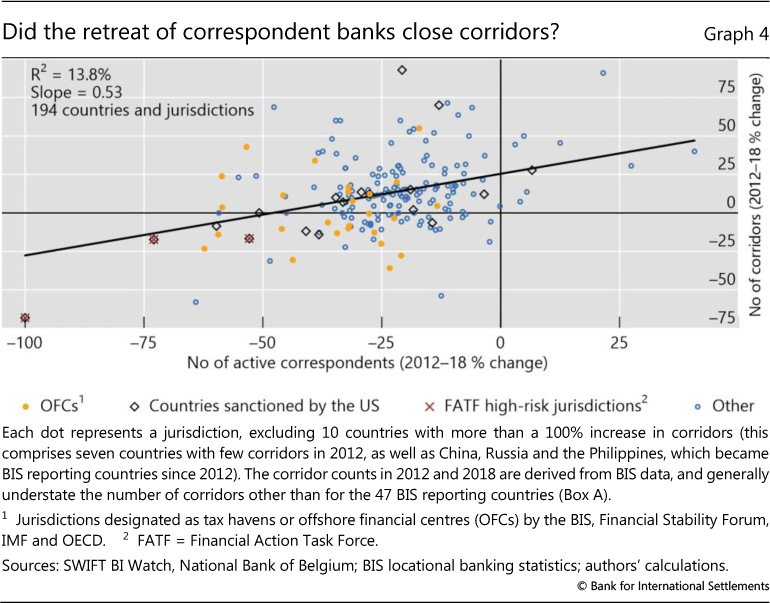
Does a loss of corridors threaten a country's access to the global financial system? A complete loss of access is rare, but the loss of corridors may lengthen payment chains as transfers are routed via third countries. The LBS interbank network shows that virtually all jurisdictions maintained corridors from and to banks in BIS reporting countries.9 The 214 countries and jurisdictions in the LBS give rise to nearly 46,000 country pairs. In at least 14% of cases, the sender country holds interbank deposits in the receiver country (as of 2018). Another 74% can route payments through a third country, and 6% via two connected intermediaries. Eight destinations cannot receive this way, and four Pacific islands also cannot send. These network metrics may not capture the practical difficulties in routing payments, but they underscore that longer payment chains may be the more relevant concern, at least if such intermediation raises the cost of cross-border payments.
2. Rising costs of cross-border payments
Costs for sending cross-border payments remain high, especially in some countries, despite international efforts to reduce such costs (World Bank (2015)). Accordingly, policymakers have set targets to significantly reduce remittance costs (World Bank (2019a,b)). Those costs have been declining slowly in recent years as financial inclusion has improved (Carstens (2019)).
Greater concentration, or fewer correspondent banks providing services, could keep such costs elevated. Most countries have seen falling remittance costs in spite of a loss of ACs (Graph 5, left-hand panel). Yet all instances of rising remittance costs are associated with lost ACs (top left quadrant). Remittance costs generally fall by less where more correspondents retreat. Additionally, regions associated with the fewest ACs, particularly in Africa, also face higher costs (Graph 5, centre panel).10 Absent robust competition and proper incentives, the costs may not continue to decline in line with international expectations.11
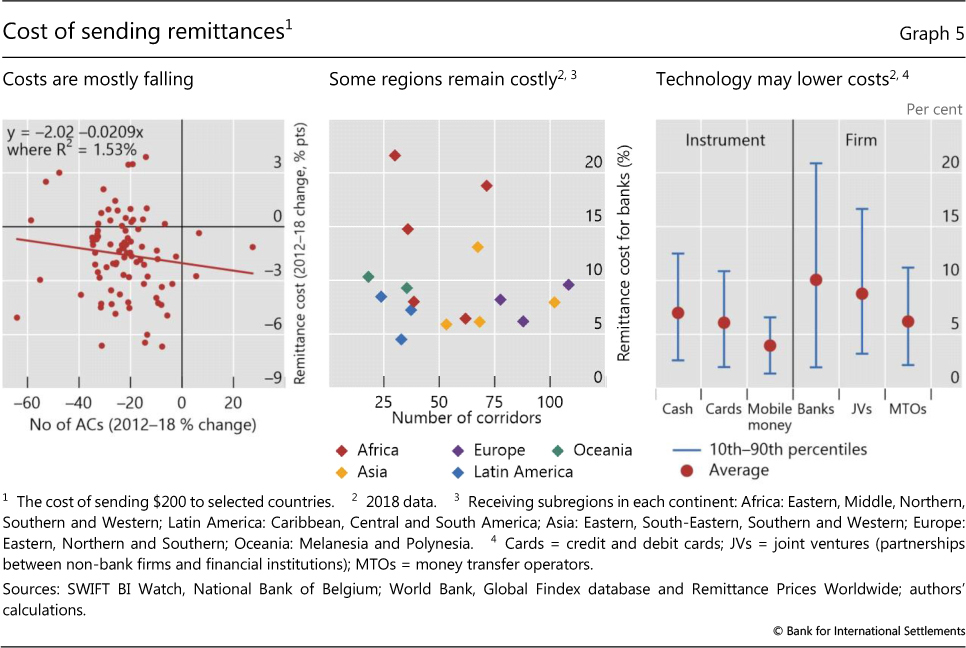
Technology could make cross-border payments more attractive. One emerging payment type, mobile money transfers (payments through a mobile phone), can be used for cross-border payments at a lower cost than cash or cards (Graph 5, right-hand panel). Non-bank players such as money transfer operators (MTOs) and joint ventures or partnerships between non-banks and other financial institutions provide remittance transfers at lower costs than banks (right-hand panel). Such competitive pressure helps lower costs more generally.12
3. International financial integrity
The continuing decline in the number of ACs around the world could adversely affect the integrity of the global financial system. If banks are not providing these critical cross-border financial services, users may resort to unregulated and potentially unsafe "shadow payments". For instance, in spite of losing ACs, most countries received greater remittance inflows in 2018 than in 2012 (Graph 6, left-hand panel, top left quadrant). Such countries could be making payments through less regulated non-bank channels. This includes informal networks for cash or unregulated cryptocurrency platforms for digital assets (Cœuré (2019a)). Such platforms lack proper cyber security, basic risk management, legal certainty or consumer protection (Cœuré (2019b)).
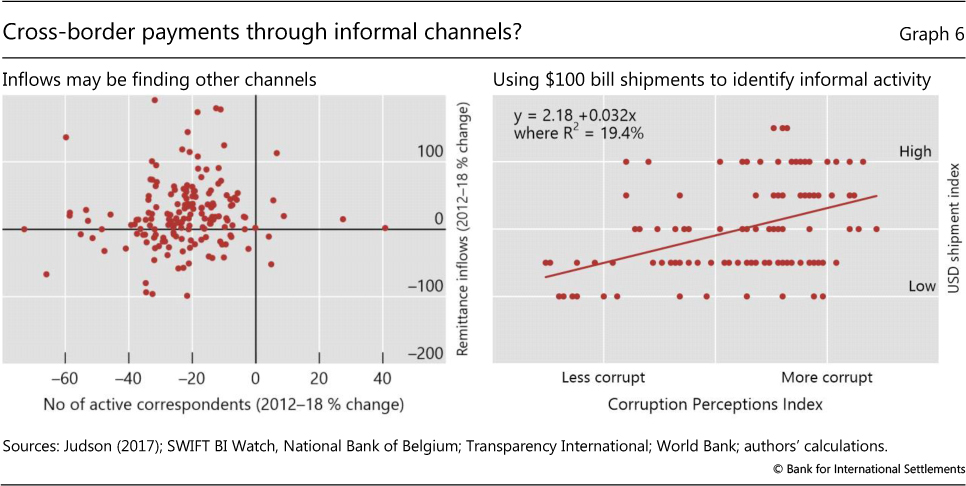
One way of identifying countries with large informal economies is through foreign holdings of cash, namely the US dollar, the dominant international currency. Nearly 80% of $100 bills (the most commonly held bill as a store of value) are held overseas, more than twice the amount in circulation abroad in 1980 (Haasl et al (2018), Judson (2017)). In fact, Judson (2012) finds that economic and political instability contribute to this demand. Indeed, shipments of $100 bills are greater to jurisdictions where the perceived corruption index is higher (Graph 6, right hand-hand panel).
Digital assets or cryptocurrencies provide other channels for cross-border payments. One recent study estimates that around $76 billion of illegal activities per year involve Bitcoin (Foley et al (2019)). Additionally, an industry group that follows crypto-exchange compliance with AML/CFT standards finds that roughly 97% of direct Bitcoin payments from identifiable criminal sources have been received by unregulated cryptocurrency exchanges (CipherTrace (2018)).
While much has been done to improve regulatory compliance at banks, other institutions - such as non-bank financial institutions and crypto-exchanges - should be held to equally high standards and regulations. There are initiatives under way to make such improvements. One set of efforts seeks to improve anti-money laundering standards for cryptoassets. To that end, the Financial Action Task Force (FATF) has developed standards and guidance to enhance AML/CFT standards for crypto-exchanges and cryptoasset service providers to align them more closely with bank regulations (FATF (2019)).
Another set of initiatives seeks to improve information-sharing. For example, a number of jurisdictions have developed, or are working to develop, robust know-your-customer (KYC) utilities.13 For example, India has developed a digital identify platform and electronic KYC utility that has greatly improved KYC processes (D'Silva et al (2019)). It enables paper-free KYC processes, reducing the costs of adding new customers while complying with regulations. Building on jurisdiction-level experiences, organisations are working to reduce cross-border frictions by establishing regional KYC utilities. One such example is the pan-African platform Mansa, launched in July 2018 (Afreximbank (2018)). The private sector plays a key role in improving compliance and reducing related costs. One recent initiative is the IIN, a peer-to-peer KYC information-sharing network of more than 400 banks built on distributed ledger technology (JPMorgan (2019)).
Looking ahead
For centuries, banks have been building networks of banking relationships across the globe. But over the past decade, correspondent banks have retreated, in part due to the need to improve profitability and maintain high standards of financial integrity. As banks pare back respondent relationships, country-to-country corridors tend to disappear as well. Countries with limited access to correspondent banking services see the costs of cross-border payments rise.
Where banks are retreating, users may resort to less regulated or unregulated channels. Shifting payments outside the banking system may undermine international financial integrity. While much has been done to strengthen international standards for banks, other institutions should be held to equally high standards.
Further monitoring and action are necessary to ensure that household and businesses in all countries enjoy access to safe, low-cost cross-border payment channels. Monitoring corridors more closely would help assess which jurisdictions risk losing access, impeding financial inclusion and growth. Corridors that have become prohibitively expensive may not be accurately reflected in survey data on costs, and warrant enhanced monitoring. That said, indirect payments routed through countries with global transaction banks may also bring efficiency gains.
Looking ahead, a key element is to overcome frictions inherent in cross-border payments. To this end, a number of promising private and public sector information-sharing initiatives are under way. Continued progress should provide welcome improvement to cross-border payments.
References
Afreximbank (2018): "Afreximbank launches Mansa, Africa's due diligence data platform", 13 July.
Bech, M, U Faruqui and T Shirakami (2020): "Payments without borders", BIS Quarterly Review, March, pp 53-65.
Bech, M and J Hancock (2020): "Innovations in payments", BIS Quarterly Review, March, pp 21-36.
Brei, M and G von Peter (2018): "The distance effect in banking and trade", Journal of International Money and Finance, vol 81.
Carletti, E (2017): "Fines for misconduct in the banking sector - what is the situation in the EU?", analysis provided to the European Parliament, 23 March.
Carstens, A (2019): "The future of money and the payment system: what role for central banks?", remarks at Princeton University, 5 December.
CipherTrace Cryptocurrency Intelligence (2018): "Cryptocurrency anti-money laundering report", September.
Cœuré, B (2019a): "Fintech for the people", keynote speech at the 14th BCBS-FSI high-level meeting for Africa on strengthening financial sector supervision and current regulatory priorities, Cape Town, 31 January.
--- (2019b): "Payments for the people", remarks at the high-level meeting on financial inclusion, Basel, 27 May.
Committee on Payments and Market Infrastructures (2016): Correspondent banking, July.
--- (2018): Cross-border retail payments, February.
--- (2019): CPMI quantitative review of correspondent banking data, April.
D'Silva, D, Z Filkova, F Packer and S Tiwari (2019): "The design of digital financial infrastructure: lessons from India", BIS Papers, no 106, 15 December.
Dunbar, C (1892): "The bank of Venice", Quarterly Journal of Economics, vol 6, no 3, pp 308-35.
Financial Action Task Force (2019): Guidance for a risk-based approach to virtual assets and virtual asset service providers.
Financial Stability Board (2015): Report to the G20 on actions taken to assess and address the decline in correspondent banking.
--- (2017): Correspondent banking data report.
--- (2019): FSB action plan to assess and address the decline in correspondent banking: progress report.
Foley, S, J Karlsen and T Putnins (2019): "Sex, drugs, and Bitcoin: how much illegal activity is financed through cryptocurrencies?", Review of Financial Studies, vol 32, no 5, pp 1798-853.
Haasl, T, S Schulhofer-Wohl and A Paulson (2018): "Understanding the demand for currency at home and abroad", Chicago Fed Letter, no 396.
International Finance Corporation (2018): How a know-your-customer utility could increase access to financial services in emerging markets.
International Monetary Fund (2017): "Recent trends in correspondent banking relationships - further considerations", Policy Papers.
JPMorgan (2019): "Largest number of banks to join live application of blockchain technology", press release, 14 November.
Judson, R (2012): "Crisis and calm: demand for U.S. currency at home and abroad from the fall of the Berlin Wall to 2011", International Finance Discussion Papers, Board of Governors of the Federal Reserve System, vol 1058.
--- (2017): "The death of cash? Not so fast: demand for US currency at home and abroad, 1990-2016", proceedings of the Deutsche Bundesbank International Cash Conference 2017, "War on cash: is there a future for cash?".
Lane, P and G M Milesi-Ferretti (2018): "The external wealth of nations revisited: international financial integration in the aftermath of the global financial crisis", IMF Economic Review, vol 66, no 1, pp 189-222.
Panza, L and D Merrett (2018): "Hidden in plain sight: Correspondent banking in the 1930s", Business History, vol 61, no 8, pp 1300-25.
Scott, P, A-M Schryer-Roy, B Murphy and E Pomfret (2015): "Hanging by a thread: the ongoing threat to Somalia's remittance lifeline", Joint Agency Briefing Note, February.
World Bank (2015): Remittance prices worldwide: making markets more transparent.
--- (2018a): The decline in access to correspondent banking services in emerging markets: trends, impacts and solutions.
--- (2018b): The Global Findex Database 2017: measuring financial inclusion and the fintech revolution.
--- (2019a): Remittance Prices Worldwide 32.
--- (2019b): "Migration and remittances: recent developments and outlook", April.
Zucman, G (2015): The hidden wealth of nations, University of Chicago Press.
1 We thank Claudio Borio, Stijn Claessens, Henry Holden, Marc Hollanders, Ruth Judson, Benoît Mojon, Jan Paulik, Stephane Mahieu, Swapan-Kumar Pradhan, Catherine Schenk, Rupert Thorne and Philip Wooldridge for helpful comments and suggestions. We are grateful to Adam Čáp and Luis López Vivas for excellent research assistance. We also thank Nikolai Boeckx and Tim Stevens (National Bank of Belgium) and Astrid Thorsen (SWIFT) for their calculations and assistance on SWIFT data. The views expressed are those of the authors and do not necessarily reflect those of the Bank for International Settlements.
2 See CPMI (2016, 2018), FSB (2015, 2017, 2019), IMF (2017) and World Bank (2018a).
3 To illustrate, suppose banks in country A send payment messages to three different banks in the United States. For this corridor (A to US), country A has three active correspondents in the United States that will settle those payments. Country A's total number of ACs is the sum of these correspondent counts across all of A's corridors to other countries.
4 The regions and subregions used in this article are those defined by the United Nations Statistical Division.
5 Most mergers between major banks predate 2012. There has also been limited evidence that local consolidation across countries would have substantially reduced the number of relationships.
6 A case in point is Somalia, a country dependent on remittances to the tune of more than 25% of GDP (Scott et al (2015)).
7 Interbank deposits capture the ability to make cross-border payments, rather than the actual value of payments. As they comprise interbank and intragroup positions, the corridors inferred from LBS data reflect correspondent bank arrangements as well as banks' internal markets.
8 The new corridors partly reflect the expanding reporting BIS population (China and Russia started to report in 2015, the Philippines in 2016). However, these changes do not explain (but mitigate) the loss of corridors observed on the lower half of the scatter.
9 Table A6.1 of the BIS locational banking statistics report loans and deposits vis-à-vis banks in the 47 BIS reporting countries for more than 200 countries and jurisdictions.
10 Higher remittance costs are also observed for countries with fewer corridors, countries whose own banks have few (or no) international branches and subsidiaries and country pairs that are not directly linked through the LBS interbank network.
11 The United Nations 2030 Agenda includes as a sustainable development goal that of reducing remittance costs to less than 3% on average and 5% maximum through any given corridor. The World Bank monitors progress on this goal through its Remittance Prices Worldwide.
12 We examine average remittance prices at banks, MTOs and other providers across corridors. We find that bank remittance costs decline slightly when banks are presented with more diverse (non-bank) competition.
13 KYC is used to identify and verify potential customers, as well as monitor their behaviour. A KYC utility is a multilateral effort to centralise collection, verification, storage and sharing of clients' data and documents to comply with KYC procedures. See eg IFC (2018).