Highlights of the BIS international statistics
The BIS, in cooperation with central banks and monetary authorities worldwide, compiles and disseminates data on activity in international financial markets. This chapter summarises the latest data for the international banking and over-the-counter derivatives markets, available up to end-2015. A box looks at the international business of banks in China, and another at global residential property price developments in 2015.1
Takeaways
- The slowdown in international banking activity that began in early 2015 broadened in the final quarter of the year. The $651 billion contraction in cross-border bank lending affected most major currencies, sectors and regions.
- A $276 billion drop in cross-border claims on euro area countries accounted for the largest share of the $361 billion fall in lending to advanced economies.
- Cross-border bank credit to emerging market economies (EMEs) was down by $159 billion during Q4 2015, or 8% in the year to end-December 2015 - the sharpest year-on-year contraction since 2009.
- The $114 billion decline in cross-border lending to China was the second quarterly drop in a row, and it pushed the annual growth rate down to -25%.
- New data published by China confirm that banks on the mainland are becoming an increasingly important source of international bank credit. They are an especially important source of US dollar credit: their cross-border dollar assets totalled $529 billion at end-December 2015.
- Global over-the-counter derivatives markets saw a broad-based decline in activity in the second half of 2015, largely thanks to ongoing trade compression. The notional amount of outstanding contracts fell by 11%. Gross market values decreased by 6%.
- Residential property prices increased significantly in many of the large advanced and emerging economies in 2015, but fell sharply in Brazil and Russia.
Recent developments in the international banking market
The fourth quarter of 2015 saw another sizeable contraction in international banking activity. Between end-September and end-December 2015, the cross-border claims of BIS reporting banks dropped by $651 billion after adjustment for exchange rate movements and methodological breaks (Graph 1, top panels).2 It was the third consecutive quarterly drop, which reduced the outstanding stock to $26.4 trillion. The annual growth rate in the year to end-December 2015 sank to -3%, far below the average of 6% seen over the past 20 years. The weakening in international banking activity during Q4 2015 coincided with a relatively tranquil period in global financial markets, during which markets stabilised following a bout of volatility in the third quarter. However, a deterioration in global growth prospects, particularly in EMEs, started to feed into renewed market turbulence at the turn of the year.3
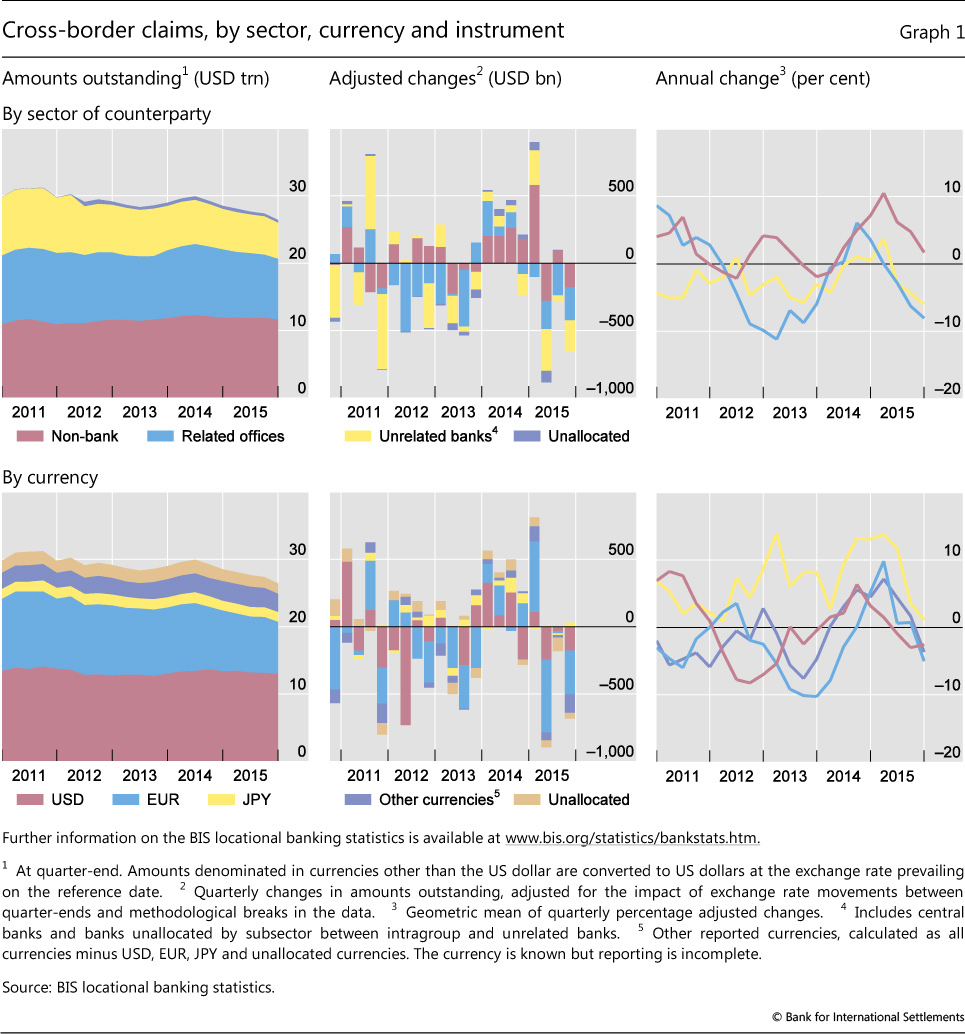
The decline in cross-border lending4 was more evenly spread across sectors, major currencies and regions in Q4 2015 than in previous quarters.
As regards sectors, interbank activity again accounted for the largest share and mainly drove the overall decline. But claims on non-bank borrowers, which had previously held up better, also fell substantially (by $177 billion): their annual growth rate slowed to 2% at end-December 2015, down from a peak of 11% at end-March 2015.
As regards currencies, cross-border claims denominated in euros fell the most ($325 billion), followed by those in US dollars ($175 billion). By contrast, cross-border claims denominated in Japanese yen rose slightly, by $32 billion during the last three months of 2015 (Graph 1, bottom panels), reflecting an increase in Japanese banks' cross-border lending.
Across borrowing regions, the decline in international banking activity affected advanced economies (-$361 billion), EMEs (-$159 billion) and offshore centres alike (-$120 billion). Activity channelled via offshore centres continued its steady post-financial crisis decline. Deposits placed with banks there, including intragroup transactions and interbank deposits, totalled $3.2 trillion at end-December 2015, down by 8% compared with a year earlier.
Claims on advanced economies declined
Cross-border claims on the euro area, the United States and other advanced economies shrank by $361 billion during Q4 2015. This contraction took their outstanding amount to $19 trillion and the annual growth rate to -2.9% (Graph 2, top panels).
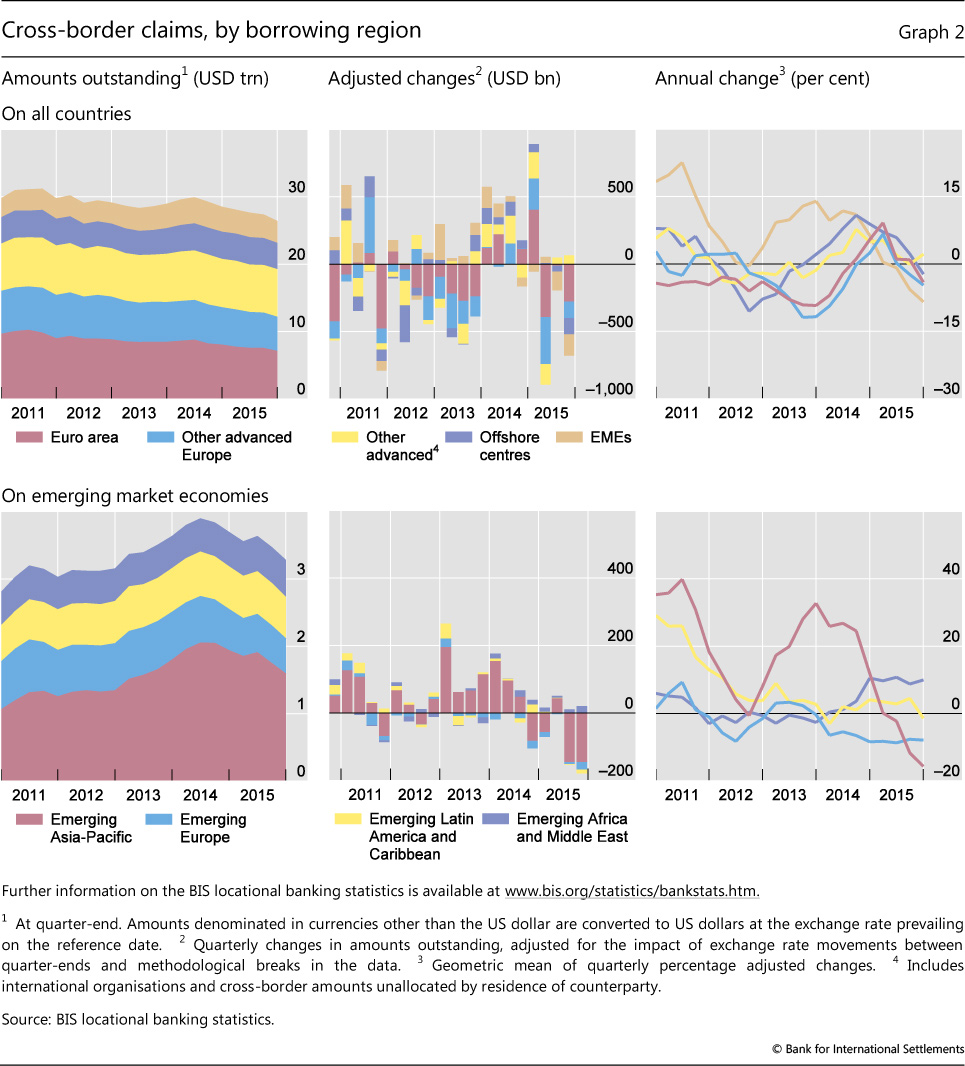
The contraction between end-September and end-December 2015 was driven primarily by a $276 billion drop in cross-border claims on euro area countries, which brought its stock to $7.1 trillion and corresponded to a 3% decline in the year to end-December 2015. Cross-border claims on France declined by $75 billion (Graph 3, top panels) and those on Germany and Ireland by $52 billion each. Claims on the Netherlands and Spain also fell (by $37 billion and $27 billion, respectively), while those on Greece, Italy and Portugal remained relatively stable.
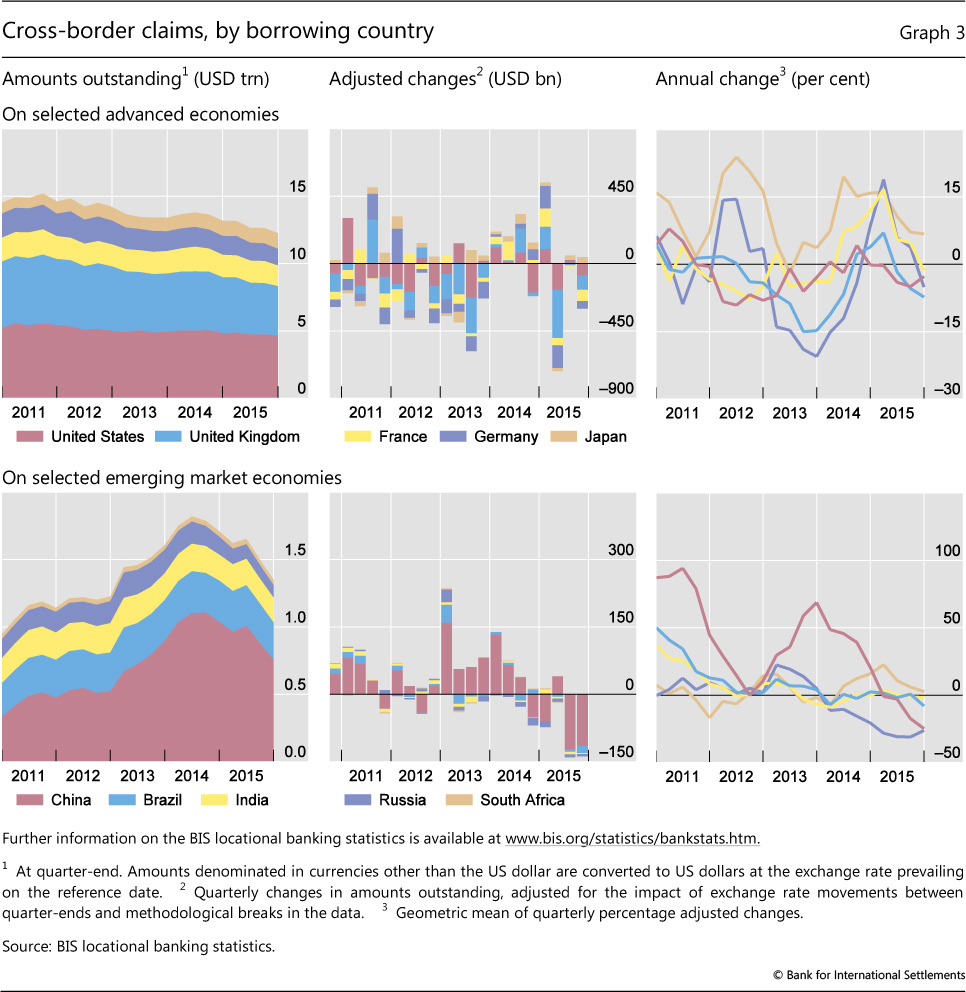
Among other advanced economies, cross-border lending to the United Kingdom and the United States shrank the most (by $98 billion to $3.7 trillion and by $76 billion to $4.6 trillion, respectively). In both cases, the interbank market led the overall decline. Japan was a notable exception. During the last quarter of 2015, cross-border claims on the country grew by $43 billion, or 7% year on year, to $1.2 trillion outstanding at end-2015.
Cross-border bank credit to EMEs continues to contract
The fall in cross-border lending to EMEs, which had started in the last quarter of 2014, accelerated during Q4 2015: claims contracted by $159 billion, taking the stock to $3.3 trillion and its annual growth rate to -8% (Graph 2). The aggregate decline was fuelled primarily by falling claims on emerging Asia, and China in particular.
The decline in international claims5 on China was broadly shared across sectors, maturities and creditor countries. Cross-border lending to mainland residents dropped by $114 billion during Q4 2015, or 25% year on year (Graph 3, bottom panels). The outstanding amount, totalling $756 billion at end-December 2015, has declined by a cumulative $304 billion, or 27%, from the all-time high reached at end-September 2014.
On a consolidated, immediate borrower basis,6 foreign claims on Chinese residents, including local claims booked by foreign banks' offices in China, contracted during the last quarter of 2015 from $1.1 trillion to $996 billion. This was 23% down from their $1.3 trillion peak in Q3 2014. As of end-2015, two thirds of these foreign claims were booked by banks headquartered in BIS reporting countries (Graph 4, left-hand panel). Banks headquartered outside BIS reporting countries, but with offices located in BIS reporting countries - for instance, Chinese banks located in Hong Kong SAR - accounted for the remainder.7 Claims of these so-called "outside area banks" fell from $512 billion at end-September 2014 to $341 billion at end-December 2015. However, unlike the claims of banks headquartered in BIS reporting countries, those of outside area banks are reported on an unconsolidated basis and thus include intragroup positions.
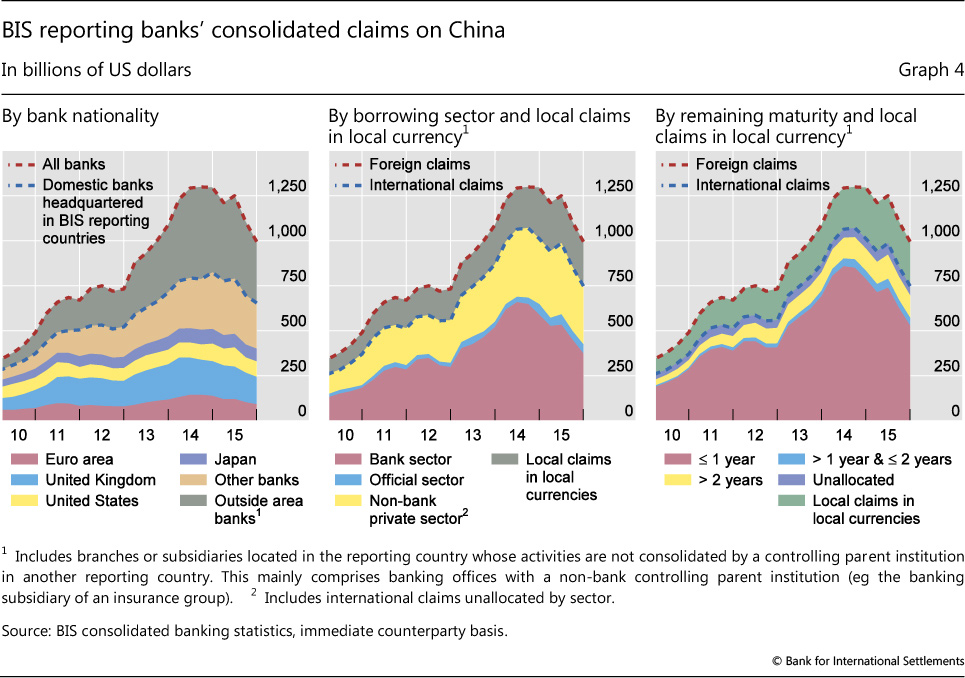
International claims on banks accounted for the majority of the contraction in foreign lending to China that took place since Q3 2014. The outstanding stock of international claims on banks in China has decreased, from $648 billion at end-September 2014 to $374 billion at end-December 2015. The latter category includes the intragroup positions of Chinese banking units located in BIS reporting countries (eg Hong Kong SAR) vis-à-vis their parent offices on the mainland. As a consequence, a substantial part of the above decline may be a direct consequence of the concurrent declines in offshore deposit liabilities reported by Chinese banks in Hong Kong SAR.8
Box A
International business of banks in China
Hong Hu and Philip Wooldridge
As part of China's commitments as a member of the Committee on the Global Financial System and the G20, the State Administration of Foreign Exchange (SAFE) has been working with the BIS to compile data on the international business of banks in China for reporting the locational banking statistics (LBS). In March 2016 SAFE started to publish some of these data. Once the full details are available, these data will be included in the LBS published by the BIS. The future inclusion of China in the LBS-reporting population will result in a 3% increase in reporting banks' aggregate cross-border assets and a 4% increase in cross-border liabilities.
The data published by SAFE capture the positions of all commercial and investment banks in China, including the government-owned policy banks (eg China Development Bank and Export-Import Bank of China) and the mainland affiliates of foreign-controlled banks. The central bank's assets and liabilities are excluded.
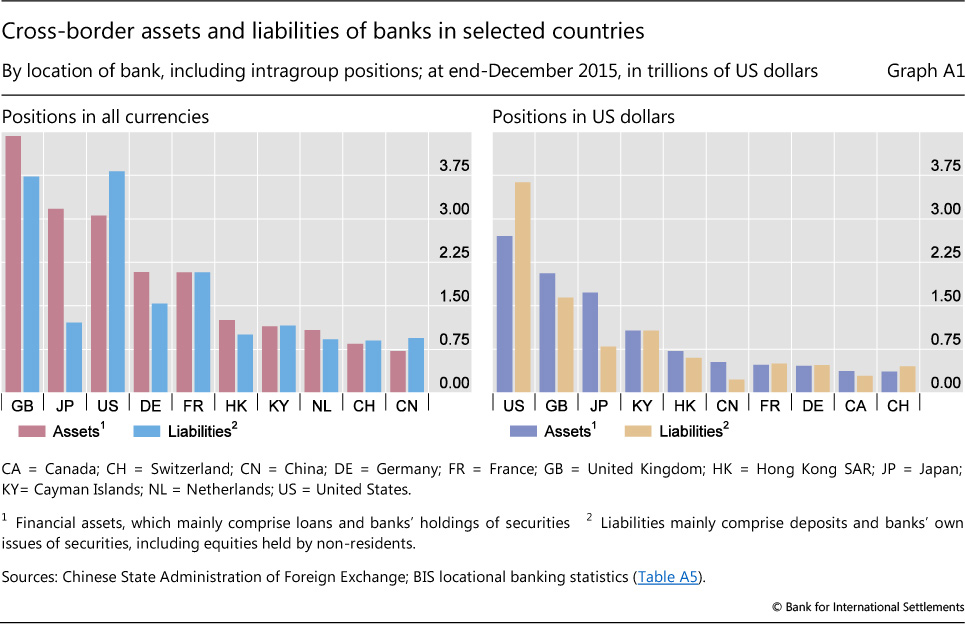
China's data confirm that banks on the mainland are becoming an increasingly important source of international bank credit. At end-December 2015, they were the tenth largest creditors in the international banking system, with cross-border assets of $722 billion (Graph A1, left-hand panel). They are an especially important source of US dollar credit: their cross-border dollar assets totalled $529 billion, larger than those of banks in all but five countries (Graph A1, right-hand panel).
Unlike in the other large countries that are creditors in the international financial system, such as Germany and Japan, the banking sector in China is a net debtor in the international market. At end-2015, the cross-border liabilities of banks on the mainland amounted to $944 billion, which was $222 billion more than their cross-border assets. This net debtor position is partly explained by the offshore listings of several of the largest Chinese banks. About one third of their cross-border liabilities, or $320 billion, comprised instruments other than loans, deposits and debt securities. These other instruments mostly represented the market value of Chinese banks' equities traded in Hong Kong SAR and on other exchanges.
Another explanation for the relatively large size of Chinese banks' liabilities is the channelling of offshore renminbi deposits to the mainland - for example, renminbi deposits placed with banks in Hong Kong SAR, which are in turn deposited with banks on the mainland. At end-2015, mainland banks reported that their renminbi-denominated liabilities to non-residents totalled $436 billion, whereas their renminbi-denominated claims on non-residents were only $58 billion. A decline in such liabilities accounted for a sizeable portion of the total capital outflows from China in 2015, as firms and households outside the mainland reduced their demand for renminbi deposits in response to waning incentives for holding long-renminbi, short-US dollar positions.
Turning to their US dollar positions, banks in China were large net creditors: at end-2015, their cross-border US dollar assets exceeded their dollar liabilities by almost $300 billion (Graph A1, right-hand panel). At the time, only banks in Japan and the United Kingdom were larger net dollar creditors. Banks in China appeared to fund their cross-border dollar assets in part with dollars raised on the mainland from firms and households.
The new data help to shed light on potential channels of contagion from economic and financial developments in China. The consolidated banking statistics (CBS) and LBS have long been a useful source of information for monitoring the credit extended by foreign banks to borrowers in China. Foreign banks' exposure to China has increased rapidly since the late 2000s, to $694 billion at end-2015 on a consolidated ultimate risk basis (see pp 5-6). The new data from China will make it easier to monitor the dependence of borrowers abroad on credit from China. As the Great Financial Crisis of 2007-09 demonstrated, it is as important to monitor potential shocks emanating from creditors as those from borrowers. Furthermore, the existing international banking statistics underestimate the overall increase in the indebtedness of those countries relatively more reliant on credit from China.
In 2009, the International Monetary Fund and the Financial Stability Board launched an international initiative to improve the availability of key information for policymakers to assess risks across countries. This Data Gaps Initiative is endorsed by the G20 and overseen by the Inter-Agency Group of international organisations, of which the BIS is a member. See R McCauley and C Shu, "Dollars and renminbi flowed out of China", BIS Quarterly Review, March 2016, pp 26-7, www.bis.org/publ/qtrpdf/r_qt1603u.htm.
International claims on China fell across all maturities (Graph 4, right-hand panel). However, there were signs of a gradual shift towards longer horizons: short-term claims on China with remaining maturities of up to one year constituted a share of 71% as of end-December 2015, compared with 81% in Q1 2014. (See Box A for a discussion of newly published data on the international business of banks in China.)
Cross-border bank credit to emerging Asia excluding China fell by $31 billion during Q4 2015, with all major economies in the region sharing in the decline. A $26 billion drop in cross-border lending to banks accounted for most of the fall. Cross-border lending to Chinese Taipei saw the second largest quarterly contraction on record, again led by a fall in interbank activity. The $17 billion contraction reduced the outstanding total to $105 billion (representing a 23% year-on-year decline at end-December 2015). Cross-border claims on Korea shrank by $6 billion, down 5% from a year earlier, and those on Malaysia fell by $4 billion, or 15% year on year, while India saw a decline of $2 billion, or 2% in the year to end-December 2015.
Cross-border lending to emerging Latin America and the Caribbean contracted by $12 billion during Q4 2015 (Graph 2, bottom panels), driven by a sharp fall in interbank lending to Brazil. Indeed, cross-border credit to the regional economies except for Brazil grew by $4 billion. Cross-border claims on Brazil, which accounted for almost half of the total for Latin America, fell for the third straight quarter. The $16 billion drop in Q4 2015 pushed down the annual growth rate to -8% and reduced the outstanding amount to $277 billion. More than 85% of the most recent drop resulted from a contraction in interbank lending.
Cross-border bank credit to emerging Europe contracted by $22 billion. Cross-border lending to Poland shrank the most (by $7 billion), again mainly driven by a contraction of interbank activity. Borrowers in Russia experienced the second largest drop (by $6 billion) in the region. Year on year, the stock of cross-border lending to Russia contracted by 26%, although the size of the quarterly declines shrank in the course of the year.
In contrast to other regions, cross-border claims on emerging Africa and Middle East expanded during Q4 2015. For 2015 as a whole, cross-border lending to this region grew by 10%.
Deposits of oil exporters fell along with the oil price
The decline in oil prices during Q4 2015 coincided with a significant fall in cross-border deposits placed with BIS reporting banks by residents of oil-exporting countries (Graph 5). Aggregate cross-border deposits held by residents of oil-exporting countries9 fell by $79 billion during Q4 2015. Deposits denominated in US dollars accounted for about two thirds of this decline.
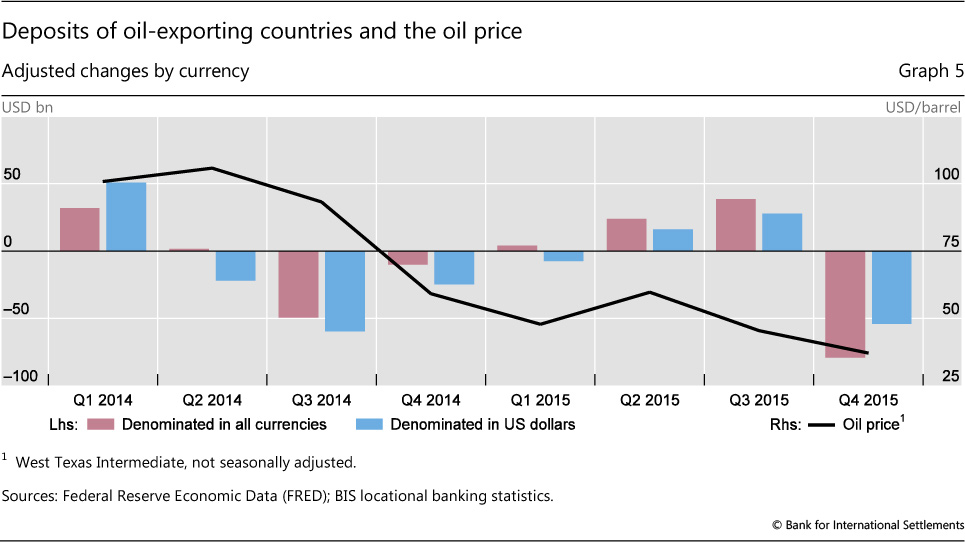
The quarterly contraction was concentrated among some oil-exporting countries. Depositors from Russia (-$27 billion) and Norway (-$26 billion) withdrew the highest absolute amounts. Internationally active banks also reported considerable declines in cross-border deposits held by residents of Saudi Arabia (- $17 billion), the United Arab Emirates (-$7 billion) and Mexico (-$7 billion).
Even after their latest quarterly decline, the cross-border deposits of oil-exporting countries were quite sizeable. Their outstanding stock stood at $996 billion as of end-2015. More than half of that amount was accounted for by the residents of four countries: Saudi Arabia ($214 billion), the United Arab Emirates ($129 billion), Russia ($109 billion) and Mexico ($107 billion).
The latest quarterly decline in deposits from oil-exporting countries actually understates the size of net cross-border flows to their residents during Q4 2015. BIS reporting banks' cross-border loans to oil exporters rose by $15 billion. As a consequence, net cross-border bank flows to oil-exporting countries totalled $94 billion during the same quarter. The recipients of the largest net cross-border flows were Norway ($27 billion), Russia ($22 billion) and the United Arab Emirates ($21 billion).
Recent developments in OTC derivatives markets
The over-the-counter (OTC) derivatives market continued to contract in the second half of 2015. In dollar terms, the notional amount of outstanding OTC derivatives contracts, which determines contractual payments and is one indicator of the total stock of positions taken by market participants, fell by 11% between end-June 2015 and end-December 2015, from $552 trillion to $493 trillion (Graph 6, left-hand panel). Even after adjustment for exchange rate movements, notional amounts at end-December 2015 were still about 9% lower than at end-June 2015.10
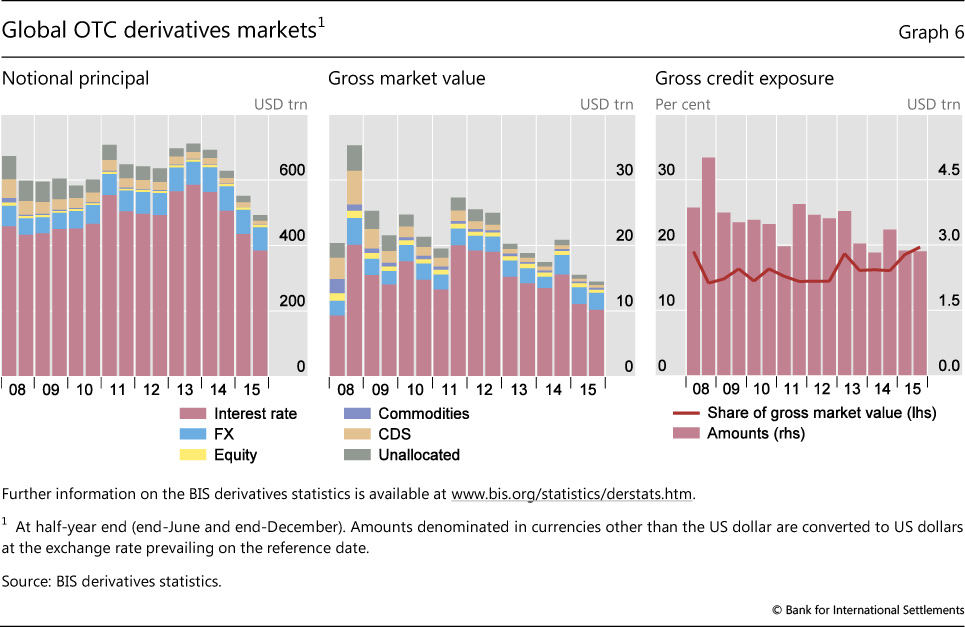
The gross market value of outstanding derivatives contracts - that is, the cost of replacing all outstanding contracts at market prices prevailing on the reporting date - also fell in the second half of 2015.11 It decreased by 6% from $15.5 trillion at end-June 2015 to $14.5 trillion at end-December 2015, its lowest level since 2007 (Graph 6, centre panel). Gross credit exposures remained at $2.9 trillion at end-December 2015, roughly the same level as in June 2015 (Graph 6, right-hand panel). This measure of counterparty credit risk represented 20% of gross market values at end-December 2015, a share that is slightly above the average observed since 2008 (16%).
Interest rate derivatives
The interest rate segment accounts for the majority of OTC derivatives activity. At end-December 2015, the notional amount of outstanding interest rate derivatives contracts totalled $384 trillion, which represented 78% of the global OTC derivatives market. At $289 trillion, swaps accounted for by far the largest share of this market segment.
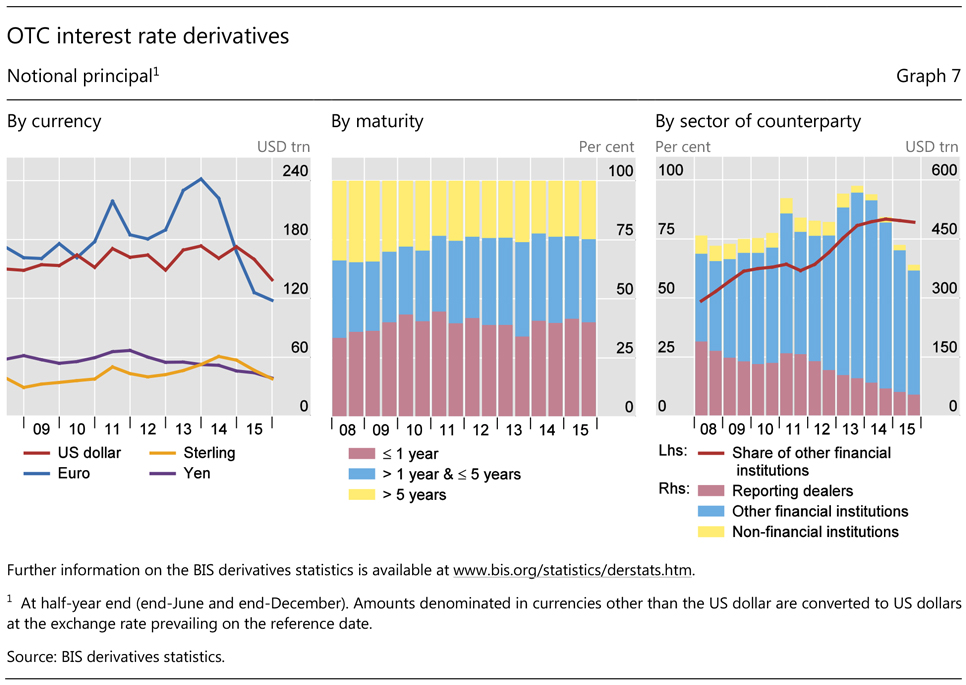
Notional amounts of interest rate contracts fell sharply in the second half of 2015, primarily driven by a contraction in US dollar-denominated instruments (Graph 7, left-hand panel). The notional value of US dollar contracts declined from $160 trillion to $139 trillion between end-June 2015 and end-December 2015. Contracts in euros decreased from $126 trillion to $118 trillion. Those in yen, sterling and other currencies also declined.
Trade compression to eliminate redundant contracts was the major driver of the decline, mainly reflecting the greater clearance of standardised contracts (eg interest rate swaps) through central counterparties (CCPs).12
Indeed, the distribution of interest rate derivatives by counterparty points to an ongoing shift towards CCPs. Central clearing is a key element in global regulators' financial reform agenda to reduce systemic risks.13 The notional amount of interest rate contracts between derivatives dealers, which had been falling more or less steadily since its peak of $189 trillion at end-June 2008, declined further during the second half of 2015 - from $61 trillion at end-June 2015 to $54 trillion at end-December 2015 (Graph 7, right-hand panel). Contracts between dealers and other financial institutions, including CCPs, stood at $315 trillion at end-December 2015, down from $360 trillion at end-June 2015. This sharp decline is likely to have stemmed from the move of trades to CCPs and related compression activity facilitated by central clearing. Contracts with financial institutions other than dealers continued to account for the majority (82%) of interest rate derivatives contracts as of end-December 2015.
The gross market value of interest rate derivatives decreased from $11.1 trillion at end-June 2015 to $10.1 trillion at end-December 2015. This mainly reflected the considerable decline in the notional amounts of outstanding contracts that took place during the same period.14
Foreign exchange derivatives
Foreign exchange derivatives make up the second largest segment of the global OTC derivatives market. At end-December 2015, the notional amount of outstanding foreign exchange derivatives contracts totalled $70 trillion, which represented 14% of OTC derivatives activity. Contracts against the US dollar represented 87% of this market segment.
After reaching its highest level for several years at end-December 2014, at $2.9 trillion, the gross market value of foreign exchange derivatives dropped during the first half of 2015 and then stabilised at around $2.5 trillion in the second half of the year. Contracts involving the US dollar increased from $2.2 trillion at end-June 2015 to $2.4 trillion at end-December 2015.
In contrast to the interest rate derivatives market, inter-dealer contracts in the foreign exchange derivatives market continued to account for nearly as much activity as contracts with other financial institutions. The notional amount of outstanding foreign exchange contracts between reporting dealers totalled $30 trillion at end-December 2015, and contracts with financial counterparties other than dealers $31 trillion. The inter-dealer share has averaged around 43% since 2011, up from less than 40% prior to 2011.
Credit default swaps
The steady reduction in the size of the global credit default swap (CDS) market, which started in 2007, continued in the second half of 2015. The notional amount of outstanding CDS contracts fell from $15 trillion at end-June 2015 to $12 trillion at end-December 2015, which represented only one fifth of its end-2007 peak of $58 trillion (Graph 8, left-hand panel).
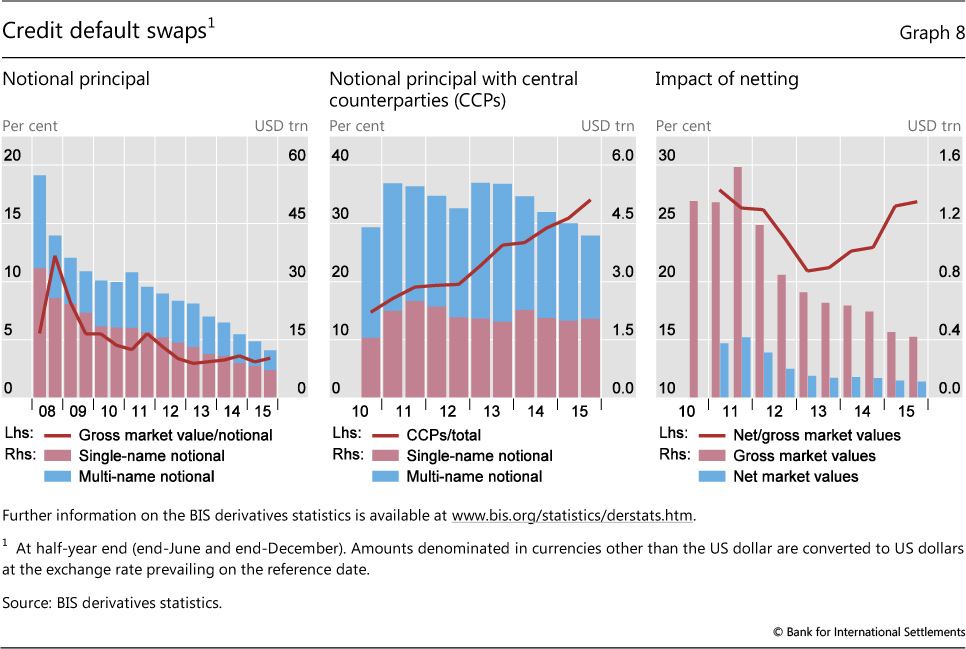
The market value of CDS also continued to decline, to $421 billion at end-December 2015 in gross terms and $113 billion in net terms (Graph 8, right-hand panel). The net measure takes account of bilateral netting agreements covering CDS contracts but, unlike gross credit exposures, is not adjusted for cross-product netting.
The recent decline in overall CDS activity reflected mainly the contraction of the inter-dealer segment. The notional amount for contracts between reporting dealers fell from $6.5 trillion at end-June 2015 to $5.5 trillion at end-December 2015. Notional amounts with banks and securities firms also decreased in the second half of 2015, from $1.2 trillion to $0.9 trillion.
Central clearing continued to make inroads. In line with the overall trend in OTC derivatives markets, notional amounts of CDS cleared through CCPs declined in absolute terms between end-June 2015 and end-December 2015, from $4.5 trillion to $4.2 trillion. Nevertheless, the share of outstanding contracts cleared through CCPs has risen, from less than 10% at mid-2010 (when data for CCPs were first reported separately) to 26% at end-2013 and 34% at end-December 2015 (Graph 8, centre panel). The share of CCPs is highest for multi-name products, at 42%, and much lower for single-name products, at 28%. One possible explanation is that contracts on CDS indices in the multi-name segment are more amenable to central clearing, as they tend to be more standardised than those in the single-name segment.
Box B
Residential property price developments
Robert Szemere
Residential property prices increased significantly in advanced economies during 2015 (Graph B1). They rose by 4% on average in the fourth quarter of 2015 on a year-on-year basis in real terms (ie deflated by the CPI), and their growth was particularly strong in Australia, Canada, the United Kingdom and the United States. Prices grew more moderately in Japan and also in the euro area, mainly driven by developments in Germany and Spain.
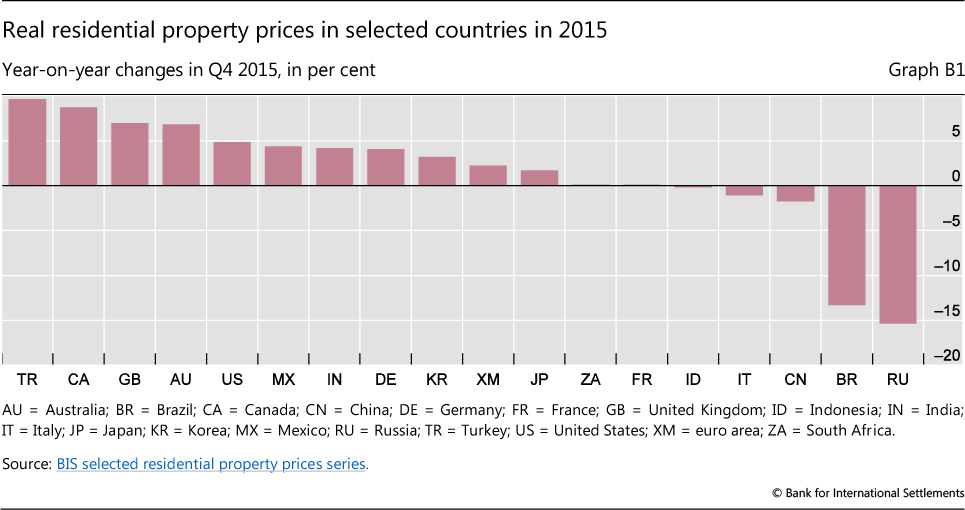
Most of the emerging market economies (EMEs) also experienced strong increases, eg Korea, India, Mexico and especially Turkey. However, prices fell markedly in some of the larger countries, in particular by around 15% in both Brazil and Russia. The result was an overall decline of 1% on average for all emerging regions (Graph B1).
Developments since 2007
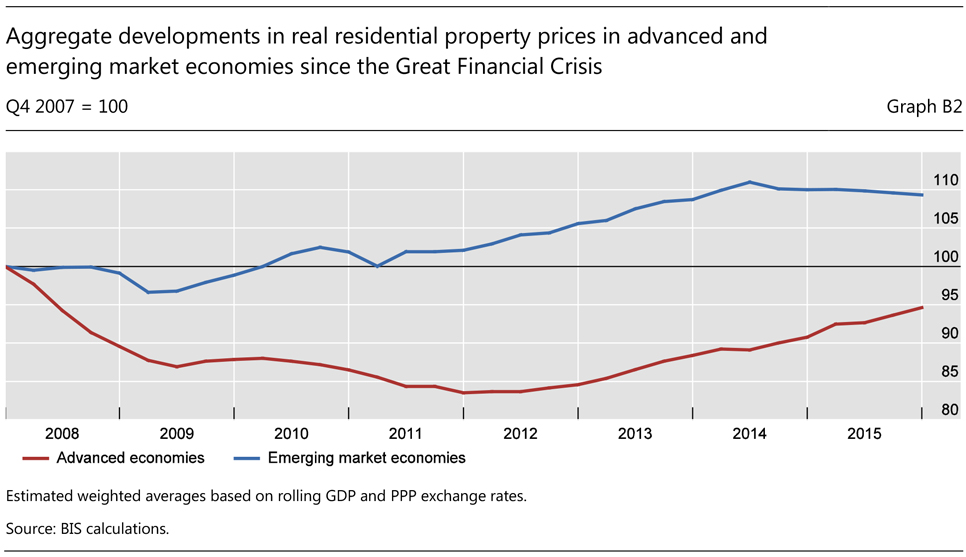
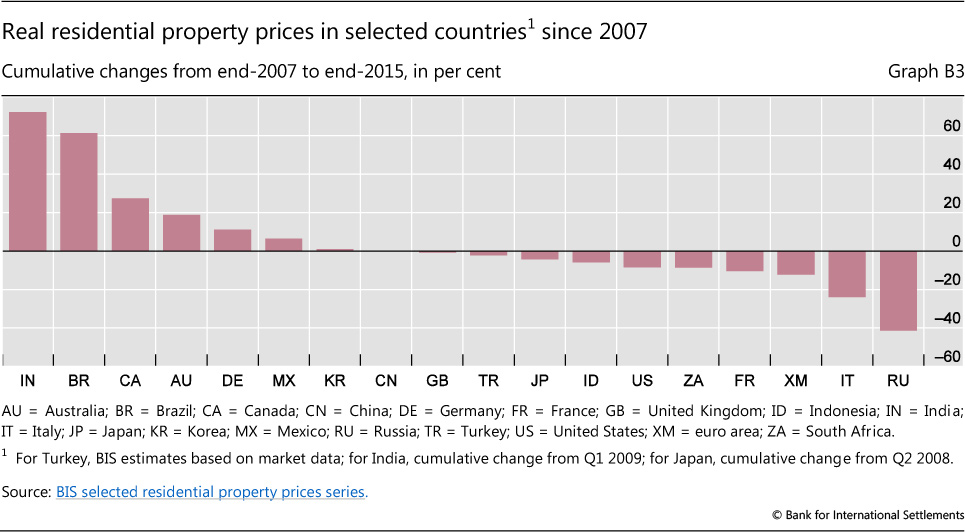
Real residential property prices at the end of 2015 were still moderately (by 5%) below their end-2007 levels for the group of advanced economies, despite the rebound observed in the past few years (Graph B2). This gap stood at 8% in the United States, despite the rally observed since mid-2011, but has narrowed more in Japan and the United Kingdom (Graph B3). It is significantly larger (-12%) in the euro area. Real property prices remain sharply lower in Spain than they were in 2007, despite having bottomed out in 2013, and are also below 2007 levels in France and Italy. However, prices are well above their pre-crisis levels in Germany. They have increased markedly in the economies which were less affected by the Great Financial Crisis, especially Australia (by almost 20%) and Canada (by almost 30%).
In contrast, residential property prices have on average been trending upwards for EMEs since the crisis. They exceed their 2007 levels by 9% in real terms. However, there have been significant disparities across countries. Prices have increased by around two thirds in Brazil (despite a significant downward correction in the last two years) and India, but significantly less in Mexico. They are roughly at their 2007 levels in China and Korea, and have fallen moderately in Indonesia and South Africa. Prices have dropped sharply since the crisis in several central and eastern European countries, in particular by more than 40% in Russia.
A note focusing on the most recent developments is published in February, August and November. Q1 2016 data for some countries are already available in the BIS data sets, but Q4 2015 data are not yet available for Chile. Price developments since early 2008 for Japan and early 2009 for India. For China, BIS calculation based on the average of the prices reported for the 70 largest cities.
References:
Scatigna, M and R Szemere (2015): "BIS collection and publication of residential property prices", Irving Fisher Committee Bulletin, no 39, April.
Scatigna, M, R Szemere and K Tsatsaronis (2014): "Residential property price statistics across the globe", BIS Quarterly Review, September, pp 61-76.
Shim, I and K Kuttner (2013): "Can non-interest rate policies stabilise housing markets? Evidence from a panel of 57 economies", BIS Working Papers, no 433, November.
Tissot, B (2014): "Monitoring house prices from a financial stability perspective - the BIS experience", International Statistical Institute Regional Statistics Conference, November.
1 This article was prepared by Stefan Avdjiev (stefan.avdjiev@bis.org) and Cathérine Koch (catherine.koch@bis.org). Statistical support was provided by Denis Pêtre and Pamela Pogliani.
2 The locational banking statistics are structured according to the location of banking offices and capture the activity of all internationally active banking offices in the reporting country regardless of the nationality of the parent bank. Banks record their positions on an unconsolidated basis, including those vis-à-vis their own offices in other countries. Throughout these Highlights, quarterly changes in outstanding amounts are adjusted for the impact of exchange rate movements between the ends of the respective quarters and for methodological breaks in the data series.
3 See "Uneasy calm gives way to turbulence", BIS Quarterly Review, March 2016, pp 1-11, www.bis.org/publ/qtrpdf/r_qt1603.htm.
4 Throughout this section, the terms "cross-border lending" and "cross-border credit" are used interchangeably with "cross-border claims" for presentational ease. That said, it should be noted that, in the BIS locational banking statistics, "cross-border claims" is a broader category which covers not only banks' loans and holdings of debt securities, but also other financial claims that they have, such as holdings of equity securities, participations and derivative instruments with positive market value. For complete definitions, see http://www.bis.org/statistics/bankstatsguide_repreqloc.pdf.
5 International bank claims are the sum of banks' cross-border claims and their local claims denominated in foreign currencies.
6 The consolidated banking statistics (CBS) provide the split of international claims by sector and maturity only on an immediate borrower basis.
7 A list of countries in the BIS reporting area is available on the BIS website at www.bis.org/statistics/rep_countries.html. China does not report international banking statistics to the BIS. However, the locational statistics and consolidated statistics on an immediate counterparty basis capture the positions of Chinese and other banks headquartered outside the BIS reporting area to the extent that these positions are booked through offices in a BIS reporting country.
8 For further details, see R McCauley and C Shu, "Dollars and renminbi flowed out of China", BIS Quarterly Review, March 2016, pp 26-7, www.bis.org/publ/qtrpdf/r_qt1603.htm; and R McCauley, "Capital flowed out of China through BIS reporting banks in Q1 2015", BIS Quarterly Review, September 2015, pp 28-9, www.bis.org/publ/qtrpdf/r_qt1509u.htm.
9 The set of oil-exporting countries considered here comprises Algeria, Angola, Bahrain, Ecuador, Egypt, Indonesia, Iran, Iraq, Kazakhstan, Kuwait, Libya, Mexico, Nigeria, Norway, Oman, Qatar, Russia, Saudi Arabia, Syria, the United Arab Emirates, Venezuela and Yemen.
10 Positions are reported in US dollars, and thus changes between periods include the impact of exchange rate movements on positions denominated in currencies other than the US dollar. For example, the depreciation of the euro against the US dollar between end-June 2015 and end-December 2015 resulted in a decline in the reported US dollar value of positions denominated in euros.
11 The gross market value is calculated as the sum of the absolute value of gross positive market values and gross negative market values. The gross positive market value is the gain to derivatives dealers - and the gross negative market value the loss - if the dealers were to sell their outstanding contracts at market prices prevailing on the reporting date.
12 Compression aggregates derivatives contracts with similar risks or cash flows into fewer trades. This process of "tearing up" trades allows economically redundant derivative trades to be terminated early without changing each participant's net position. For statistics on multilateral compressions, see TriOptima, www.trioptima.com/resource-center/statistics/triReduce.html.
13 See D Domanski, L Gambacorta and C Picillo, "Central clearing: trends and current issues", BIS Quarterly Review, December 2015, pp 59-76.
14 Trade compression, which was one of the main drivers of the overall decline in notional amounts, tends to reduce gross market values (all else the same) while leaving gross credit exposures (ie gross market values adjusted for netting) unchanged.