Highlights of global financing flows
The BIS, in cooperation with central banks and monetary authorities worldwide, compiles and disseminates data on activity in international financial markets. It uses these data to compile indicators of global liquidity conditions and early warning indicators of financial crisis risks. This chapter analyses recent trends in these indicators. It also summarises the latest data for international banking markets, available up to March 2015, and for international debt securities, available up to June 2015. A box provides more detail on domestic and foreign currency positions vis-à-vis China during the first quarter of 2015.1
Takeaways
- Global liquidity conditions were strong in the early months of 2015 for borrowers in advanced economies, but signs of weakening were apparent for emerging market economies (EMEs). International financing in advanced economies was marked by especially strong growth in bank and capital market financing in euros. At the same time, international bank lending and securities financing slowed or reversed for a number of EMEs, notably China and Russia.
- At end-March 2015, financing of non-bank borrowers in US dollars outside the United States totalled $9.6 trillion, while financing of non-banks in euros outside the euro area came to $2.8 trillion.
- Global cross-border claims of BIS reporting banks continued to expand in early 2015, rising by $748 billion in exchange rate-adjusted terms between end-December 2014 and end-March 2015.
- International debt securities issuance remained strong, with net issuance of $225 billion in the first quarter of 2015 and $219 billion in the second.
- Euro-denominated cross-border claims and claims on the euro area surged during the first quarter of 2015. About half of this euro-denominated increase went to non-bank borrowers and about half came from lenders inside the euro area. Greece was a notable exception: cross-border lending to residents of the country mostly denominated in euros fell by $22 billion between end-December 2014 and end-March 2015.
- Cross-border bank lending to EMEs contracted by $52 billion on an exchange rate-adjusted basis in the first quarter of 2015.
- Lending to China declined for the second consecutive quarter, slowing the annual growth rate to almost zero.
- Cross-border claims on Russia and Ukraine saw another quarterly decline, accelerating their annual rates of contraction to a respective 29% and 48%.
- Net debt securities issuance by advanced economy borrowers expanded at the fastest pace since before the Great Financial Crisis of 2007-09, totalling $247 billion in the first half of 2015. EME borrowers, meanwhile, issued $137 billion in the first half, net of repayments, a notably slower growth rate than in the previous three years.
- Early warning indicators point to continued vulnerability associated with debt overhangs in key EMEs.
Recent developments in the international bank and debt markets
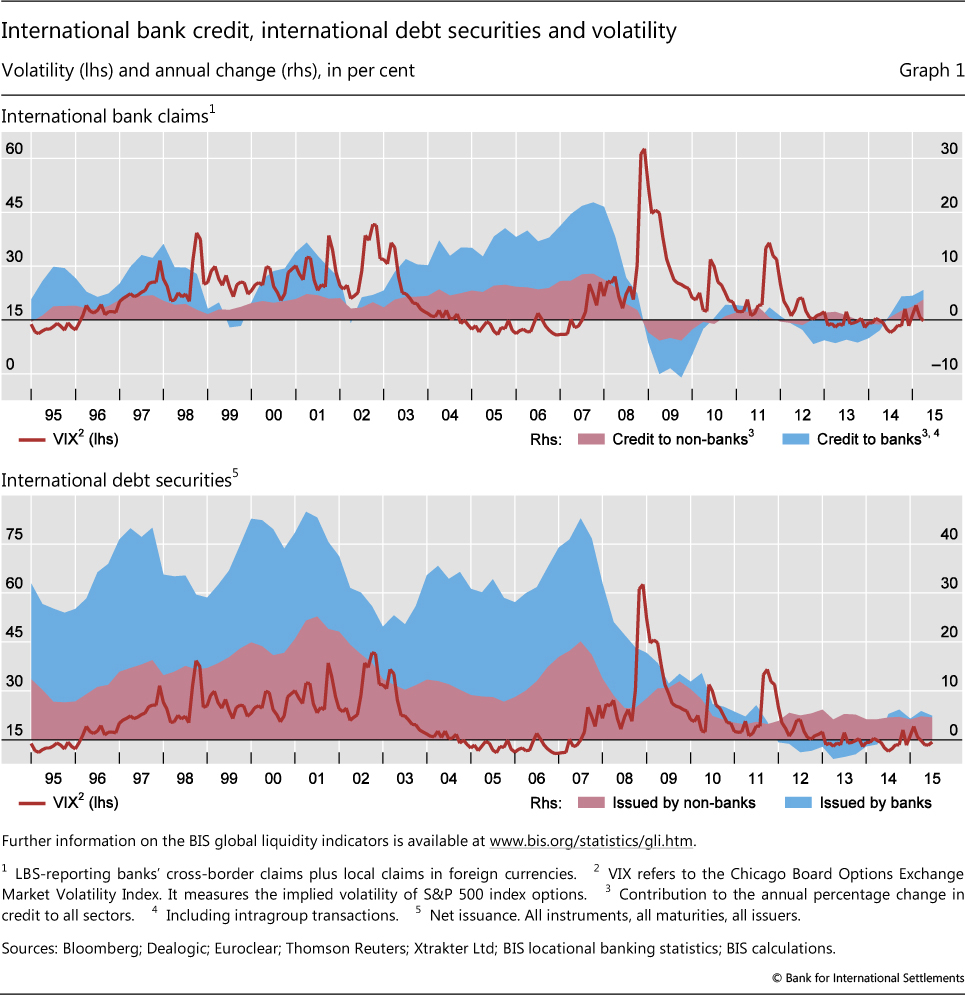
Despite bouts of volatility in securities and commodity markets (see "A wave of further easing", BIS Quarterly Review, March 2015), international financial activity strengthened in the early months of 2015. According to the BIS locational banking statistics (LBS),2 international bank claims grew by almost 6%3 from the first quarter of 2014 to the first quarter of 2015 (Graph 1, top panel), and by close to 3% in Q1 2015 alone. Claims on non-banks increased by $626 billion in the first quarter of 2015, adjusted for breaks and exchange rates, while claims on banks rose by $218 billion. Meanwhile, as reported by the BIS international debt securities statistics (IDS),4 net issuance continued to grow at the steady pace seen since the end of the Great Financial Crisis (Graph 1, bottom panel). Net issuance totalled $188 billion in the first quarter of 2015 and $198 billion in the second, compared with $509 billion for the whole of 2014.
The steady overall growth of international financing activity masked important changes in composition, particularly with respect to the balance between advanced and emerging market economies. According to the LBS, cross-border bank claims on advanced economies grew by $738 billion (in exchange rate-adjusted terms) in the first quarter of 2015, rising by 6% year on year. Increased lending during Q1 2015 was led by especially strong growth in claims on European countries and Japan. By contrast, cross-border lending to EMEs shrank by $52 billion during the first quarter, and recorded growth of only 0.5% over a year earlier. Lending to China, after several quarters of rapid growth, started to contract in late 2014 and showed essentially no growth in the year to end-March 2015.
Advanced and emerging market economies also diverged with respect to international debt securities issuance. The IDS database suggests that net issuance in advanced economies returned to a rapid pace in the first two quarters of 2015 after a few years of low or negative net issuance. By contrast, EME net issuance slowed.

The remainder of this chapter reviews these developments in more detail, focusing on the BIS statistics on international banking and international debt securities, and on the BIS global liquidity indictors (GLIs). It concludes with a brief review of recent trends in credit growth and debt service ratios (DSRs) in the major advanced and emerging market economies.
Global foreign currency credit to the non-financial sector
Global credit to the non-resident, non-financial sector in US dollars and euros continued to grow faster than credit to non-financial residents of the United States and the euro area (Graph 2).
According to the GLIs, credit in US dollars to non-bank borrowers outside the United States totalled $9.6 trillion at the end of Q1 2015. Excluding non-bank financial borrowers from this figure, the total of credit in US dollars to non-financial borrowers comes to $7.8 trillion (Graph 2, top left-hand panel). Bank loans in dollars to these non-financial borrowers stood at $5.3 trillion, an annual increase of almost 10%, while securities issued amounted to $2.5 trillion, lifting the annual growth rate of the outstanding stock to 9% (Graph 2, top right-hand panel). Both grew faster than did US dollar credit to non-financial residents of the United States (which rose 4%). These growth rates have been remarkably stable for several years.
At end-March 2015, credit in euros to non-bank borrowers outside the euro area totalled $2.8 trillion. Excluding non-bank financials again, the total of credit in euros to non-financial borrowers is $2.1 trillion, comprising $1.2 trillion in bank loans and $915 billion in debt securities (Graph 2, middle left-hand panel). The outstanding stock of euro-denominated bonds issued by non-resident non-financials jumped by almost 14% on an annual basis, driven in part by a sharp net increase in euro-denominated debt issuance by US non-financial corporations. Bank lending in euros to non-financials outside the euro area, which had contracted for much of 2013, started rising again in the first quarter of 2014 and rose by 10% in the year to March 2015 (Graph 2, middle right-hand panel). Both banking and securities credit growth in euros to the non-resident non-financial sector far outpaced the growth in credit to residents in the non-financial sector of the euro area, which grew 4%.
Credit in yen to non-financial borrowers outside Japan, at end-March 2015, comprised $347 billion in bank lending and $66 billion in debt securities. Bank lending grew by 4% in the year to March 2015, whereas the stock of outstanding debt securities contracted by 9.3% over the same period (Graph 2, bottom panels).
Global cross-border credit
The expansion of global cross-border lending that began in the second quarter of 2014 picked up in the first three months of 2015. According to the LBS, the cross-border claims of BIS reporting banks increased by $748 billion between end-December 2014 and end-March 2015, lifting the annual growth rate to almost 6% (Graph 3, left-hand panel).5

An increase of $563 billion in cross-border claims to non-banks accounted for more than three quarters of the global increase during the first quarter of 2015, boosting the annual growth rate to 10% (Graph 3, left-hand panel). Meanwhile lending to banks increased by $132 billion at end-March 2015, offsetting a similarly sized decline from the previous quarter. The annual growth rate of cross-border interbank lending slowed to less than 2% at end-March 2015.
International banking activity picked up across all major instruments. Increases in banks' debt securities holdings and loans contributed almost equally to the overall expansion in cross-border claims (Graph 3, right-hand panel). Between end-December 2014 and end-March 2015, the outstanding amount of loans grew by $319 billion, while banks' holdings of debt securities rose by $318 billion. The latest quarterly expansions in banks' cross-border loans and debt securities holdings brought the cumulative annual increases in those two categories since the start of 2014 to $1 trillion and $570 billion, respectively.
Currency composition of cross-border bank lending
The expansion of aggregate cross-border lending between end-December 2014 and end-March 2015 was driven primarily by a $536 billion surge in euro-denominated claims. According to the LBS, this increase boosted the annual growth rate of euro-denominated claims to 9% (Graph 4, left-hand panel). More than two thirds (70%) of this increase was due to a rise in loans, while the increase in debt securities held by banks accounted for 18%. Non-bank borrowers accounted for 49% of the upturn in euro-denominated claims. About half (53%) of the surge in euro-denominated claims was lent by banks located within the euro area and 28% was lent by banks located in the United Kingdom.

During Q1 2015, claims denominated in US dollars were up by $54 billion. A $156 billion increase in banks' holdings of US dollar-denominated debt securities more than offset a $99 billion decline in loans. Claims denominated in sterling ($60 billion) and in Swiss francs ($32 billion) also expanded, lifting their annual growth rates to a respective 5% and 9%. Yen-denominated cross-border lending declined during the quarter (by $10 billion), but the annual growth rate remained strong at 14%.
Credit to advanced economies
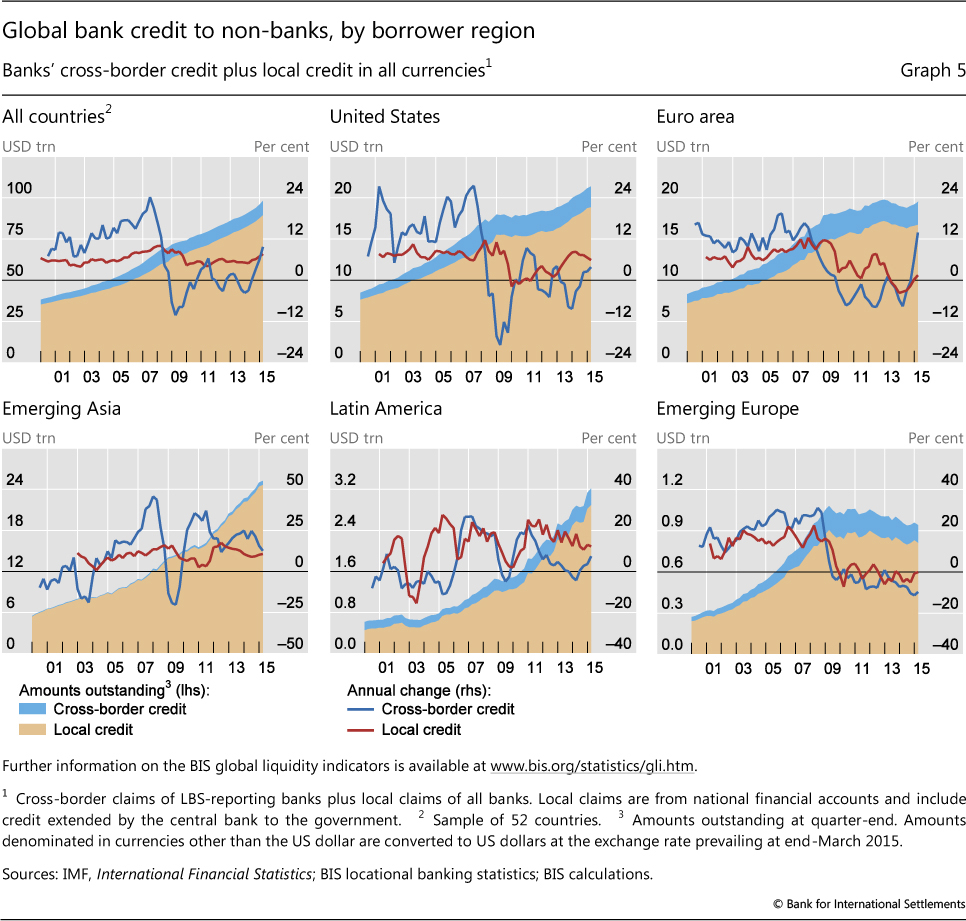
According to the GLIs, cross-border credit to non-banks grew slightly faster than domestic credit to these borrowers during Q1 2015, for the first time since the financial crisis (Graph 5, top left-hand panel). The crossover is significant: past experience has shown that cross-border credit tends to amplify domestic credit conditions, with the cross-border component growing more rapidly during financial booms and more slowly, or contracting, during busts. However, the picture varied markedly across countries and regions.
The increase in the first quarter largely reflected rapid cross-border credit to advanced economies. But even within this group, the aggregates conceal considerable differences. Domestic credit to the US non-bank sector grew at 5%, losing momentum relative to the last quarter in 2014, whereas the pace of cross-border credit to US non-banks rose to 4% on an annual basis (Graph 5, top centre panel). By contrast, domestic credit to non-banks in the euro area remained almost unchanged and cross-border credit jumped considerably, to 13%, on an annual basis (Graph 5, top right-hand panel).
Turning to cross-border bank credit vis-à-vis all sectors, LBS data suggest that the trends that had been developing since 2014 continued in the first quarter. The annual growth rates of cross-border claims, which had been negative for several years after the crisis before turning positive in 2014, remained in positive territory. Growth rates were particularly high for Japan (16%), the euro area (9%), the United Kingdom (8%) and Switzerland (5%), while cross-border claims on the United States remained virtually unchanged between March 2014 and 2015 (Graph 4, right-hand panel).
Cross-border claims on all borrowers in the euro area (including intra-euro area claims and all sectors) rose by $418 billion during Q1 2015, spurring the annual growth rate to almost 9%. As pointed out by the LBS, this was the highest quarterly increase in absolute terms since Q1 2008 (Graph 4, right-hand panel). Interbank activity contributed slightly less than borrowing by non-banks to this figure. Banks from the euro area accounted for a little less than half of the increase, while banks located in the United Kingdom accounted for 35% of this increase. A $153 billion upsurge in lending to Germany fuelled the overall increase in cross-border claims on the euro area. France also saw a significant ($124 billion) rise in overall cross-border claims on its residents. By contrast, lending to Spain, Italy, Ireland and Portugal remained virtually unchanged.
Cross-border bank lending also increased to borrowers in European countries outside the euro area (Graph 4, right-hand panel). Cross-border claims on Switzerland surged by $60 billion between end-December 2014 and end-March 2015, again on an exchange rate-adjusted basis. About 83% of the increase reflects interbank activity. With reporting banks' cross-border liabilities to Switzerland having declined by $24 billion during the same period, their overall net claims on Switzerland increased by more than $86 billion. Claims on Denmark and Sweden saw similar increases. Cross-border claims on Denmark jumped by $27 billion and those on Sweden surged by $13 billion. In both cases, about two thirds of the increases involved cross-border claims on the banking sector.
Greece was a notable exception to the overall pattern of increased lending in Europe. According to the LBS, the cross-border claims of internationally active banks on Greece dropped by $22 billion during Q1 2015. As a result, the annual rate of contraction reached 28% at end-March 2015. Figures from the CBS6 on an immediate counterparty basis tell a similar story, revealing a $31 billion (€26 billion) decline in international lending to Greek residents7 during the first quarter of 2015 (Graph 6).
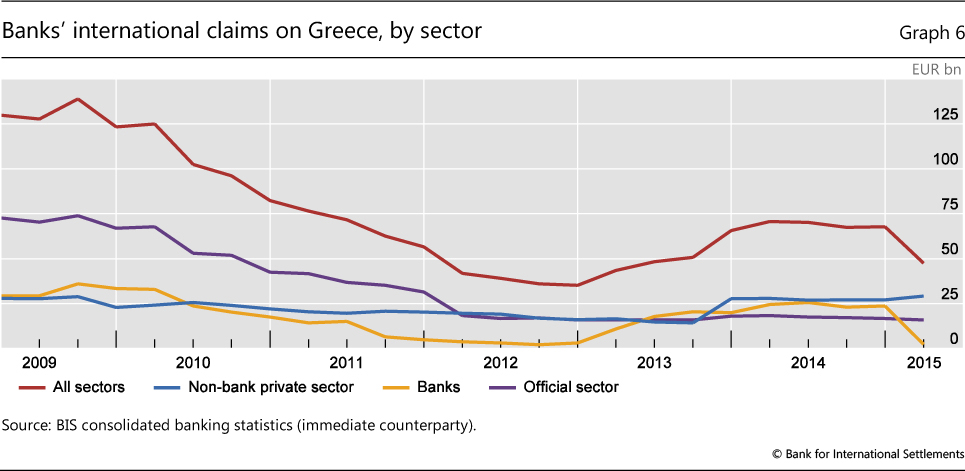
Most of the decline was accounted for by $26 billion (or €21 billion) of lending to Greek banks. The outstanding stock of consolidated international claims on Greek banks (on an immediate counterparty basis) amounted to $2.5 billion (€2.3 billion) at end-March 2015. International claims on the Greek official sector stood at $17 billion (€16 billion) at end-March 2015, compared with $25 billion a year earlier.
The reduction in international claims on Greece in 2014 and 2015 followed a two-year period in which many foreign banks were tentatively returning to the Greek market (Graph 6). The increase in lending to Greece between 2012 and 2014 was primarily driven by German, UK and US banks. By contrast, French banks cut their exposures sharply during the same period. By March 2015, claims on Greece had fallen below their respective March 2012 levels for all major foreign banking systems except Germany's.
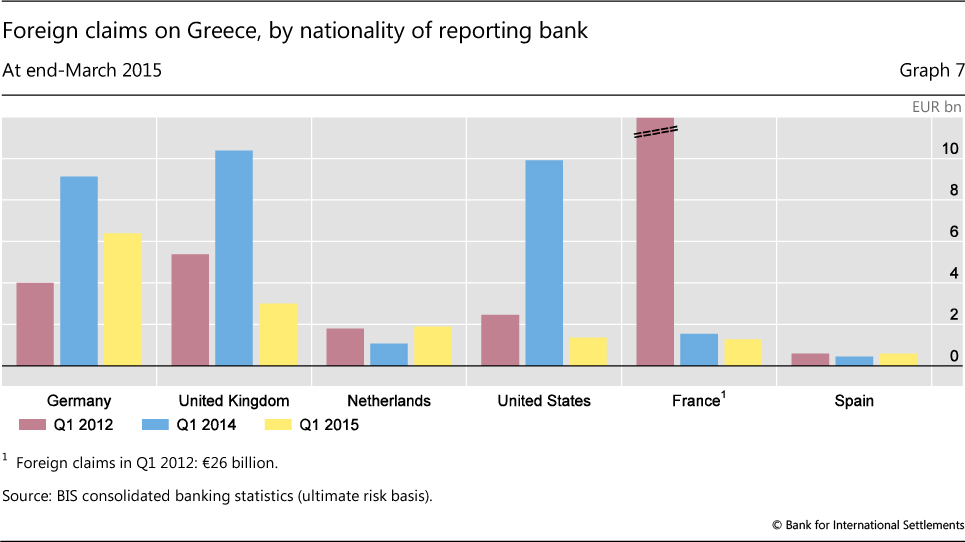
As a result, German banks were the largest foreign bank lenders to Greece at end-March 2015 (Graph 7). They had €7 billion of outstanding foreign claims on an ultimate risk basis, of which about two thirds were on the non-bank private sector. Banks headquartered in the United Kingdom reported foreign claims of about €3 billion, while Dutch, US, French, Italian and Spanish banks held foreign claims of €2 billion or less. The majority of the foreign claims of German, Dutch, US and French banks on Greece were in the form of cross-border lending. By contrast, most claims of Italian and Spanish banks on Greece were extended through their local affiliates.
Bank credit to emerging market economies
According to the GLIs, the growth rates of domestic and cross-border credit to the non-bank sector in Latin America and emerging Asia-Pacific continued to converge during the first quarter of 2015 (Graph 5, bottom panels).
Cross-border credit growth in emerging Asia to the non-bank sector slowed to an annual rate of 13% at end-March 2015 from its most recent peak of 25% in Q4 2013. Cross-border growth still slightly exceeded domestic credit growth (at 11%). However, the stock of cross-border credit relative to domestic credit in Asia-Pacific remained quite small in comparison with other regions, notably Latin America and especially emerging Europe.
Cross-border credit to non-banks in Latin America saw another quarterly increase between end-December 2014 and end-March 2015, with annual growth rising to 7% but remaining below the almost unchanged domestic growth rate of 12%.
Overall, domestic credit to non-banks in emerging Europe8 stagnated during the first quarter of 2015, whereas cross-border credit declined by 10%.
Data from the LBS show that, between end-December 2014 and end-March 2015, cross-border bank lending to all sectors (banks and non-banks) in EMEs declined for a second consecutive quarter, following two years of considerable growth. Cross-border claims on EMEs contracted by $52 billion in exchange rate-adjusted terms during the first quarter of 2015, slowing the year-on-year growth rate to below 1%.
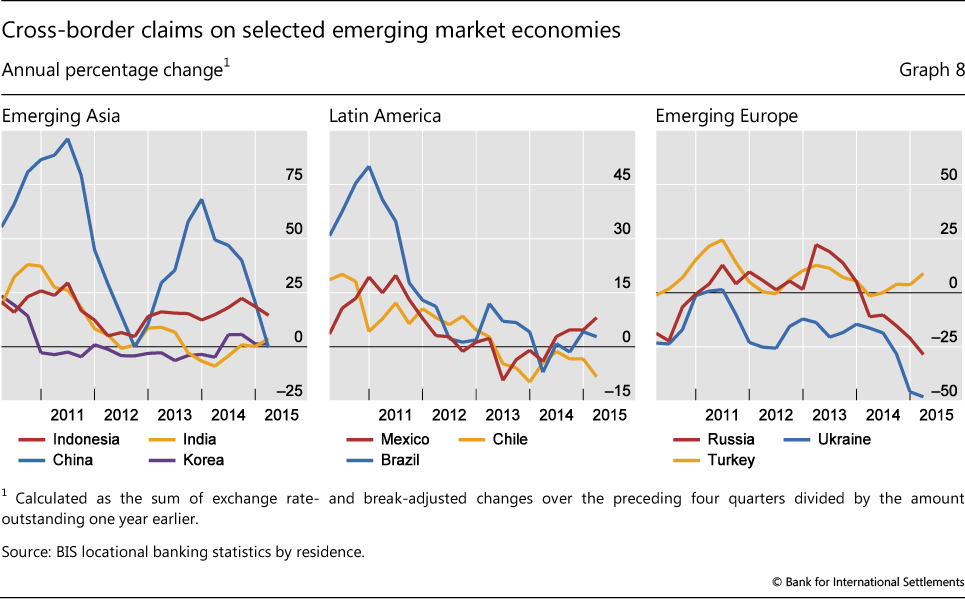
Continuing the trend observed in recent years, claims on China drove the aggregate quarterly change in cross-border lending to EMEs as a whole and emerging Asia in particular. During the first quarter of 2015, cross-border lending to emerging Asia fell by $53 billion, slowing its annual growth rate to almost zero after several years of strong growth. This decline in claims on emerging Asia was more than accounted for by a $56 billion fall in cross-border claims on China, which brought down the year-on-year growth in claims on that country to zero (Graph 8, left-hand panel). The latest contraction in lending to China, which was driven by a $64 billion decline in cross-border claims on banks, took the outstanding stock of claims on the country to $963 billion at end-March 2015. The box below looks more closely at shifts in dollar- and renminbi-denominated banking flows to and from China in the early months of 2015.
Capital flowed out of China through BIS reporting banks in Q1 2015
Robert N McCauley
Capital outflows from China are much discussed, with many analyses focused on a seeming decline in official foreign exchange reserves. Yet measuring capital outflows with declines in foreign exchange reserves neglects valuation changes due to dollar/euro movements. Moreover, official reserves can be used to fund dollar investments in, for instance, new multilateral development banks.
However, BIS locational international banking statistics show a net $109 billion outflow in Q1 2015 from banks in China to banks outside China. This has put downward pressure on the renminbi and, given close currency management, on official reserves. This box shows how weakening incentives to hold long-renminbi positions resulted in the net outflow that took place both in foreign currency and in the renminbi in the first quarter. These results offer clues as to what may happen in the third quarter, during which China changed its exchange rate policy.
In the first quarter, the incentives for holding long-renminbi, short-dollar positions waned. First, the Chinese authorities continued the easing cycle that began in November by cutting administered deposit rates. And second, the renminbi was allowed to depreciate against the dollar from less than 6.2 per dollar to over 6.25 in mid-March. As a result, option-implied currency volatility rose. In short, the interest rate differential narrowed and the cost of insuring against further depreciation increased, reducing incentives for the long-renminbi position.
To clarify this point, consider a stylised Chinese multinational firm, with its balance sheet partly in China and partly outside. In China, the firm borrows and makes deposits in both renminbi and foreign currency. Its foreign currency debt at home exceeds its foreign currency deposits there. Outside China, it also has a larger foreign currency debt than foreign currency deposits, but more renminbi deposits than renminbi debt.
In response to reduced incentives, if the multinational sought to reduce its long-renminbi, short-foreign currency position, how would it have done so? The firm needs to reduce net foreign currency liabilities while shedding renminbi deposits. One place to adjust is within China. The People's Bank of China (PBoC) reports that foreign currency deposits at banks in China banks grew by $83 billion in the first quarter while the increase in their foreign currency loans slowed to only $34 billion. Thus the multinational might have reduced its net foreign currency debt by building up foreign currency deposits in China. As a result, banks in China experienced a net inflow of $49 billion in foreign currency. If banks in China, in turn, placed their excess foreign currency funding with banks in the rest of the world, BIS reporting banks would experience a corresponding rise in liabilities to banks in China. And indeed, BIS reporting banks increased their liabilities to banks in China by $46 billion in the first quarter.
Alternatively, the firm could adjust its position outside China. For example, the treasurer could reduce renminbi deposits in an offshore bank. In fact, total renminbi deposits held in banks in Hong Kong SAR, Chinese Taipei, Singapore and Korea fell by $10 billion in Q1 2015 (Graph A). Or the treasurer could liquidate structured notes that are related to the renminbi/dollar rate that require his counterparty bank to hold renminbi as a hedge against fluctuations in the notes' currency value. Such a liquidation would not show up in these non-bank deposit data. But fortunately, the PBoC now reports total renminbi deposits held by the rest of the world in banks in China. According to the PBoC, such deposits fell by $57 billion, which would reflect both the $10 billion reduction of renminbi deposits and lower bank demand for renminbi, whether arising from customer transactions or banks' positioning of their own funds. Whatever its source, this $57 billion renminbi outflow accounts for the bulk of the $63 billion decline in claims on banks in China recorded by BIS reporting banks.
So, piling up foreign currency deposits in China ($49 billion), and reducing long-renminbi positions outside China ($57 billion), our stylised multinational could set off transactions that would lead to almost $109 billion in net outflows from banks in China. That much of the outflow was renminbi-denominated signifies progress in cross-border renminbi use - but also that this use has depended on favourable yield differentials and currency expectations.
Of course, reality is more complex than a single actor adjusting its renminbi/dollar position on both sides of the border. Non-banks in China actually borrowed a further $7 billion in the quarter from BIS reporting banks. This counts as a capital inflow, so that the net outflow from banks and non-banks in China was $102 billion in Q1 2015. And other entities, such as small and medium-sized enterprises in Hong Kong SAR and Chinese Taipei, have also entered long-renminbi, short-dollar positions and might also have unwound them in Q1 2015.
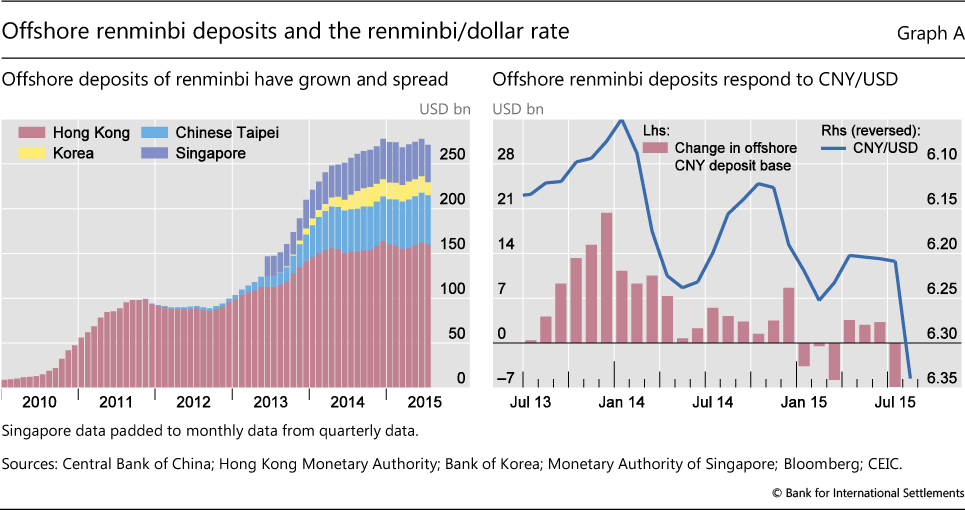
Second quarter data suggest a partial reversal of these moves against a backdrop of renminbi/dollar stability. In China, net foreign currency liabilities rose by $19 billion. PBoC data show a $15 billion recovery in renminbi deposits placed in China by the rest of the world. This would in part reflect a $10 billion recovery in offshore deposits in the second quarter (Graph A, right-hand panel).
The third quarter is seeing reduced incentives to hold long-renminbi, short-dollar positions. Another cut in deposit rates narrowed the renminbi's yield advantage, and reform of the renminbi's management raised its volatility. Thus, the reward-to-risk ratio deteriorated, reducing the incentive to hold such positions.
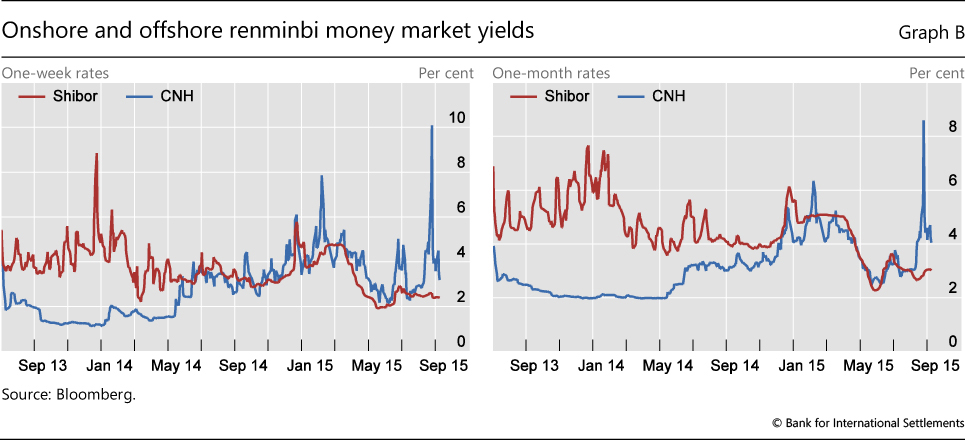
Indeed, yields give early evidence of liquidations of offshore renminbi deposits (Graph B). On 25 August, at the height of the recent equity and exchange market turbulence (see "EME vulnerabilities take centre stage", BIS Quarterly Review, September 2015), the offshore renminbi (CNH) interbank interest rates in Hong Kong reached the unprecedented levels of 10.1% for the one-week and 8.6% for the one-month tenor, reinforcing reports of renminbi selling. The August data on foreign exchange deposits and lending at Chinese banks and on offshore deposits will provide the first glimpses of the response to the altered risk-reward profile of long-renminbi positions.
H Zhu, "China: the myth of capital outflows", JPMorgan Chase, Asia-Pacific Economic Research, 28 July 2015, calculates an adjusted $15 billion drop in Chinese reserves in June 2014-June 2015. V Bruno and H S Shin, "Global dollar credit and carry trades: a firm-level analysis", BIS Working Papers, no 510, August 2015. See PBoC, "Financial statistics, Q1 2015". Placements either at the PBoC by designated clearing banks or by offshore banks with banks in China. See W Nixon, E Hatzvi and M Wright, "The offshore renminbi market and renminbi internationalization", in L Song, R Garnaut, C Fang and L Johnston (eds), China's domestic transformation in a global context, ANU Press, 2015, page 276, for a list of clearing banks. W Gu and A Trivedi, "Yuan's devaluation brings losses for some", The Wall Street Journal, 18 August 2015.
By contrast, cross-border lending to several other emerging Asian economies picked up in the first quarter of 2015. Cross-border lending to India increased by $8 billion and to Korea by $3 billion, lifting their annual growth rates to 4% and 1%, respectively. Cross-border lending to Indonesia fell in the first quarter, but its annual growth rate remained strong at 15%.
Cross-border claims on Latin America and the Caribbean grew by $2.1 billion between end-December 2014 and end-March 2015, driven mainly by a $1.3 billion rise in lending to Brazil (Graph 8, centre panel). Meanwhile, claims on Mexico remained unchanged during the first quarter of 2015 but still grew by 8% on an annual basis. Lending to Chile continued to decline.
Lending to emerging Europe fell during the first three months of 2015, albeit at a more moderate pace than in the preceding quarter. Cross-border claims on Russia dropped by $14 billion during Q1 2015, following the $19 billion fall in the previous quarter. This accelerated the annual rate of decline to 29% (Graph 8, right-hand panel). Cross-border lending to Ukraine contracted by $1 billion in Q1 2015, bringing the annual rate of decline to 48% at the end of March 2015. By contrast, cross-border lending to Turkey expanded by $4 billion, boosting its annual growth rate to 9%. In the meantime, cross-border claims on Hungary and the Czech Republic picked up marginally.
International debt securities
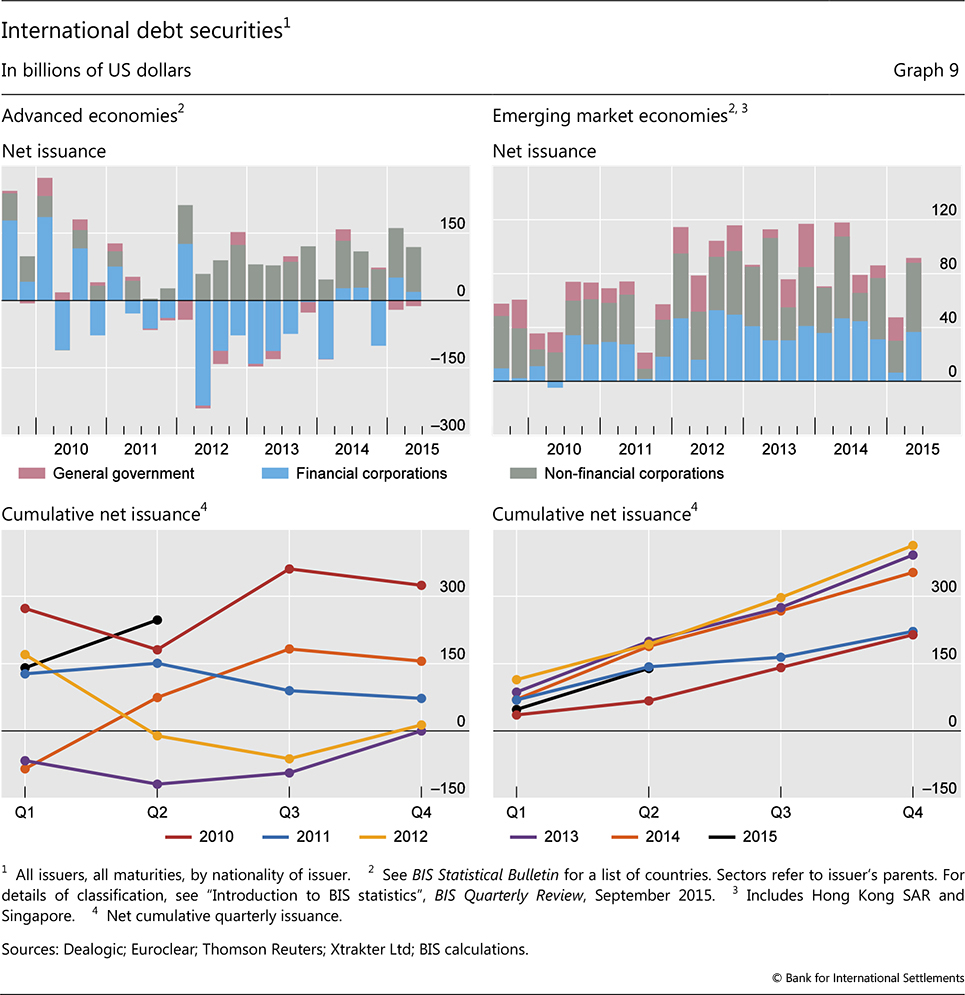
Net issuance in international debt securities markets grew to $225 billion in the first quarter of 2015 and $219 billion in the second (Graph 9). According to the IDS, at $444 billion, issuance in the first half of 2015 was 49% and 26% higher than in the second and first halves of 2014, respectively. The pace of net issuance in advanced economies, at $247 billion, ran well ahead of that of the last few years (Graph 9, bottom left-hand panel). Borrowers based in EMEs issued $137 billion, a slower pace than in recent years (Graph 9, bottom right-hand panel). Offshore centres and international organisations accounted for the remainder.
Issuance was especially strong among non-financial issuers, who accounted for 64% ($285 billion) of the total in the first half of 2015.9 Advanced economy issuers led the way. US non-financials issued $93 billion in international debt securities in the first half, compared with $124 billion in all of 2014 and $71 billion in 2013. By contrast, issuance by non-financials in EMEs was only $75 billion in the first half of 2015, compared with $161 billion for all of 2014 and $189 billion in 2013. Net issuance by Chilean non-financials grew in the first half, while issuance by non-financials from China stagnated and that from Brazil and Korea turned negative on a net basis.
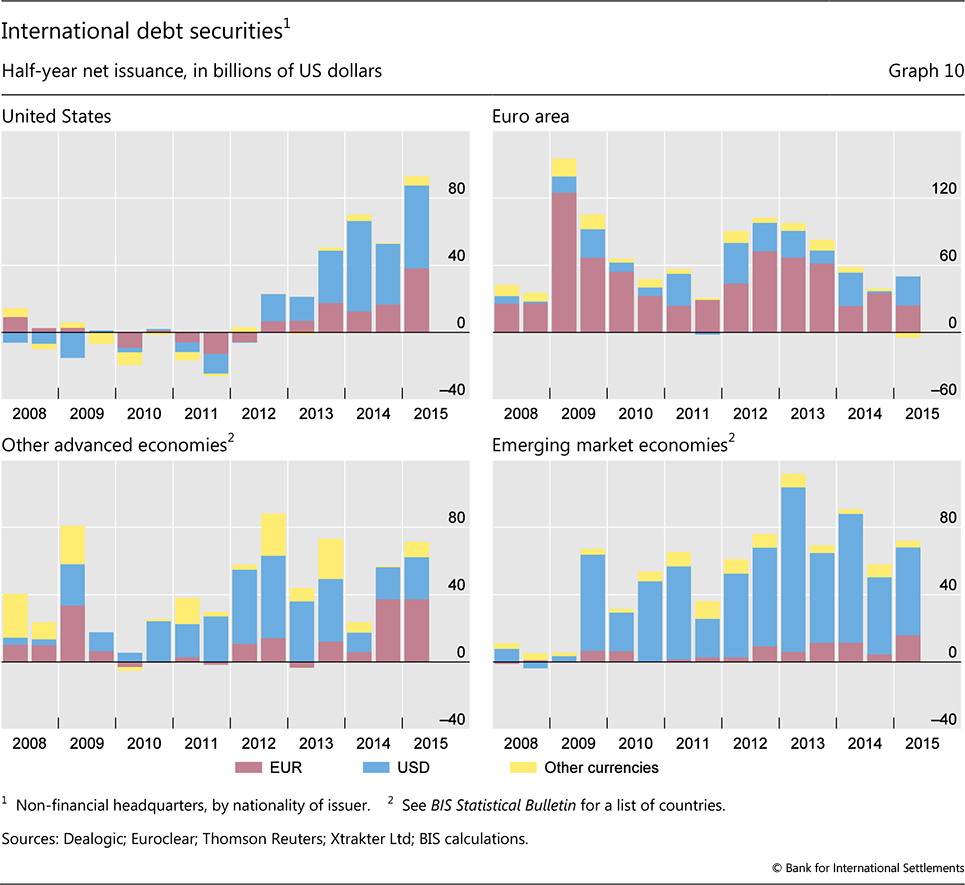
Bond issuers made increasing use of the euro. In the first half of 2015, net issuance in euros totalled $78 billion of bonds and notes and $41 billion of money market instruments, compared with 2014 when net issuance of money market securities was $9 billion and a net $27.5 billion of bonds and notes were repurchased. Borrowers in advanced economies outside the euro area were especially active on the euro-denominated markets (Graph 10, left-hand panels). US-based non-financial corporations issued a net $24 billion of debt securities denominated in euros in the first quarter of 2015 and $14 billion in the second, after net euro issuance of only $29 billion for the whole of 2014. This included a number of "reverse yankee" issues in the European market. EME issuers, by contrast, continued to rely primarily on the dollar. That said, they also increased their euro-denominated issuance to $16 billion in the first half of 2015, compared with $16 billion in the whole of 2014 (Graph 10, bottom right-hand panel).
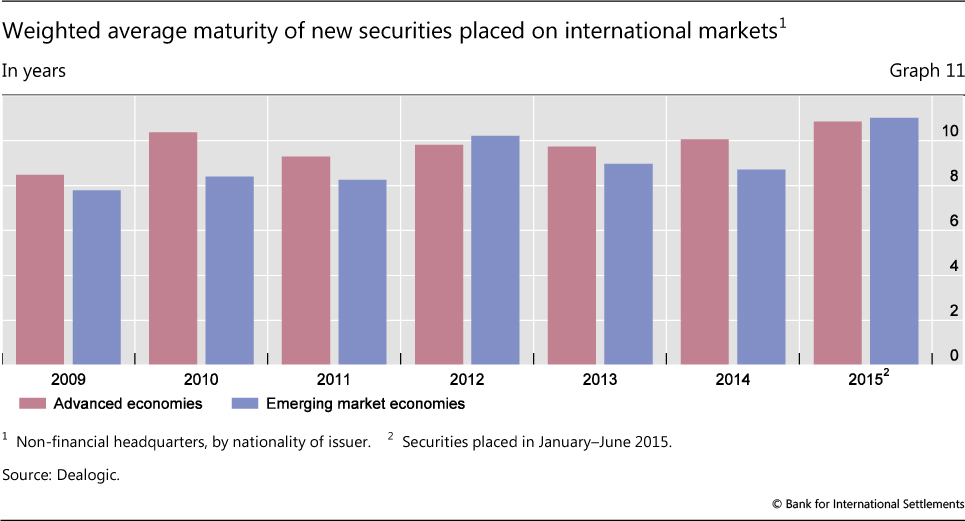
With long-term rates remaining low but monetary tightening on the horizon, international issuers moved to extend maturities in 2015 (Graph 11). For advanced economy issuers, the weighted average maturity of new issues rose from 10 years at end-2014 to almost 11 years at mid-2015. Maturities also rose for EME issuers, from 8.7 years in 2014 to 11.0 years so far in 2015, even as the pace of new issues slowed.
Early warning indicators
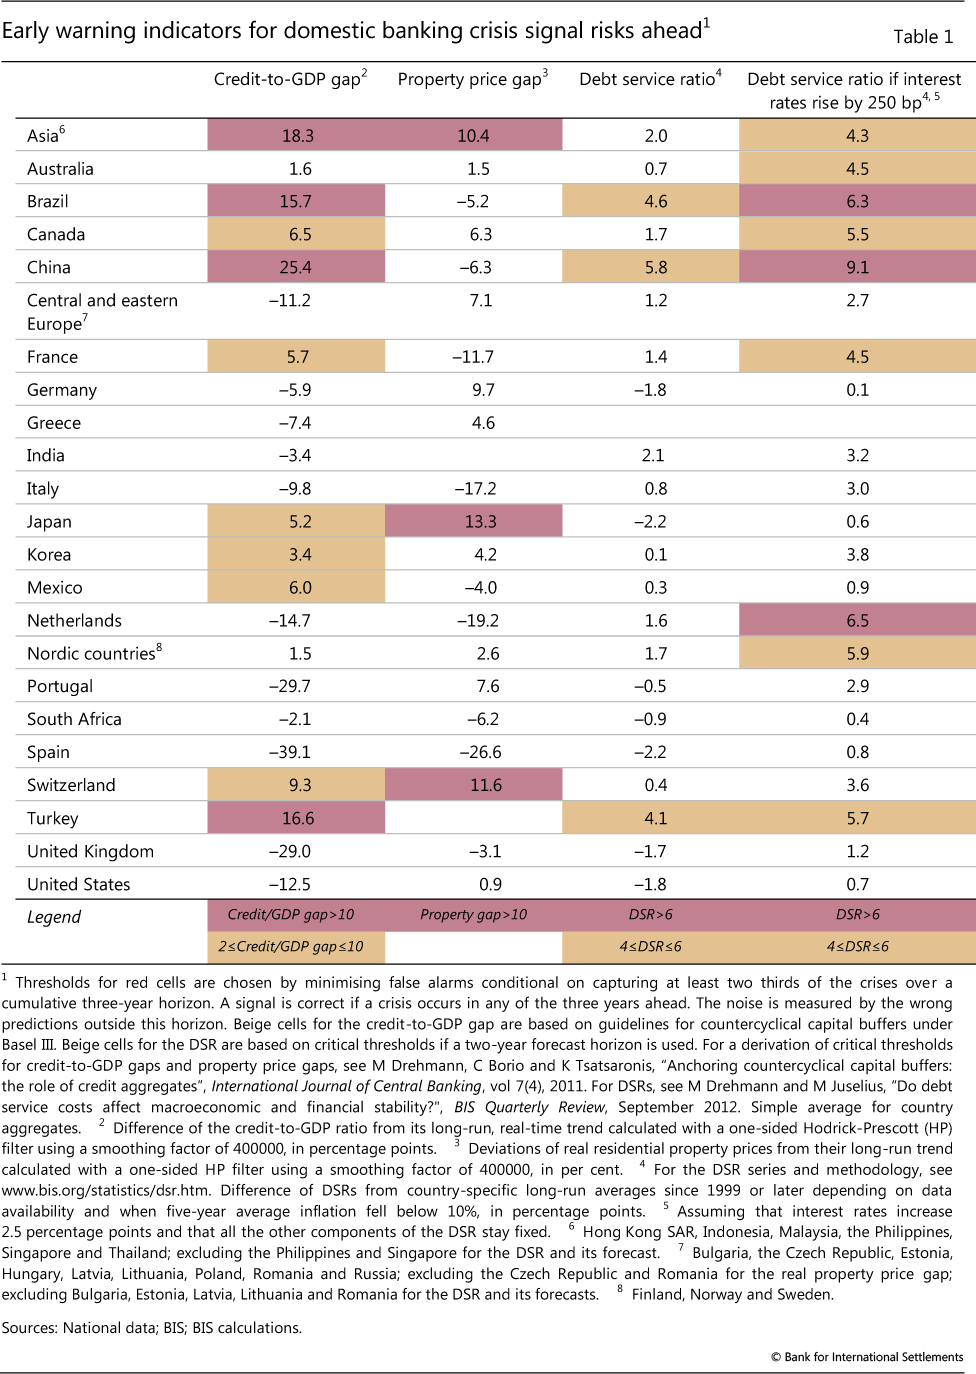
Early warning indicators of banking stress pointed to risks arising from strong credit growth (Table 1). Credit-to-GDP gaps - the deviation of private sector credit from its long-term trend - were well above 10% in Brazil and China. This ratio was also above 10% for a number of countries that are not listed separately in Table 1, including Indonesia, Singapore and Thailand (these countries are included in the "Asia" category in line 1 of Table 1). In the past, two thirds of all readings above this threshold were followed by serious banking strains in the subsequent three years.10
Estimated debt service ratios also pointed to continuing risks.11 True, despite rapid credit growth, low interest rates have kept DSRs around their long-term level in most countries. Even so, there were some notable exceptions: households and firms in Brazil, China and Turkey, for example, spent significantly more on servicing their debt than in the past. More generally, however, an increase in interest rates would push up DSRs in a number of EMEs, especially in Asia (Table 1, last column). It should be noted that the DSR impacts in Table 1 are "static" estimates - they assume an immediate pass-through of interest rate changes into DSRs, and do not take account of the ways in which borrowers and lenders would respond to interest rate movements by changing debt maturities, repaying their obligations or other measures.
1 This article was prepared by Ben Cohen (ben.cohen@bis.org) and Cathérine Koch (catherine.koch@bis.org). Statistical support was provided by Stephan Binder, Sebastian Goerlich, Branimir Gruić and Jeff Slee.
2 The LBS are structured according to the location of banking offices and capture the activity of all internationally active banking offices in the reporting country regardless of the nationality of the parent bank. Banks record their positions on an unconsolidated basis, including those vis-à-vis their own offices in other countries. International claims here include all BIS reporting banks' cross-border claims and local claims in foreign currency. For the latest enhancements to the BIS international banking statistics, see S Avdjiev, P McGuire and P Wooldridge, "Enhanced data to analyse international banking", BIS Quarterly Review, September 2015.
3 Annual percentage changes are calculated as the sum of exchange rate- and break-adjusted changes over the preceding four quarters divided by the amount outstanding one year earlier.
4 The BIS defines IDS as securities issued by non-residents in all markets. A debt security will be classified as IDS if any one of the following characteristics is different from the country of residence of the issuer: country where the security is registered, law governing the issue, or market where the issue is listed. See B Gruić and P Wooldridge, "Enhancements to the BIS debt securities statistics", BIS Quarterly Review, December 2012. The IDS feature a breakdown by both the nationality and residence of the issuer, along with further dimensions such as type, sector, currency and maturity, on a quarterly basis.
5 All figures on quarterly and annual changes in bank claims are corrected for exchange rate movements and breaks in series.
6 The CBS classify exposures according to the nationality of banks (ie according to the location of banks' headquarters), not according to the location of the office in which they are booked. Banks consolidate their inter-office positions and report only their claims on unrelated borrowers without providing a currency breakdown. As a consequence, exchange rate-adjusted changes are not available in the consolidated banking statistics. Claims are reported on an immediate counterparty basis (ie according to the location of the borrowing entity) and on an ultimate risk basis (according to where the ultimate debtor is headquartered, taking account of guarantees and other risk transfers).
7 This calculation corrects for the depreciation of the euro against the US dollar by assuming that all claims are denominated in euros.
8 The set of countries that constitute "emerging Europe" in the GLIs includes Ukraine but not Russia. The LBS definition of "emerging Europe" includes both countries. More details on cross-border positions vis-à-vis emerging Europe, including Russia, are provided below, drawn from the LBS.
9 The sectoral figures discussed here and presented in Graph 9 differ somewhat from those in Table 12 of the BIS Statistical Bulletin. This is because the figures in Graph 9 are based on the sector of the ultimate issuer (the parent company), while Table 12 refers to the immediate issuer (which could be a financing subsidiary of a non-financial company).
10 See M Drehmann, C Borio and K Tsatsaronis, "Anchoring countercyclical capital buffers: the role of credit aggregates", International Journal of Central Banking, vol 7(4), December 2011.
11 See M Drehmann, A Illes, M Juselius and M Santos, "How much income is used for debt payments? A new database for debt service ratios", BIS Quarterly Review, September 2015.