EME vulnerabilities take centre stage
Investors increasingly focused on growing vulnerabilities in emerging market economies (EMEs), particularly China, as they reassessed the global growth outlook. In China, equity markets plunged following a prolonged surge in stock prices that had propelled many stock valuations to extreme levels. This dented investor confidence and weighed on asset prices globally.
The Chinese authorities' decision in August to allow the renminbi to depreciate against the dollar gave markets a renewed jolt. The move intensified investors' concerns about growth prospects for China, EMEs more broadly and, ultimately, the global economy. As a result, a number of currencies came under further pressure, particularly in Asia. With Chinese equities resuming their plunge in the second half of August, risky assets sold off across the globe and implied volatilities spiked up across asset classes.
Amid extreme volatility, commodity prices, led by oil, resumed their downtrend after a brief hiatus in the second quarter of 2015. Perceptions of falling demand due to weakening economic activity in a range of EMEs most likely played a key role, although strong supply helped to undermine oil prices. In turn, falling commodity prices further hurt the growth outlook for commodity-producing EMEs. As a result, many commodity producers saw renewed depreciation of their exchange rates, which was exacerbated by another episode of dollar strengthening resulting from the US monetary policy outlook.
In government bond markets, yields edged back down after sharp increases in April and May, remaining at levels not far from the troughs reached in early 2015. This reflected a combination of unusually low, if not negative, term premia and expectations that interest rates would move up only slowly and moderately in coming years. Hedging behaviour on the part of insurers and pension funds, coupled with investors reaching for higher returns further out on the yield curve, added to the downward pressure on long- term yields.
Markets roiled as China jolts investors
Global financial markets have suffered repeated blows over the past few months, with a number of them due to events in China. On the heels of the Greek crisis, markets were roiled following a sharp drop in the Chinese equity market and a surprise change to the renminbi's exchange rate arrangements.
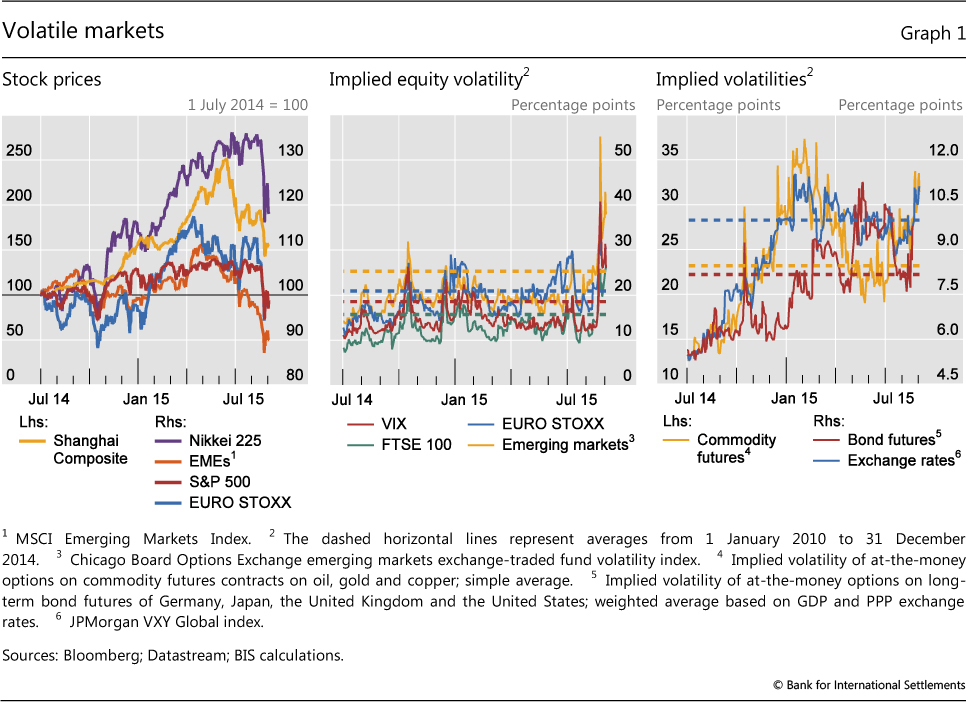
Markets, particularly in Europe, hit turbulence early in the quarter as negotiations about renewed funding for Greece dragged on. This was behind much of the underperformance of European equities, which caused the EURO STOXX index to fall by almost 11% between end-March and early July (Graph 1, left-hand panel).
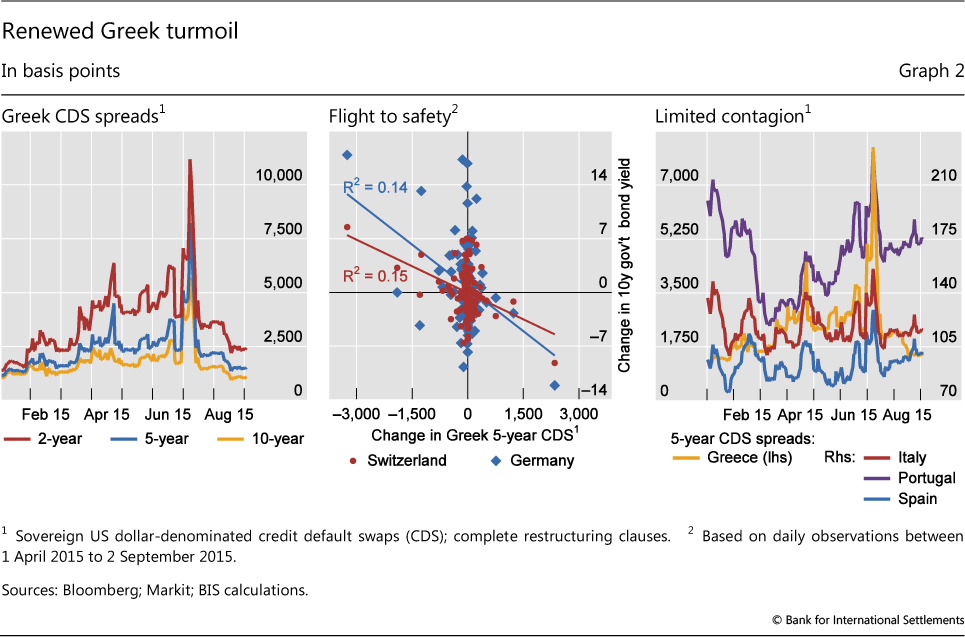
The drawn-out negotiations between Greece and its creditors through the first half of 2015 gradually undermined market sentiment. As the situation reached crisis proportions, with the banking system closed down and capital controls in place, two-year Greek sovereign credit default swap (CDS) spreads peaked above 10,000 basis points in early July, after voters rejected proposed reforms in a referendum (Graph 2, left-hand panel). Financial markets beyond Greece were also affected. In bond markets, there were clear signs of flight to safety as, for example, German and Swiss bond yields fell on days when Greek CDS widened the most and recovered on days when spreads tightened considerably (Graph 2, centre panel). Although the ongoing Greek crisis weighed on investor sentiment, the direct contagion to other periphery euro area sovereigns was limited and short-lived. Five-year sovereign CDS for Italy, Portugal and Spain, for instance, rose only by some 30-60 basis points in the course of the second quarter (Graph 2, right-hand panel). Eventually, as it became likely in early July that a new programme for Greece would be forthcoming, markets quickly recovered and investors started to turn their gaze elsewhere.
China's situation, in particular, received increasing market attention as the country's equities fell sharply in late June and early July. Following a spectacular surge lasting over a year, the benchmark Shanghai Shenzhen CSI 300 Index lost almost one third of its value between 12 June and 8 July (Graph 3, left-hand panel). The adjustment was even more dramatic for the Shenzhen Stock Exchange (SZSE) ChiNext small technology company index, which plunged by 40% over the same period.
The preceding run-up in Chinese equity prices was driven by increased trading activity and a build-up of leverage, which accelerated as the central bank eased monetary policy (Graph 3, centre panel). Combined daily turnover averaged CNY 1.8 trillion ($300 billion) in the month up to 12 June, around six times the 2014 average and exceeding that of the US stock market. This was fuelled by over 56 million new trading accounts opened predominantly by retail investors in the first half of 2015. Broker-intermediated margin trading reached CNY 2.2 trillion ($360 billion) in early June, an almost sixfold increase from the year before, representing approximately 8% of tradable market capitalisation. Increased leverage went hand in hand with rising valuations: the CSI 300 price/earnings ratio went up from 10 in mid-2014 to 21 in June 2015, while the P/E ratio on the ChiNext exchange peaked at 143 (Graph 3, left-hand panel). Turnover and leverage then plunged, reflecting new regulatory curbs and the rapid retreat of retail investors.
As concerns over Chinese equity market fundamentals persisted and authorities began scaling down their market-supporting measures, the volatility increasingly spilled over to other markets, especially in Asia. On 27 July, when the CSI 300 Index fell by 8.5% - its largest daily drop since 2007 - equity markets across Asia, and some commodity prices, suffered outsize drops (Graph 3, right-hand panel). In late July and early August, equity prices in China and elsewhere briefly stabilised.
This respite was short-lived. Concerns about China's growth outlook took centre stage as the People's Bank of China (PBoC) on 11 August announced major changes to its foreign exchange policy (see detailed discussion below). While the measures were officially described as a step towards a more market-oriented foreign exchange mechanism for the renminbi, the resulting depreciation was seen by some as a sign that Chinese growth was expected to weaken further. Currencies in the region and beyond depreciated sharply in response to the weakening of the Chinese currency. As price drops in commodity markets accelerated, investors grew increasingly concerned about growth prospects for EMEs more broadly, and the impact on the global economy.
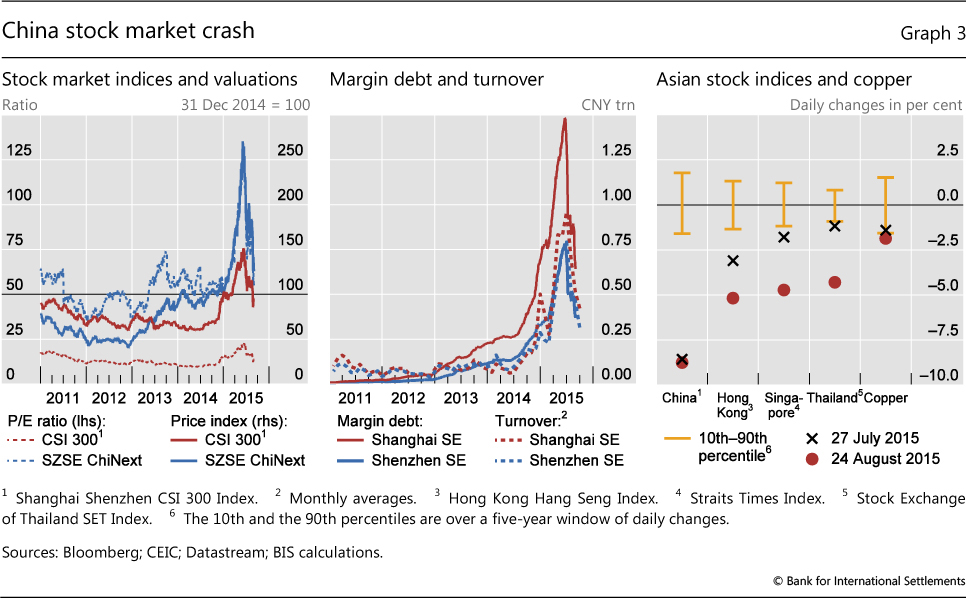
When Chinese equity prices began to fall sharply again in late August, global equity indices plummeted. Between 18 and 25 August, while Chinese equities slumped by another 21%, the world's major equity indices dropped by around 10% (Graph 1, left-hand panel). The S&P 500 Index closed 4% down on 24 August alone (a day when the CSI 300 Index fell by almost 9%; see Graph 3, right-hand panel), after a 6% slide during the day, amid intraday stock price drops of more than 20% for blue chips such as GE and JPMorgan Chase.
Against this backdrop, implied volatilities shot up: the VIX index surged to 40, its highest level since 2011, while EME implied equity volatility (VXEEM) rose the most on record (Graph 1, centre panel). Rising volatility was not confined to equities: commodity, bond and foreign exchange market volatility all spiked to levels much above post-crisis averages (Graph 1, right-hand panel).
By the start of September, the global equity market sell-off brought the Datastream world P/E ratio back down to just below its median value since 1987. Global P/E ratios had breached this median value in early 2015, after their upward trajectory since 2012.
Strong dollar and commodity plunge add to EME weakness
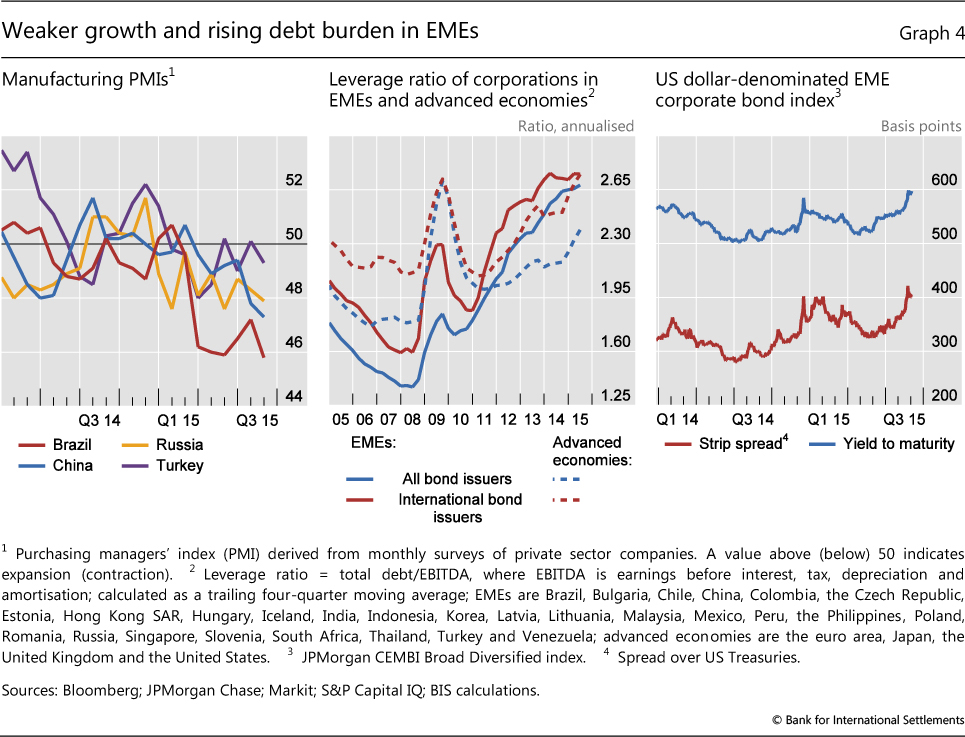
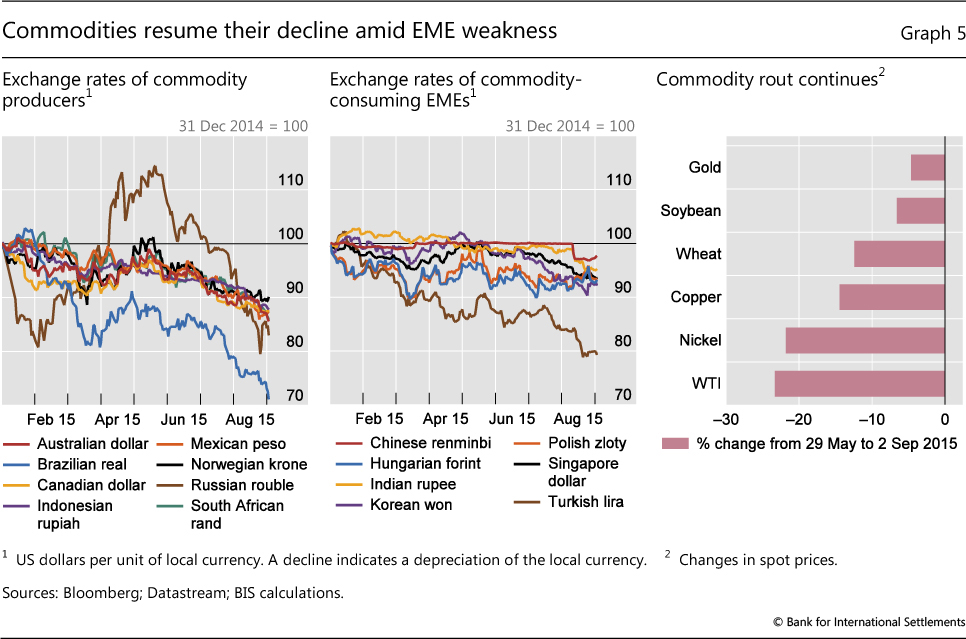
China's economic slowdown and the US dollar's appreciation have confronted EMEs with a double challenge: growth prospects have weakened, especially for commodity exporters, and the burden of dollar-denominated debt has risen in local currency terms. According to one indicator, China's private sector manufacturing activity contracted at its fastest pace in six years in August, while the purchasing managers' index (PMI) in Brazil, Russia and Turkey remained at or below 50 amid adverse country-specific developments (Graph 4, left-hand panel). In this environment, EME corporations, after ratcheting up their income-based leverage to the highest levels in a decade (Graph 4, centre panel), saw sharply rising credit spreads (Graph 4, right-hand panel). The depreciation against the US dollar of most EME currencies, including those of both commodity producers and consumers, added to the difficulty of servicing the dollar-denominated part of this debt (Graph 5, left-hand and centre panels).
After a brief but sizeable recovery in the second quarter of 2015, the prices of most commodities continued their plunge (Graph 5, right-hand panel), putting additional pressure on commodity producers' exchange rates. Perceptions of weaker global demand due to the fall in China's investment growth and, in the case of oil, persistently high supply played a key role.
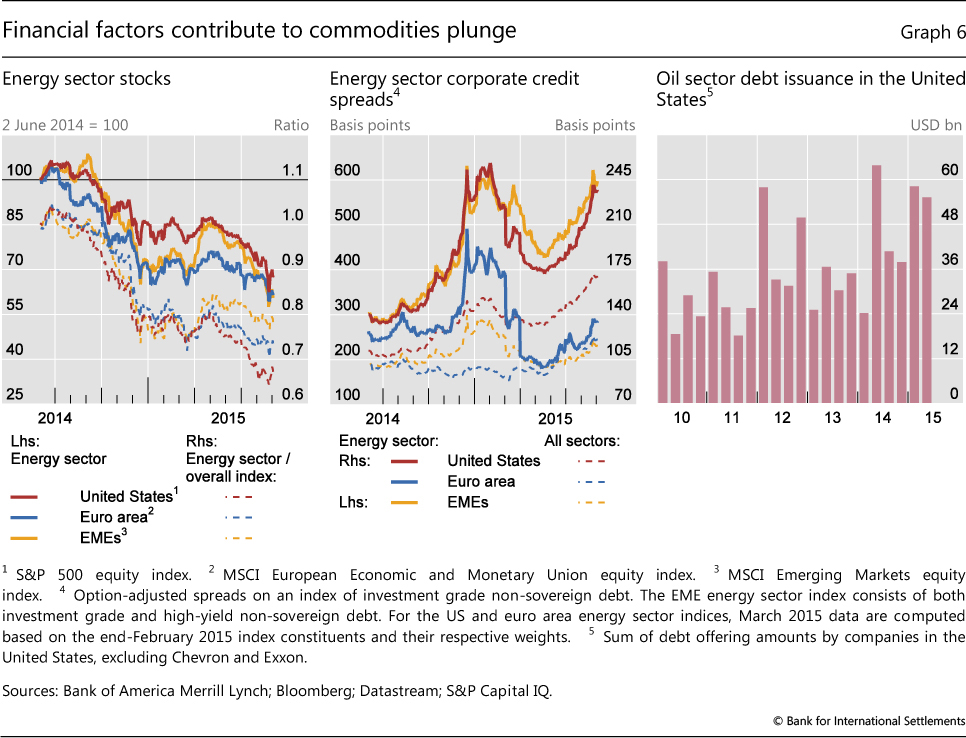
Financial factors, too, may have contributed to the commodity plunge. The fall in the dollar oil price can be partly explained by the appreciation of the US dollar, which in the absence of such a decline makes oil more expensive outside the United States. Despite falling stock prices and rising borrowing costs (Graph 6, left-hand and centre panels), the US energy sector stepped up its debt issuance, possibly in an effort to defend market share (Graph 6, right-hand panel). High debt burdens may force these firms to keep up their production simply to generate the cash flow they need to service their debt, accentuating the downward pressure on oil prices.
Against this backdrop, a number of emerging market economy and commodity-exporting advanced economy central banks eased monetary policy, including those of China, Hungary, India, Korea, Russia and Thailand as well as Australia, Canada, New Zealand and Norway. In Brazil, where a recession coincided with rising inflation and political tensions, the central bank increased its key policy rate from 12.75% in early March to 14.25%, citing above-target inflation as its primary concern, but signalled a pause in further tightening.
As emerging market currencies sagged against the dollar, the PBoC on 11 August announced major changes to its foreign exchange policy. The renminbi would continue to trade against the US dollar in a ±2% daily band, but the central parity around which the band is set would be determined by the previous day's closing market rate rather than a preset target rate. This more market-oriented mechanism is a step towards fulfilling the criteria for the renminbi's inclusion in the IMF's SDR basket ahead of its review in late 2015.
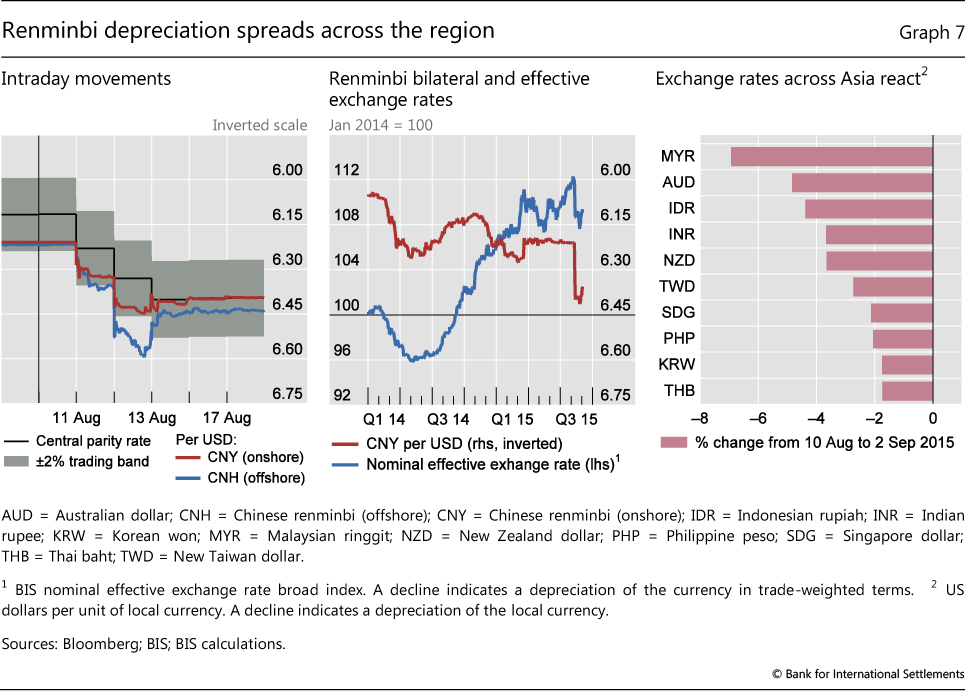
This change led to further ructions in the foreign exchange markets. The renminbi slipped by 2.8% against the US dollar in the two days after the surprise announcement, before stabilising when the PBoC intervened to support the currency (Graph 7, left-hand panel). From the start of 2015 up to the introduction of the new fixing method, the renminbi had traded consistently towards the weaker end of the trading band, pointing to some depreciation pressures as the stable bilateral exchange rate against the US dollar led to a sizeable renminbi appreciation in trade-weighted terms (Graph 7, centre panel). Emerging Asia currencies reacted strongly, with the Malaysian ringgit depreciating by more than 6% since the announcement (Graph 7, right-hand panel). On 20 August, Kazakhstan, a commodity exporter whose main trading partners are Russia and China, announced that it would let its currency trade freely; the Kazakhstan tenge immediately lost more than a fifth of its value against the US dollar.
Diverging monetary policies continue to drive markets
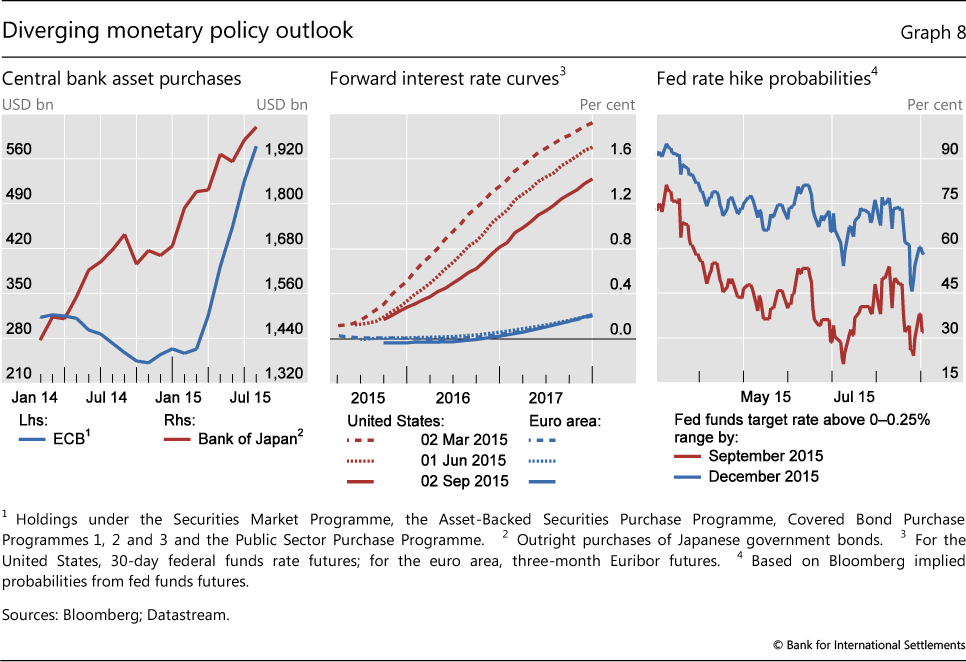
Diverging monetary policies have continued to be an important driver for markets over the past few months. With policy rates close to zero, the Bank of Japan and the ECB continued their respective asset purchase programmes, seeking to stimulate economic activity and lift inflation closer to target (Graph 8, left-hand panel). At the same time, the US Federal Reserve and the Bank of England continued to prepare market participants for an eventual increase in their policy rates.
In particular, the Federal Reserve's efforts in this direction have been ongoing for some time, thus keeping US forward interest rates persistently above those in the euro area and elsewhere (Graph 8, centre panel). But macroeconomic upsets and bouts of market turbulence have prompted investors to scale back their expectations for near-term rate hikes. For example, whereas prices of federal funds futures contracts at the beginning of 2015 implied an 80% probability that the target rate would have been raised by September, and a 90% probability that it would have happened by December, these probabilities had fallen to around 32% and 58%, respectively, by 2 September (Graph 8, right-hand panel). These estimated probabilities dropped sharply twice during the quarter. On 8 July, they fell to 21% and 54%, respectively, shortly after the Greek referendum and on a day when the Shanghai equity index plummeted by 6%. After recovering in subsequent weeks, they again slid in late August following the extreme turbulence in global equity markets.
Although the timing of the Federal Reserve's first move has become more uncertain, interest rate differentials between the United States and many other countries have remained wide, with important consequences for foreign exchange markets. In particular, except for a brief hiatus in the second quarter of 2015, the US dollar has been on an appreciating trend since mid-2014. The influence of interest rate differentials on the dollar was particularly stark with regard to the euro: as the difference between US and core euro area interest rates began to widen again in the third quarter of 2015, the dollar resumed its strengthening path against the euro (Graph 9, left-hand panel). Towards the end of the period, as US short-term rates edged down, the euro recovered somewhat.
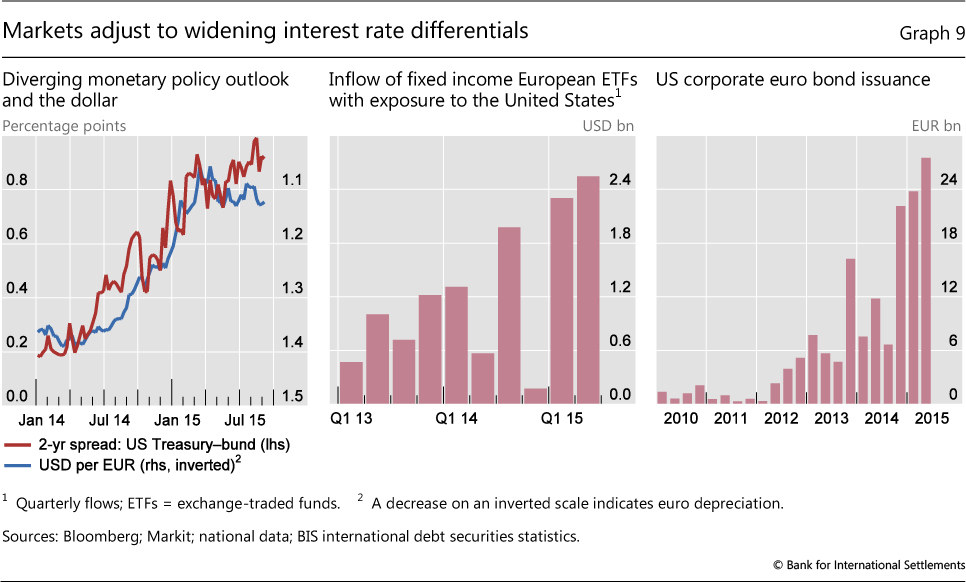
Interest rate differentials also affected the behaviour of investors and borrowers. With interest rates at or near record lows in the euro area, fixed income investors increasingly turned to higher-yielding dollar assets. For example, flows into European exchange-traded funds linked to US bonds surged. In the first half of this year, such flows amounted to $4.8 billion, as compared with $4.0 billion in the entire year of 2014 and $3.4 billion in 2013 (Graph 9, centre panel). For their part, firms in the United States increasingly issued euro-denominated debt to benefit from the low borrowing costs. In the second quarter of 2015, total gross issuance of euro-denominated debt by US non-financial corporations amounted to €30 billion, surpassing even the brisk issuance of the previous two quarters (Graph 9, right-hand panel; see also "Highlights of global financing flows", BIS Quarterly Review, September 2015). With ongoing ECB asset purchases weighing on the yields of core euro area government debt, yield-starved European investors have welcomed the rising supply of corporate debt.
Bond yields stuck at low levels
Long-term government bond yields in advanced economies edged lower to levels not far from the troughs reached early in the year, following sharp but brief increases in the second quarter. The yield on 10-year German government bonds, which peaked at just below 1% in early June 2015, had eased back to around 80 basis points by the beginning of September (Graph 10, first panel; see also Box 1 for a discussion of recent developments in the German bond market). US 10-year Treasury yields similarly eased from around 2.5% to 2.2% over the same period.
Box 1
Volatility and evaporating liquidity during the bund tantrum
Ryan Riordan and Andreas Schrimpf
Volatility in German bond markets spiked during May-June 2015 (Graph A, top left-hand panel). Historical volatility, computed from daily maximum and minimum prices, was higher in June 2015 than during any other period over the past four years. Intraday volatility measures indicate even higher stress levels (Graph A, top right-hand panel). Bonds with very long maturities showed the highest intraday volatility, while bonds of shorter maturities were also affected, but to a lesser extent.
 Intraday data are taken from the Euro-MTS inter-dealer platform, the main wholesale electronic trading venue for German government bonds.
The "bund tantrum", as some have termed the spike in German bond volatility on 7 May 2015, is especially puzzling. Yields on long-term bonds surged 21 basis points intraday, peaking at 80 basis points, but ended the day where they had been at the previous day's close, at 59 basis points. While the dynamics differed, such large intraday moves bore some resemblance to the US Treasury "flash rally" on 15 October 2014, during which yields suddenly fell by nearly 30 basis points before recovering by the close of trading. Unlike the 3 June spike in bund yields, which followed the release of an ECB statement on the euro area economic outlook and led to a repricing of inflation expectations, the market break on 7 May does not appear to have been related to the release of any particular information. One trigger factor might have been an unwinding of positions by leveraged directional investors in fixed income derivatives markets. In anticipation of the ECB's asset purchase programme, trades speculating on a continued decline in rates had become relatively crowded, according to some reports. In such circumstances, even minor news might have sufficed to turn the market's direction.
A common explanation for why prices in fixed income markets have become so volatile is that market liquidity has deteriorated. Indeed, measures of market liquidity computed using firm prices that are immediately executable support the conjecture that strained market liquidity conditions are at least partly to blame for the increased volatility.
 The cost of immediately executable transactions in the bund market increased in the period around the bund tantrum. The increase in the bid-ask spread (Graph A, bottom left-hand panel), defined as the difference between the best available buy price (bid) and the best available sale price (offer) and expressed in basis points relative to the mid-quote, shows the increase in round-trip execution costs for small trades. Ultra-long-term bonds (those with more than 12½ years' remaining maturity) exhibited the worst deterioration in bid-ask spreads, with a near doubling in the relative bid-ask spread from 40 to roughly 80 basis points. A second spike coincided with the ECB's monetary policy press release on 3 June 2015. Some widening in bid-ask spreads around the release of pricing-relevant information is expected, as intermediaries widen quoted prices to reflect the increased risk that the market will move against them.
A more informative liquidity measure in this market is order book depth (Graph A, bottom right-hand panel), which also showed signs of deterioration over the period. Order book depth is defined as the total volume available for immediate transaction at the best available bid and offer prices. Lower order book depth means that even small increases in trading volume can lead to large price swings. Over the first half of 2015, depth in the order book of German bunds was low and fragile, which can potentially amplify price movements. The most striking decline was in the depth available in ultra-long-term bonds. Immediately executable depth fell by more than a third over the six-month period, from €25 million to roughly €16 million. Less depth makes it difficult to execute larger trades without moving prices; large trades may then lead to volatility spikes similar to those of May-June 2015.
A variety of factors may stand behind the overall decrease in market liquidity for German bonds. As part of a longer-term trend, liquidity has declined as intermediaries scale down their inventory holdings of fixed income assets (see eg Committee on the Global Financial System, "Market-making and proprietary trading: industry trends, drivers and policy implications", CGFS Papers, no 52, November 2014). Some observers have also suggested that the ECB's Public Sector Purchase Programme (PSPP) in early 2015 may have further reduced the supply of tradable German bonds, which had already been fairly strained due to low issuance volumes in primary markets. As of 30 June, the ECB had purchased €46.3 billion of German bonds, representing roughly 6% of total German PSPP-eligible securities. This, in turn, reduced the availability of bonds for trading by intermediaries.
 In particular, the depth available in German bond markets appears to have fallen around the time of the announcement, and it continued to fall at and after the start of the PSPP. However, the effects were most pronounced, and appear to be permanent, in bonds of very long-term maturity. As the ECB's PSPP did not buy large amounts of these securities, other factors such as the limited risk-bearing capacity of intermediaries may also have contributed to the decline.
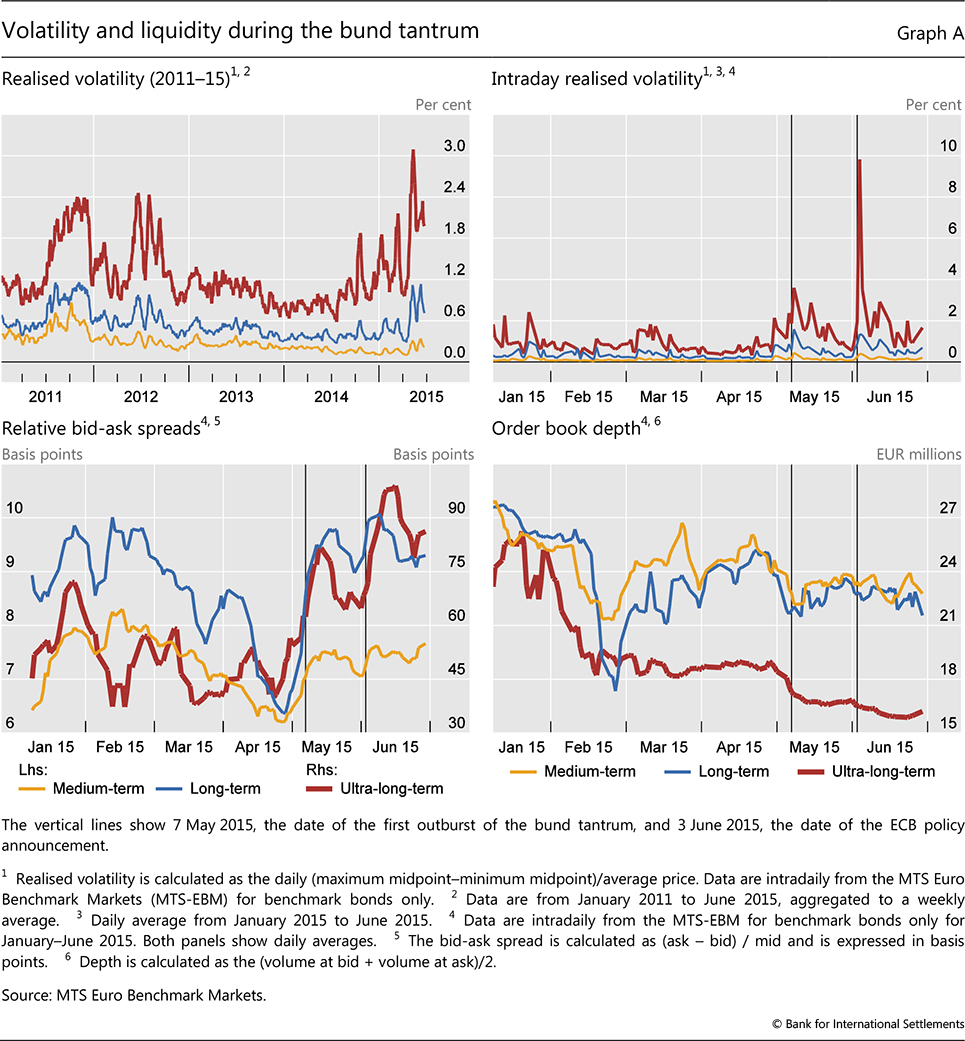
Indicators are constructed from submitted limit orders for benchmark bonds during normal trading hours (8:00-17:30). Bonds with a remaining maturity from 2.5 to 7.5 years are classified as medium-term, those >7.5 to <= 12.5 years as long-term, and those >12.5 years as ultra-long-term bonds. Market liquidity generally refers to the ease with which a security can be bought or sold without affecting the asset's price. This differs from funding liquidity, which refers to the ease with which investors can obtain funding for a position in a risky asset (see M Brunnermeier and L Pedersen, "Market liquidity and funding liquidity", Review of Financial Studies, no 22(6), 2009, pp 2201-38). The two measures of liquidity discussed here, the bid-ask spread and order book depth at the best bid and ask, are directly measurable in our data and are continuously available throughout the trading day. They are representative of realisable liquidity in the overall market. On 22 January 2015, the ECB unveiled its programme for public sector asset purchases (PSPP), amounting to purchases worth roughly €60 billion per month between 9 March and at least September 2016. The weighted average remaining maturity of German bonds held by the ECB in the PSPP is roughly 6.78 years; see www.ecb.europa.eu/mopo/implemen t/omt/html/index.en.html.
The persistence of very low bond yields largely reflected unusually low term premia. The influence of low premia was particularly stark for euro area bonds. Since the culmination of the financial crisis, estimated term premia on 10-year core euro area government bonds gradually fell from above 100 basis points to around zero at the beginning of 2014 (Graph 10, second panel). Since then, a prolonged slide in premia pulled yields down close to zero in the second quarter of 2015, before both premia and yields recovered somewhat. This large downward move in euro area term premia coincided with growing expectations for, and ultimately the implementation of, the ECB extended asset purchase programme (Box 2 also discusses the additional market effects associated with this programme). The sharper drop in euro area term premia than in US premia explains much of the widening gap between long-term bond yields in the two economies.
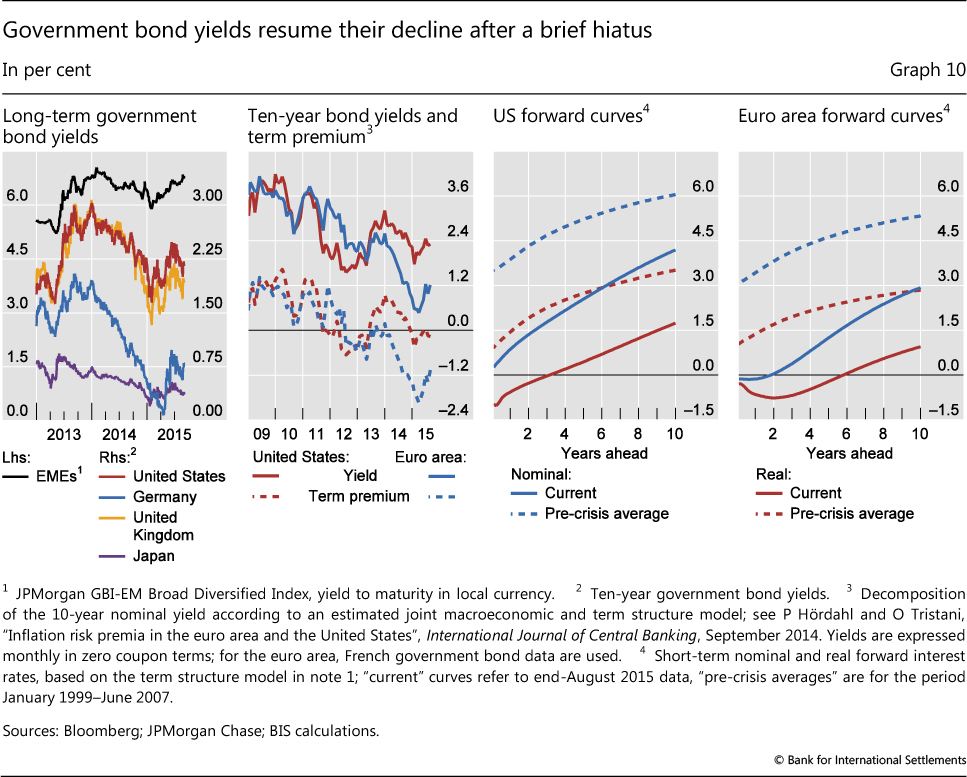
Implied forward interest rate curves also show that much of the current low-yield environment is the result of very low real forward interest rates (Graph 10, third and fourth panels). Real forward rates rise only very slowly, entering positive territory only at horizons three years ahead for the United States, and six years ahead for the euro area. Moreover, even at 10 years ahead, real forward rates reach levels considerably below those seen prior to the financial crisis, accounting for almost all of the similarly large gap between current and pre-crisis nominal forward rates.
The behaviour of institutional investors may have played a role in explaining such unusually low yields. For example, as yields have come down, the duration of pension funds' and insurance companies' liabilities have lengthened, forcing them to step up their hedging activities. This has increased demand for long-term swaps, adding to the downward pressure on yields. Such self-reinforcing effects are likely to have been amplified in an environment where central banks continue to exert great demand for bonds, and where investors have persistently sought higher returns in longer-dated bonds.
Box 2
Dislocated markets
Over the past year, asset prices in some markets have persistently deviated from levels that would be consistent with the absence of arbitrage opportunities. Such distortions can occur when scarce funding or limited balance sheet capacity prevents investors from taking advantage of the resulting trading opportunities. This is often the case during financial crises. More recently, reduced market liquidity and central bank actions may have played a role. This box examines three prominent examples of dislocations.
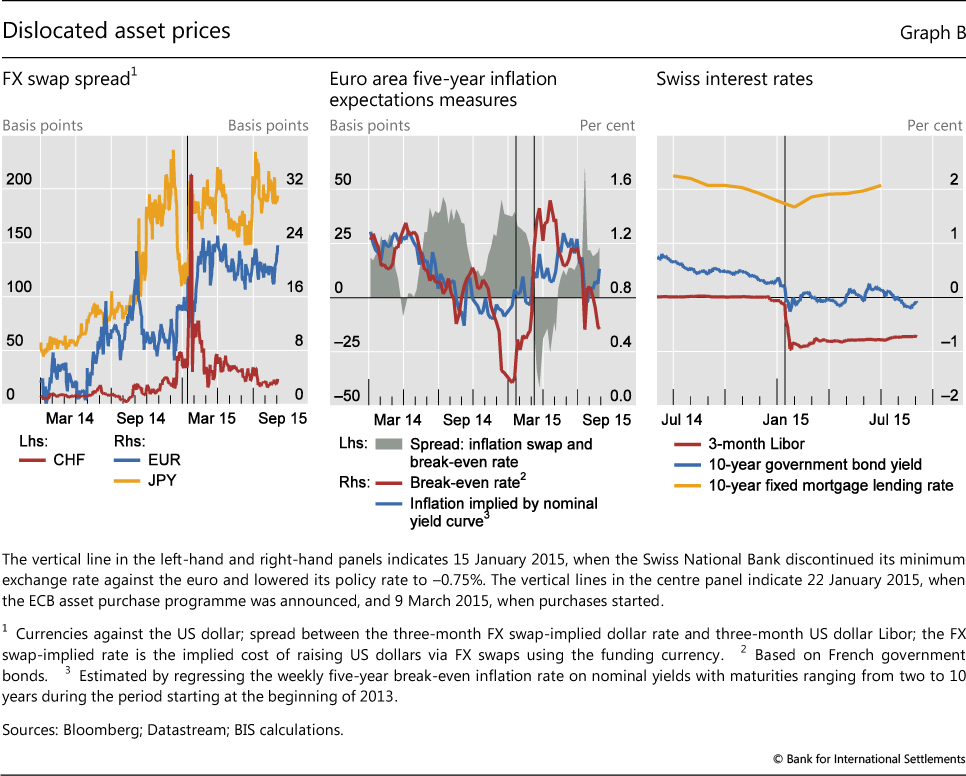
Deviations from covered interest parity, which in the textbook view should normally be eliminated through riskless arbitrage, have been trending up for major currency pairs. The deviations were especially high for the Swiss franc after the Swiss National Bank discontinued its minimum exchange rate against the euro (Graph B, left-hand panel). Covered interest parity implies, among other things, that FX forward discount rates embedded in the price of FX swaps should be equal to the interest rate differentials between the currencies involved in the swap. Differences between money market rates and interest rates embedded in FX swaps often signal funding difficulties in one of the currencies. For instance, as unsecured US dollar funding markets became increasingly dysfunctional during the financial crisis, foreign banks with large dollar funding requirements increasingly turned to the FX swap market to obtain dollar funding, which in turn pushed FX swap-implied dollar interest rates far above dollar Libor rates.
The more recent spread widening between dollar interest rates derived from the FX swap market and those in the Libor market has also tended to favour the swap counterparty supplying dollars. However, this has probably reflected derivatives market imbalances, rather than funding difficulties of the kind seen during the height of the crisis. On the demand side, institutions such as non-US pension funds and insurance companies, which have large dollar asset positions but liabilities that are predominantly denominated in the local currency, may have ramped up their holdings of dollar bonds and their hedging activities. Such increased hedging needs may be linked to the recent increase in FX volatility (Graph 1, right-hand panel). On the supply side, financial intermediaries' ability to supply hedging instruments such as FX swaps has remained subdued, as they have significantly reduced their leverage since the financial crisis. As a result, they have been willing to devote balance sheet space in order to meet the increased demand for dollar swaps only in return for a considerable premium.
Such demand imbalances in FX swap markets have been reinforced as borrowers have reacted to changes in funding costs for dollars vis-à-vis other currencies. As major central banks outside the United States have ramped up their unconventional easing efforts, funding conditions have loosened considerably in key foreign currencies. As a result, US corporations have increasingly been issuing debt in foreign currency, including the euro (Graph 9, right-hand panel), and this may have further increased the demand for swapping into dollars.
Another dislocated market segment was that of inflation-linked bonds. Large gyrations in euro area break-even inflation rates (that is, inflation rates that would make the overall return on an inflation-linked bond equal to that of a comparable nominal bond) have highlighted the importance of liquidity premia for index- linked instruments. Because the nominal yield curve contains information about inflation expectations and risk premia, nominal interest rates can be used to track the variation in break-even inflation. The close relationship between the two broke down from the end of 2014 (Graph B, centre panel), as five-year break-even rates derived from inflation- linked bonds implied significantly lower inflation than the measure based on nominal yields only. This coincided with a fall in index-linked bond turnover reported by debt management agencies, suggesting that rising liquidity premia in index-linked bonds had driven their yields up and therefore pushed down measured break-even inflation rates. When the ECB announced and started implementing its expanded asset purchase programme, which explicitly included index-linked bonds, break-even inflation rates recovered sharply, possibly overshooting. The ECB actions therefore appear to have been perceived as significantly reducing illiquidity in the index-linked market segment, thus sharply reducing the liquidity premia required by investors. This suggests that variations in liquidity premia rather than shifts in inflation expectations were a key driver of euro area break- even inflation rates during this episode (Box 1 further discusses bond market liquidity developments, focusing on German government bond markets).
The negative policy rates introduced by several European central banks in 2014 and 2015 have also created distortions in some market segments, in particular when non-bank players have been involved. Across the affected countries, banks have so far been reluctant to pass on negative rates to retail depositors. This has exposed them to higher funding costs and additional interest rate risk. Swiss evidence suggests that banks have factored the lost revenue and hedging costs into the pricing of new mortgages, which led to an increase in the 10-year Swiss fixed mortgage rate, even as money market rates moved deeper into negative territory and government bond yields fell (Graph B, right-hand panel).
See eg N Baba and F Packer, "From turmoil to crisis: dislocations in the FX swap market before and after the failure of Lehman Brothers", Journal of International Money and Finance, no 28(8), 2009, pp 1350-74.