Volatility concepts and the risk premium
(Extract from pages 10-11 of BIS Quarterly Review, September 2014)
Financial volatility is a measure of the variability of asset prices (or asset returns) over time. As it is a multifaceted concept, several different volatility measures are used in practice. These fall into two broad categories: statistical volatility (ie the volatility of the actual return distribution) and implied volatility (ie the volatility of the returns implied in option prices).
Statistical measures of volatility are based on observed asset returns over a given time interval. This can be done in various ways. A simple, model-free approach is to compute the standard deviation of the actual returns on a given asset over a particular time window, so-called realised (or "historical") volatility. Model-based approaches have also been proposed: ARCH (autoregressive conditional heteroscedasticity) models, for example, assume that the variance of returns fluctuates over time according to a specific time series model.
Implied volatility, by contrast, is derived using option prices. It thus embeds information about market participants' expectations of future movements in the price of the underlying asset as well as their appetite for holding that risk. The best known example is the volatility index (VIX), a model-free measure of implied volatility on the S&P 500. The VIX is constructed using option premia from a wide array of calls and puts, with a maturity of 30 days and a broad range of strike prices.
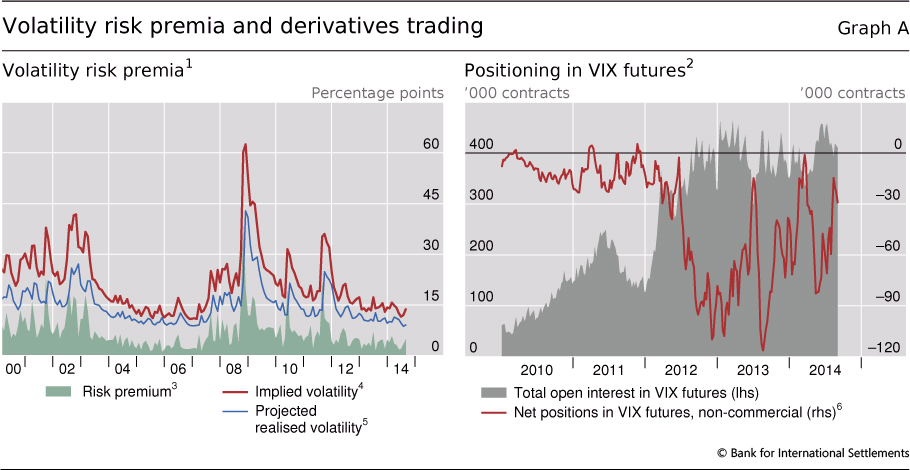
By comparing measures of implied and statistical volatility, researchers and practitioners can infer the volatility risk premium. This premium can be thought of as the compensation demanded by investors for bearing risk related to sharp changes in market volatility. To isolate this premium, researchers often compare implied volatility (eg measured by the VIX) with a projection of realised volatility over the same horizon. For instance, Bekaert et al (2013; see Graph A, footnote 3) propose a simple approach to estimate expected realised volatility over a one-month horizon, and suggest that the difference between implied and projected realised volatility can be interpreted as a proxy for investors' attitude towards risk. The red and blue lines in the left-hand panel of Graph A depict, respectively, the implied and projected realised volatility, and the green shaded area corresponds to the gauge of time-varying risk aversion. When volatility spikes in stress episodes, investors' attitude towards risk usually follows, as investors are less willing to hold positions in risky assets or to provide insurance against sharp asset price changes. More interestingly, estimates of the volatility risk premium have dropped quite substantially since mid-2012, and now stand at close to pre-crisis levels.
A well known empirical regularity is that volatility tends to be negatively correlated with current and past asset returns. In other words, volatility tends to be much higher when asset prices drop than when markets rally. The traditional interpretation of this asymmetric relationship is the so-called leverage effect. According to this explanation, a fall in equity prices would generally imply a rise in firms' leverage, and in turn raise the riskiness of a given stock. An alternative explanation relates the negative correlation to changes in attitudes towards risk: since low volatility is associated with increased willingness to take on risk, a low-volatility environment is likely to be accompanied by rising asset valuations.
Recent economic theory emphasises the endogenous nature of volatility. A prolonged period of low volatility could paradoxically lead to a build-up in risk.
 One key mechanism relates to the effect of changes in volatility on measures such as value-at risk (VaR) or Sharpe ratios, extensively used to inform risk-taking and risk management by financial intermediaries. For a given VaR threshold, lower volatility increases the fraction of the portfolio that a financial institution can hold in risky assets. Similarly, for a given portfolio composition and amount of capital, lower volatility can also encourage the build-up of leverage to finance a larger asset portfolio. A second potential source for a build-up in risk in a low-volatility environment is crowded investment behaviour by asset managers and similar types of non-bank players.
 Expectations of the continuation of benign financial conditions and low volatility may encourage these market participants to build up large positions in riskier asset classes, which further compresses risk premia.
There are also signs of intensified speculative activity on volatility. As shown in Graph A, the size of net short positions on VIX futures held by non-commercial traders (eg hedge funds) - ie bets that volatility is going to stay low - has been increasing sharply on the back of low volatility since mid-2012. The graph also suggests that traders were quick to scale back such short positions during the taper tantrum episode in mid-2013, during the market turbulence of early 2014, and most recently during the market hiccup of late July to early August 2014.
If one has access to high-frequency financial data (eg five-minute returns), realised volatility has been shown to be a highly accurate estimator of the diffusion component of the stochastic process driving the evolution of the price of the asset (Anderson et al (2003), op cit). The pricing of options is based on the principle of no arbitrage. To make this operational, the evolution of the asset on which the option is written has to be cast in a "risk-neutral" framework, in which the transition probabilities governing the evolution of the price of the underlying asset are adjusted for investors' attitude towards risk. In this sense, these "risk-neutral" probabilities differ from the "physical" probabilities governing the evolution of observed returns on the underlying asset. See R Engle, "Autoregressive conditional heteroscedasticity with estimates of the variance of United Kingdom inflation", Econometrica, vol 50, 1982, pp 987-1007. Recent work also stresses the possibility that implied volatility may partly reflect the risk-bearing capacity of dealers acting as intermediaries in option markets (eg N Gârleanu, L Pedersen and A Poteshman, "Demand-based option pricing", Review of Financial Studies, vol 22, 2009, pp 4259-99). Some market participants use the term "risk appetite" to characterise investors' attitudes towards risk. The term "risk aversion" is more technical, and is related by some to innate agents' preferences. See F Black, "Studies of stock price volatility changes", Proceedings of the 1976 Meetings of the American Statistical Association, Business and Economic Statistics Section, 1976, pp 177-81. This interpretation of the observed negative correlation between volatility and asset returns was first put forth by R Pindyck, "Risk, inflation and the stock market", American Economic Review, vol 74, 1984, pp 335-51. See eg H S Shin, Risk and liquidity, Oxford University Press, 2010; and T Adrian and N Boyarchenko, "Intermediary leverage cycles and financial stability", Federal Reserve Bank of New York, Staff Reports, no 576, August 2012. This has been labelled, inter alia, the "financial instability paradox" or also "volatility paradox"; see C Borio and M Drehmann, "Towards an operational framework for financial stability: 'fuzzy' measurement and its consequences", BIS Working Papers, no 284, June 2009; and M Brunnermeier and Y Sannikov, "A macroeconomic model with a financial sector", American Economic Review, vol 104, no 2, 2014. See K Miyajima and I Shim, "Asset managers in emerging market economies", BIS Quarterly Review, September 2014, pp 19-34.