Non-deliverable forwards: 2013 and beyond
Non-deliverable forwards (NDFs) allow investors and borrowers to take positions in currencies that are subject to official controls. Turnover in NDFs has risen in recent years as non-residents use them to hedge increasing investment in local currency bonds. Pricing in deliverable forward and NDF markets is segmented, with NDFs leading in times of strain. Experience shows that NDF markets tend to fade away gradually after liberalisation. But, looking ahead, market centralisation might reduce the costs of maintaining them. In a unique development, offshore deliverable renminbi forwards are gaining on the established NDF.1
JEL classification: F31, G15, G18.
Non-deliverable forwards (NDFs) are contracts for the difference between an exchange rate agreed months before and the actual spot rate at maturity. The spot rate at maturity is taken as the officially announced domestic rate or a market-determined rate. The contract is settled with a single US dollar payment. Thus NDFs yield payoffs related to a currency's performance without providing and requiring funding in the underlying currencies as do deliverable forwards.
NDFs trade principally outside the borders of the currency's home jurisdiction ("offshore"). This enables investors to circumvent restrictions on trading in the home market ("onshore") and limits on delivery of the home currency offshore. Market participants include direct and portfolio investors wishing to hedge currency risk and speculators (Ma et al (2004)). Banks and firms with onshore and offshore operations arbitrage, and thereby reduce, differences in forward rates. In recent years the growing importance of non-resident investors in local currency bond markets has increased the salience of NDF markets, particularly in times of strain.
This special feature provides answers to three questions. First, how big was the NDF market in 2013, and what can be said about its growth? Second, how does pricing of NDFs differ from that of onshore deliverable forwards, and where are prices discovered, especially in stressed markets? And third, how might NDFs evolve?
In 2013, the BIS Triennial Central Bank Survey showed that NDFs constitute only a fifth of the global foreign exchange market in outright forwards and a tiny fraction of overall foreign exchange trading. For the separately identified NDFs, however, dollar NDFs represent three quarters of all dollar forwards in the six currencies detailed by the survey. Data from the Bank of England on London trading, from the Depository Trust & Clearing Corporation (DTCC) and from an electronic broker show that the market for NDFs grew rapidly from April 2008 to April 2013, but its development since April 2013 is less clear.
By analysing the relationship between the prices of NDFs and deliverable forwards, the feature finds that the segmentation between deliverable forwards and NDFs is evident in deviations from the law of one price. The NDF market tends to lead the domestic market, especially in stressed periods.
Looking forward, we chart two paths for the evolution of NDFs. With capital account opening, offshore and onshore markets can merge. But this seems to take time. There is also a different path, taken by the Korean won. Its deliverable and non-deliverable markets persist in parallel even as arbitrage joins them and markets deepen. The Chinese renminbi's recent internationalisation follows neither path and the offshore deliverable renminbi is outcompeting the NDF.
How big is the NDF market and how fast is it growing?
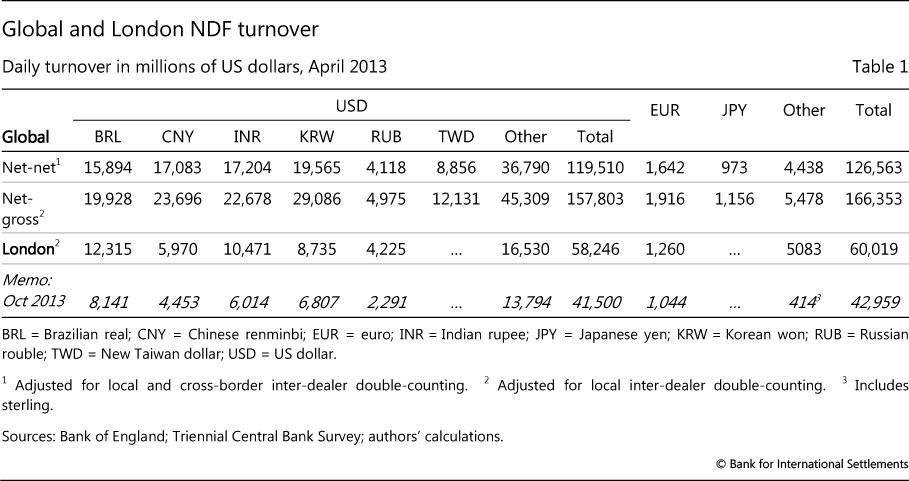
The latest Triennial Survey reported $127 billion in daily NDF turnover (Table 1). This represented 19% of all forward trading globally and 2.4% of all currency turnover. Almost two thirds took place in six currencies against the dollar, for which the survey obtained detail. Like forward markets and emerging market currencies in general, a very high share of NDF trading (94%) takes place against the dollar.
Data published by the London Foreign Exchange Joint Standing Committee show that London accounts for 36% of NDF trading.2 Asian centres are especially important for NDFs in the renminbi (Ehlers and Packer (2013)) and, to a lesser extent, the Korean won.
The relationship between location and deliverability
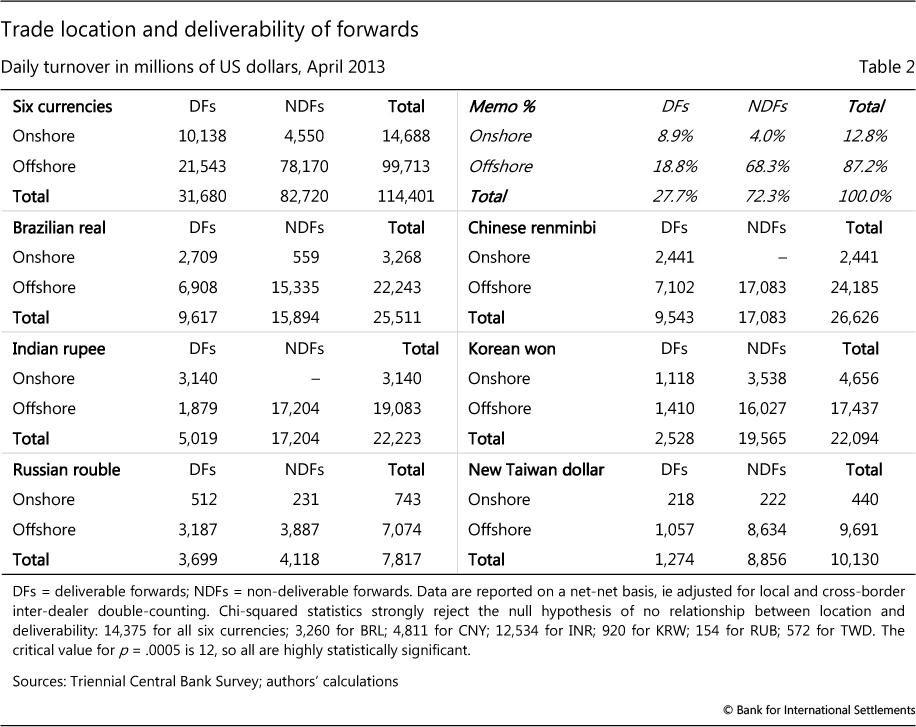
Onshore trading is concentrated in deliverable forwards and offshore trading is specialised in NDFs. As shown in the top section of Table 2, NDF trading represents 72% of all forward trading in the featured currency pairs, and offshore trading 87%. Based on these observations, one would expect 62% of forward trading to occur in NDFs offshore (72% * 87% = 62%). In fact, the percentage is even higher, 68%. Correspondingly, there is more onshore deliverable trading than one would expect. Indeed, the chi-squared test strongly rejects the independence of trading and deliverability, confirming the concentration of deliverable forwards onshore and NDFs offshore.
The remaining sections of Table 2 make clear that the strength of the relationship varies across the six currency pairs (though it is highly statistically significant in all cases). Segmentation is strongest in the Indian rupee, followed by the renminbi,3 the Brazilian real, the Korean won, the New Taiwan dollar and finally the Russian rouble.
The strength of this relationship testifies to the robustness of the controls separating the onshore and offshore markets. In India, the sense that NDF activity strongly affected the domestic market in August 2013 has led to discussion of how to bring NDF trading into the domestic market (see below). From 2010, the relationship for the renminbi weakened when an offshore deliverable forward market started trading in parallel with the onshore deliverable forward and offshore NDF markets (McCauley (2011, Graph 1)). In Korea and Chinese Taipei, some domestic financial firms are allowed to trade NDFs (Tsuyuguchi and Wooldridge 2008), Annex A). The rouble foreign exchange market was liberalised in mid-2006.
Growth of the NDF market
NDF turnover grew rapidly in the five years up to April 2013, in line with emerging market turnover in general (Rime and Schrimpf (2013)). Following Bech and Sobrun (2013), we examine partial data since April 2013, which raise the question of how much the growth through April reflected a search for yield.
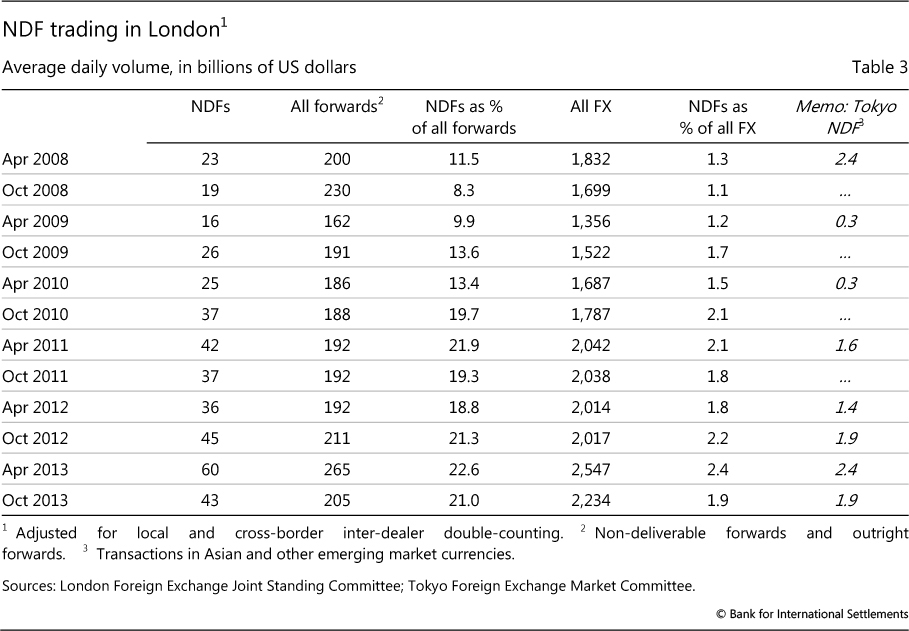
London surveys show that the NDF market grew faster than the forward market or the foreign exchange market as a whole from April 2008 to April 2013 (Table 3). During those five years, NDF turnover doubled its share to 2.4% of overall turnover and 23% of forwards. Looking further back, there is no doubt that NDF trading has grown: the turnover in Asian NDFs in Table 1 is at least 10 times estimates of their turnover from the early 2000s (Ma et al (2004), Kim and Song (2010)).
Since April 2013, NDF trading has been affected by investors' and borrowers' hedging in anticipation of a reduction in global monetary easing. Over the last several years, investors poured large sums into emerging market local currency bonds, and in some markets increased their holdings to substantial shares of outstanding bonds. For their part, many emerging market firms that had used their unprecedented access to the global dollar (and euro) bond market to fund domestic assets also had exposures to hedge.
Surprisingly, when seemingly impending "tapering" by the US Federal Reserve led investors to reduce their exposures to emerging market bonds, some markets experienced little net selling. Instead, investors sold local currencies in well-functioning forward currency markets, including NDFs. These served as what Chang (2013) called the "main adjustment valve", allowing investors to hedge the currency risk in their bond holdings.4
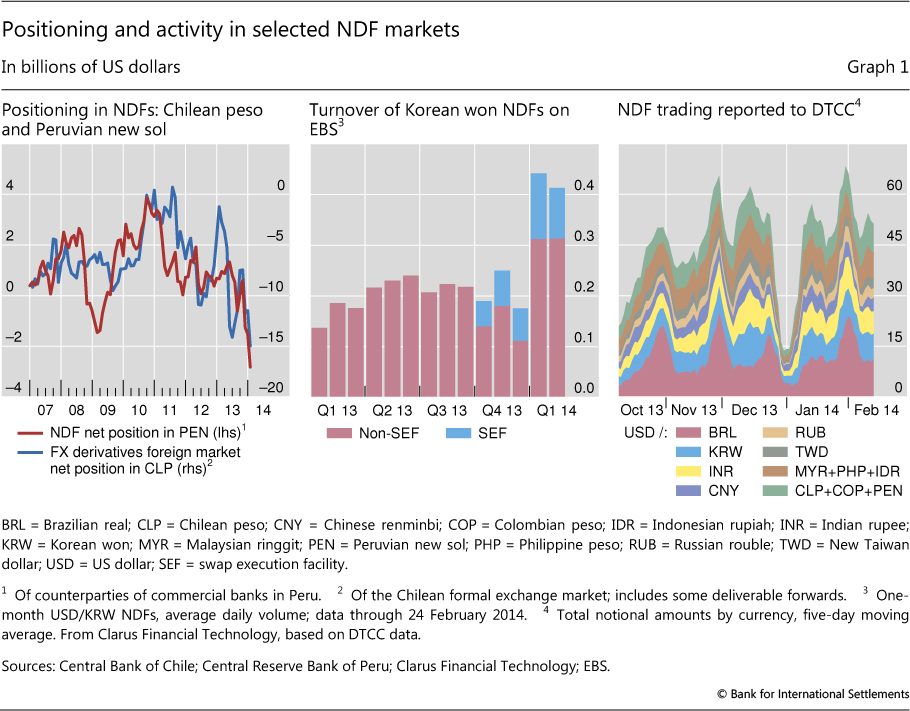
For instance, in the smaller markets of Chile and Peru,5 where the central bank measures not just turnover but also net positions, the data show a sharp turnaround in positioning in May-June 2013. The left-hand panel of Graph 1 shows stocks of long positions in the Chilean peso and Peruvian new sol. The larger stock of positions in Chile declined by $9 billion between end-April and end-June 2013. The smaller position in Peru declined by $2 billion between end-May and end-August. NDFs were used to reduce net exposures, while the Peruvian data show a decline in turnover consistent with the London data for October 2013 discussed below.
Regulatory changes promising high-frequency and granular reporting of trades also buffeted the NDF market in the latter half of 2013. Global efforts to shift derivatives markets to more transparent trading venues and to centralise clearing include not just swaps but also NDFs. In mid-2013, the US Commodity Futures Trading Commission (CFTC) required that NDF trading involving a US resident be reported to the DTCC starting in October 2013 and that NDFs traded on multilateral platforms be transacted on an authorised swap execution facility. Market participants expect the CFTC to mandate centralised clearing of NDFs in 2014, and pending European legislation to do so in 2015. Meanwhile, post-trade transparency and regulation of multilateral trading venues were implemented for US residents in October 2013.
The London data indicate a sharp contraction (28%) in NDF turnover in October 2013 (Tables 1 and 3). The dollar/yen spot apart, this contraction was larger than that for the foreign exchange market in general, and only part of the contraction can be ascribed to the depreciation of the emerging market currencies.
However, daily DTCC data show higher turnover since October 2013. Trades reported to the DTCC have reached $40-60 billion a day (Graph 1, right-hand panel). This is equivalent to a third to a half of the global volume in April 2013. Data on one-month Korean won NDFs traded on the electronic broker EBS also show strong turnover in January 2014 (Graph 1, centre panel).
All in all, despite the huge amounts of data now available, it is difficult to reach a firm conclusion on the trend of NDF turnover since the Triennial Survey. Some of the growth to April 2013 may have reflected the cyclical search for yield.
How do deliverable forward and NDF pricing differ?
Effective capital controls can drive a wedge between on- and offshore exchange rates, especially at times of market strain. In this section, after documenting the deviations, we test which market, onshore or offshore, provides leading prices. Then we examine how the two markets respond differently to global factors.
Forward rate differentials
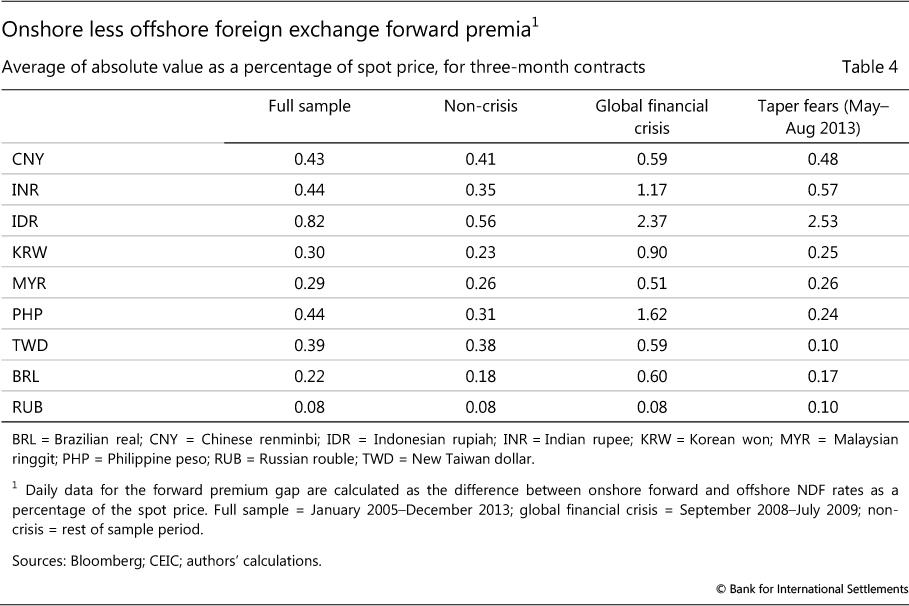
Differences between deliverable forward and NDF rates reflect the effectiveness of capital controls. On the whole, deviations are largest for the renminbi and the Indian rupee, as well as the Indonesian rupiah and Philippine peso (Table 4). The liberalised Russian rouble serves as a benchmark, with much narrower differentials.
The pricing differentials tend to widen sharply in stressed market conditions (Table 4). The 2008-09 global financial crisis witnessed a spike in pricing deviations across the board. Market strain also occurred in May-August 2013 during the sell-off in emerging market currencies, bonds and equities. Yet, with the exception of Indonesia, nothing happened like the fracturing of the markets observed during the global crisis. This suggests that the NDF market still functioned reasonably as the main adjustment valve for asset managers holding long positions in local bonds and firms with unhedged dollar bonds outstanding.
Interpreting lead-lag relationships
If the deliverable and non-deliverable forward markets are segmented, which market moves first and subsequently influences the pricing of the other? One way of approaching this question is to measure which market leads the other in the sense of today's rate in one market providing a useful clue to tomorrow's rate in the other. Previous studies of the won, Indian rupee and Indonesian rupiah tend to show that there is two-way influence between deliverable forwards and NDFs in normal times, but that the NDF market drives the domestic market during more volatile periods (Misra and Behera (2006), Kim and Song (2010), Behera (2011), Cadarajat and Lubis (2012) and Goyal et al (2013)).6
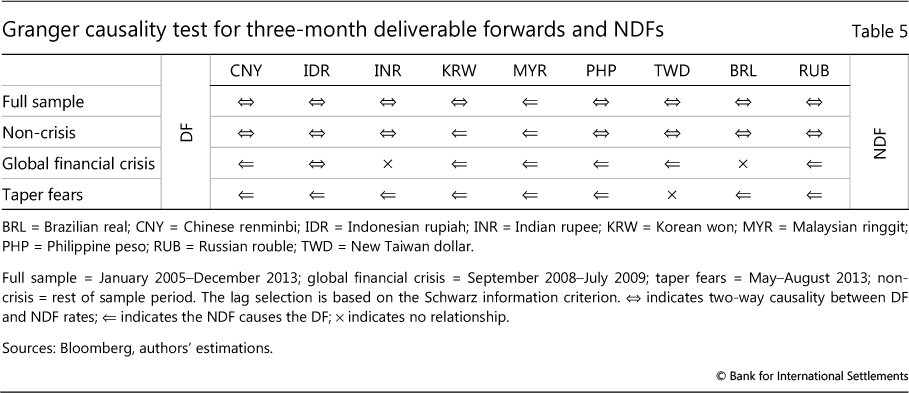
We broadly confirm this finding. We analyse the direction of influence for nine currencies in 2005-13 as well as separately for the 2008-09 crisis and May-August 2013. Granger causality tests point to two-way causation for most currencies for the full sample (Table 5). The exception is the Malaysian ringgit, where the NDF influences the deliverable forward market. There is no case where the deliverable rate leads the NDF.
Analysis of the two subsample periods shows that the NDF's influence seems to increase during market stress. During the global financial crisis, the NDF tended to lead the onshore market. A rise in the influence of the NDF was even more noticeable in May-August 2013 (eight out of nine cases). In India, the impression that the offshore NDF drove the domestic market in summer 2013 has reportedly prompted consideration of opening up the domestic market to foreign investors (Sikarwar (2013)).
However, not too much should be read into this finding, no matter how sophisticated the econometrics. One often ignored subtlety is that the price change in the NDF market is measured at the close in London or New York, whereas the domestic forward is measured at the close in the domestic market, generally in a different time zone. For Asian currencies, the London or New York close reflects news from Europe and the US morning that arrives after the domestic market has closed. Thus, it is not surprising that the NDF market moves the domestic forward market on the following day, especially when financial markets are more volatile. The Granger causality test for the Brazilian real is much more revealing given more proximate time zones.
All that said, how NDF trading in the home currency affects pricing in the domestic market is still of interest to market participants and central bankers. For Asian markets, the influence of NDF market action must be understood as reflecting news flows after the Asian market close as well as a more global set of market participants.
The response of deliverable forward and NDF rates to global factors
A different exercise is to ask how global factors affect pricing in the two markets. Consistent with the discussion above, we use observations on global factors that match the observations on domestic forwards. Thus we use Tokyo closing rates for the major currencies to analyse East Asian domestic forward rates, London rates for the rupee and the rouble, and New York closing rates for the real.
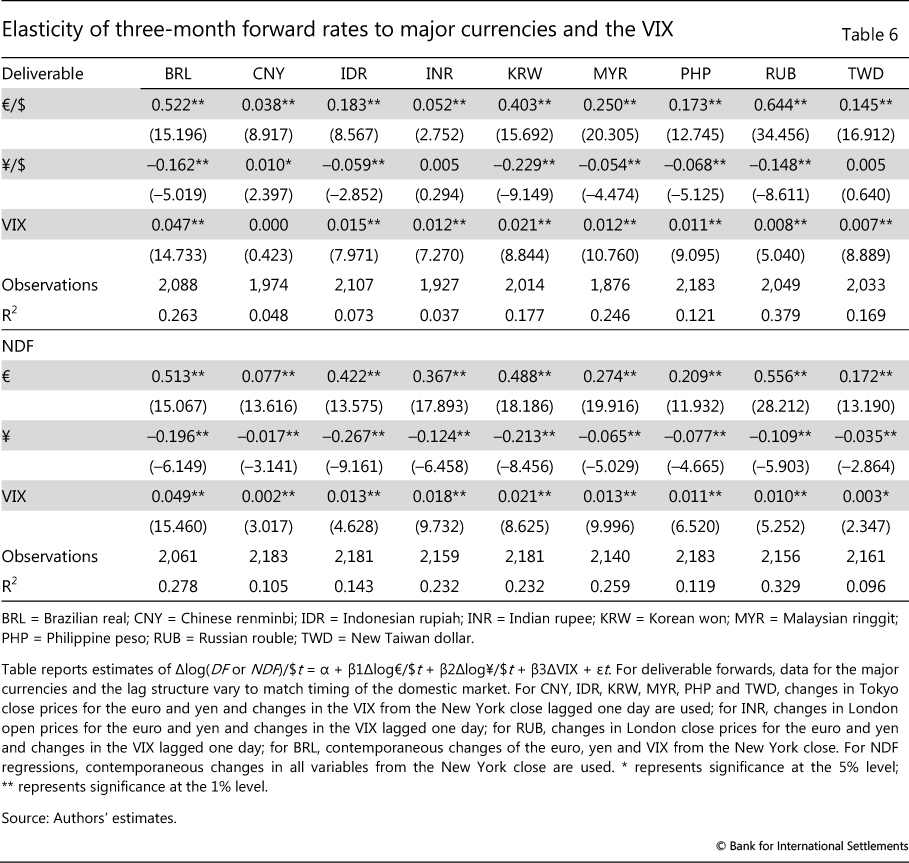
Table 6 shows that both deliverable forwards and NDFs generally respond to global factors. Following Cairns et al (2007), we supplement the (Haldane and Hall / Frankel and Wei) regression of a given currency on the major currencies with an indicator of global risk - the VIX. That is, we regress both the deliverable forward and NDF of a given currency on percentage changes in the euro/dollar forward rate, the yen/dollar rate and the VIX. If the forward rate is affected by global risk conditions, a rise in the VIX would lead to a depreciation, ie an increase in the forward rate defined as above. Note that we lag the VIX for the Asian currencies, using the previous day's New York close.
The estimation results suggest that, by and large, domestic markets, not just NDFs, incorporate global factors. In particular, contemporaneously measured major exchange rates figure similarly in both deliverable forwards and NDFs. The only cases where global factors seem to figure much more in the NDF rate are the renminbi, Indian rupee and Indonesian rupiah.
How do NDF markets evolve?
Two different paths for the evolution of NDF markets can be distinguished. First, if non-residents are allowed to buy and sell forwards domestically - in effect, to lend and to borrow domestic currency - such liberalisation makes an NDF market unnecessary. But the NDF market does not necessarily go away immediately. Second, if restrictions remain, the NDF persists. However, markets can still develop based on the NDF.
One example of the first path is the Australian dollar. Debelle et al (2006) tell the surprising story of the slow passing of the Australian dollar NDF. Deliverable forwards opened up in 1983, but the NDF continued to trade, lingering until 1987.
The NDF share of trading in the rouble has declined even more gradually. The Russian authorities made the rouble fully convertible in mid-2006 amid current account surpluses, large foreign exchange reserves and ambitions for its international use. Since then, the London data show that NDFs fell from 75-80% of forwards in 2008 to about half in April 2013 (Graph 2).7 Especially given the bounce of the NDF share back to more than 60% in October 2013, the rouble NDF could linger for 10 years after its liberalisation in 2006.
On the other path, the Korean authorities have shown caution in removing restrictions, and the won NDF continues to trade - and in fact remains the most traded NDF. Still, its markets have developed quite a bit. Korean banks' ability to arbitrage the onshore forward and NDF markets has tended to keep the gap between them narrow. And non-deliverable currency options, interest rate swaps and cross-currency swaps trade actively. As noted, there is substantial turnover of won NDFs on EBS. Key to the market development is an acceptable and representative mechanism for determining the market average spot rate for the NDF to settle on.8
The costs to Korea of maintaining won NDFs may decline with the changing market structure. The continuing existence of the NDF market alongside deliverable forwards no doubt exacts a cost in terms of lower liquidity from the division of the forward markets. However, it is possible that the change in the NDF market to more transparent trading and centralised clearing will make NDF markets deeper and more liquid. If so, the won's path may prove to be conducive to more market development than seen to date.
The renminbi, with its idiosyncratic internationalisation, is not travelling either path. Certainly, the Chinese authorities have not allowed unrestricted non-resident access to the onshore forward market. Instead, they have permitted, within still effective (although leaky) capital controls, a pool of renminbi to collect offshore that can be freely traded and delivered offshore (Shu et al (2013)). A three-way split of the renminbi forward market has resulted, with an onshore market (dating to 2006), an offshore NDF market (dating back to the 1990s) and an offshore deliverable, or CNH, market (since 2010).
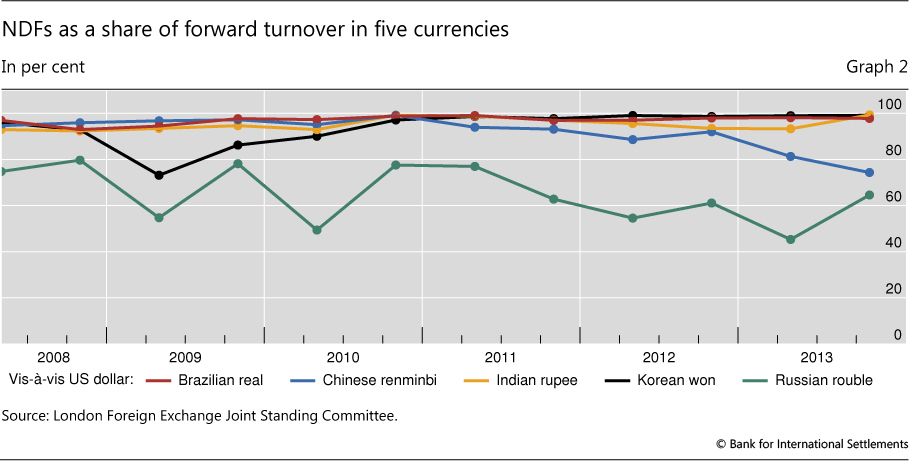
As is evident from Table 2, the offshore deliverable forward is challenging the offshore NDF market: between April 2010 and April 2013, CNH forwards rose from zero to $7 billion per day, while NDFs probably rose by less, to $17 billion per day. Since April 2013, the CNH may have closed in further on the NDF market. Graph 2 shows that the London share of renminbi NDFs in all renminbi forwards dropped between April and October 2013 from 80% to 75%, as CNH trading spread from Hong Kong SAR to Singapore and London.9 It is remarkable how similar the NDF shares of rouble and renminbi trading in London are, given the differences in Russian and Chinese capital account policies.
CNH forwards have several advantages in competing with NDFs. First, some investors, including official investors, have mandates that do not permit NDFs but do permit CNH. Second, the Triennial Survey shows $17 billion in renminbi options, including those written offshore on the CNH, and these generate activity in deliverable forwards. Implied volatility in the CNH tends to be very low, and market participants report a reach for yield among investors who bet on the stability of the renminbi/dollar rate. The liquidity thereby generated in the CNH market, however cyclical, has attracted asset managers, including some hedge funds, to switch from NDFs.
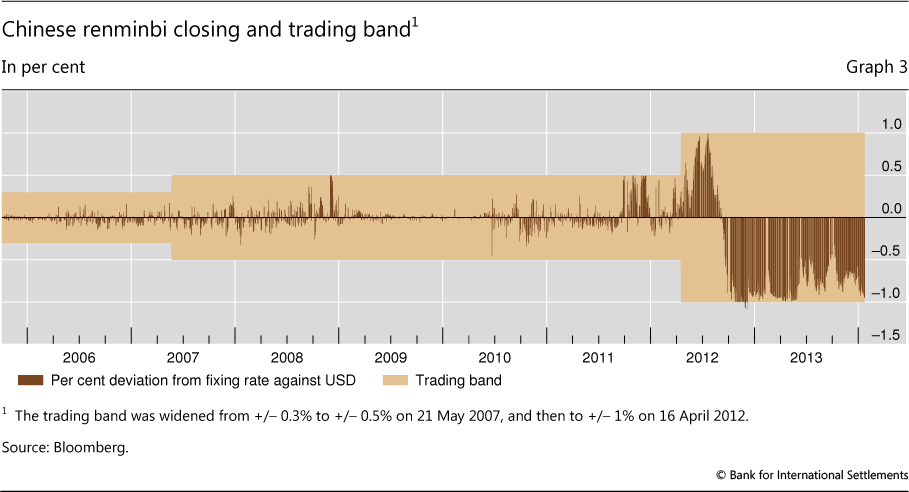
In addition, the limited loosening of the exchange rate system in Shanghai has also increased the so-called basis risk of using the NDF market, which seems to be another factor encouraging corporate hedgers to shift from NDFs to CNH (Minikin and Lau (2013)). NDFs settle by reference to the official central parity rate against the US dollar (the "fixing rate") set every day at 9.30 am in the Shanghai, China Foreign Exchange Trade System. However, actual trading occurs within +/-1% bands around this fixing rate, which were widened from +/-0.5% in April 2012. Many market participants anticipate another widening of the band.
As Graph 3 shows, the widening of the band and the tendency for actual trading to occur near its edges make for substantial basis risk. When the NDF settles at the fixing rate, this can be 1 percentage point higher or lower than the rate at which the renminbi can actually be sold onshore. From the standpoint of a firm trying to fix the dollar value of profits to be remitted from China, a 1% gap between the NDF and the actual rate of exchange can produce unwanted volatility. Since the band's widening, the CNH has averaged an absolute difference from the Shanghai close of just 0.1%, much narrower than the 0.7% absolute gap between the Shanghai fixing and close. The CNH is becoming more attractive to those seeking to hedge because it tracks the onshore rate better than the NDF.
As things stand, NDFs are evolving along distinct paths. While the rouble deliverable forward is slowly displacing the NDF, the Korean won NDF continues to dominate trading and may gain liquidity from ongoing market centralisation. At the same time, the renminbi offshore deliverable forward is closing in on the NDF, notwithstanding capital controls.
Conclusions
The NDF market will continue to grow faster than the foreign exchange market as long as authorities try to insulate their domestic financial systems from global market developments, albeit at the cost of lower liquidity. The insulation, however, can seem pretty thin at times. When NDFs serve as a main adjustment valve for non-resident investors in local assets and local firms with dollar debt, they can lead domestic markets.
Looking forward, as suggested by the current experience of the rouble and the previous experience of the Australian dollar, NDFs are likely to disappear only gradually even after non-residents are allowed full access to domestic forward markets. At the same time, continuing restrictions do not preclude considerable market development, as seen with the Korean won. NDF markets may become more transparent and liquid as trading moves to authorised multilateral trading and centralised clearing in accord with the current wave of regulatory reforms. The fast-developing offshore deliverable market in the renminbi is challenging the incumbent NDF as a better hedging tool.
If foreign investors use NDFs to hedge exposures in local assets in times of stress, sales of these assets in the balance of payment statistics capture their behaviour only very partially. Analysts need not only to follow the money, ie measure capital flows, but also to follow the risk, and newly available data on NDFs can help (Caruana (2013)).
References
Bech, M and J Sobrun (2013): "FX market trends before, between and beyond Triennial Surveys", BIS Quarterly Review, December, pp 45-54.
Behera, H K (2011): "Onshore and offshore market for Indian rupee: recent evidence on volatility and shock spillover", Macroeconomics and Finance in Emerging Market Economies, vol 4, no 1, March, pp 43-55.
Cadarajat, Y and A Lubis (2012): "Offshore and onshore IDR market: an evidence on information spillover", Bulletin of Monetary Economics and Banking, April, pp 323-47.
Cairns, J, C Ho and R McCauley (2007): "Exchange rates and global volatility: implications for Asia-Pacific currencies", BIS Quarterly Review, March, pp 41-52.
Caruana, J (2013): "Ebbing global liquidity and monetary policy interactions", speech given at the Central Bank of Chile Fifth Summit Meeting of Central Banks on Inflation Targeting, Santiago, Chile, 15 November.
Chang, J (2013): Emerging markets outlook and strategy for 2014, JPMorgan, November.
Debelle, G, J Gyntelberg and M Plumb (2006): "Forward currency markets in Asia: lessons from the Australian experience", BIS Quarterly Review, September, pp 53-64.
Ehlers, T and F Packer (2013): "FX and derivatives markets in emerging economies and the internationalisation of their currencies", BIS Quarterly Review, December, pp 55-67.
Eichengreen, B and P Gupta (2013): "Tapering talk: the impact of expectations of reduced Federal Reserve security purchases on emerging markets", December.
Goyal, R, R Jain and S Tewari (2013): "Non deliverable forward and onshore Indian rupee market: a study on inter-linkages", Reserve Bank of India Working Paper Series, 11/2013, December.
HSBC (2013): "Emerging Markets Currency Guide 2014", HSBC Global Research, December.
Kim, K and C Y Song (2010): "Foreign exchange liberalization and its implications: the case of the won", in W Peng and C Shu (eds), Currency internationalization: global experiences and implications for the renminbi, pp 78-111.
Ma, G, C Ho and R McCauley (2004): "The markets for non-deliverable forwards in Asia", BIS Quarterly Review, June, pp 81-94.
Ma, G and R McCauley (2013): "Is China or India more financially open?", Journal of International Money and Finance, vol 39, pp 6-27.
McCauley, R (2011): "Renminbi internationalisation and China's financial development", BIS Quarterly Review, December, pp 41-56.
Minikin, R and K Lau (2013): The offshore renminbi: the rise of the Chinese currency and its global future, John Wiley & Sons.
Misra, S and H Behera (2006): "Non-deliverable foreign exchange forward market: an overview", Reserve Bank of India Occasional Papers, vol 27, no 3, pp 25-55.
Rime, D and A Schrimpf (2013): "The anatomy of the global FX market through the lens of the 2013 Triennial Survey", BIS Quarterly Review, December, pp 27-44.
Shu, C, D He and X Chen (2013): "'One currency, two markets' and the renminbi's growing influence in Asia-Pacific", BIS Working Papers, forthcoming.
Sikarwar, D (2013): "Government set to kill rupee NDF market by easing restrictions & lowering costs", Economic Times, October.
Tsuyuguchi, Y and P Wooldridge (2008): "The evolution of trading activity in Asian foreign exchange markets", BIS Working Papers, no 252, May.
1 The authors thank Matías Bernier, Claudio Borio, Jacob Gyntelberg, Frank Packer, Ilhyock Shim, Claudia Sotz, Christian Upper and Alberto Zapata for discussion and Denis Petre, Jimmy Shek and Alan Villegas for research assistance. Views expressed are those of the authors and not necessarily those of the BIS.
2 Note, however, that the Triennial Survey allocates trading by the location of the sales desk, while the London survey does so by the location of the trading desk. Because two big banks have moved their sales desks out of London but still trade there, the London share on the sales desk basis is only about a third of net-net turnover.
3 See Ma and McCauley (2013) for a multidimensional comparison of China and India.
4 Chang (2013, pp 14-15) shows that rising bond yields tracked falling currencies, allowing the liquid foreign exchange market to proxy hedge rates as well. See also the results of Eichengreen and Gupta (2013), who find that larger, more liquid markets felt more pressure during the tapering episode.
5 Which together reported trades of about $6 billion per day to the DTCC in January 2014.
6 Such results are robust to use of different econometric methodologies, including Granger causality tests, autoregressive models with time-varying volatility and co-integration analysis.
7 Similar to the unique features of the Australian dollar NDF (domestic trading and AUD settlement), special factors may limit the applicability of the rouble's lessons. Foreign investors suffered defaults in 1998 on rouble forwards with domestic banks contracted to hedge their holdings of Russian government securities. HSBC (2013, p 121) notes, "A large portion of [forward market] liquidity is still offshore due to credit constrain[t]s among local banks."
8 An acceptable measure of the spot rate of the rupiah for NDFs, by contrast, has proven elusive, with the Association of Banks in Singapore opting for one based on the NDF itself in August 2013. Illiquidity associated with this problem was said in interviews to lie behind some of the observations above regarding the rupiah.
9 Interviews with market participants in Hong Kong in late 2013 suggested that they perceived that the CNH had already eclipsed the NDF market in April. In the Triennial Survey, renminbi NDFs represented 71% of offshore forwards. Summing CNH forwards, CNH spot and renminbi NDFs, on the grounds that any one of them transforms currency exposure, NDFs were still 45% of such offshore trading. London data for October 2013 show that this share fell by 10 percentage points over the previous six months.