Statistical release: BIS international banking statistics and global liquidity indicators at end-September 2023

Key takeaways
- Banks cross-border claims rose by $801 billion in Q3 2023 to reach $38 trillion, +1% year-on-year (yoy), driven by derivatives valuations and increased cross-border bank credit (loans plus holdings of debt securities).
- Cross-border bank credit increased by $448 billion in Q3 (+2% yoy) due to robust lending to advanced economies (AEs). By contrast, credit to emerging market and developing economies (EMDEs) contracted by 3% yoy.
- Cross-border bank credit to non-banks expanded, with a $254 billion increase in lending to non-bank financial institutions (NBFIs) in Q3 (+7% yoy).
- Credit to non-financial borrowers in China has been declining since mid-2021, amid tightening financial conditions, Covid-19 lockdowns and strains in the domestic real estate sector.
- The BIS global liquidity indicators (GLIs) show an uptick in US dollar-denominated foreign currency credit in Q3 2023; US dollar credit to EMDEs, however, continued to decline.
Cross-border bank credit to advanced economies expanded
The BIS locational banking statistics (LBS) show that banks' global cross-border claims rose by $801 billion (+1% yoy) during Q3 2023 on a FX- and break-adjusted basis (Graphs 1.A and 1.E). This pushed the outstanding stock of claims to $38 trillion (Graph A.1 in the Annex).1 The increase reflected a rise in the market value of derivatives and other instruments amid uncertainty about the future path of inflation and monetary policy in major economies (+$329 billion), as well as a sizeable expansion in bank credit.
Cross-border bank credit expanded by $448 billion in Q3, driven by robust lending in US dollars. Euro-denominated credit changed little, while credit in other currencies, mainly the Japanese yen, expanded by more than $200 billion (Graph 1.B). Credit to borrowers in the United States, Japan and the United Kingdom increased the most (Graph 1.C), driving up the yoy growth in credit to AEs (Graph 1.F, solid black line). By contrast, cross-border bank credit to EMDEs expanded only modestly during Q3, leaving the yoy growth as low as -3% (dashed black line).
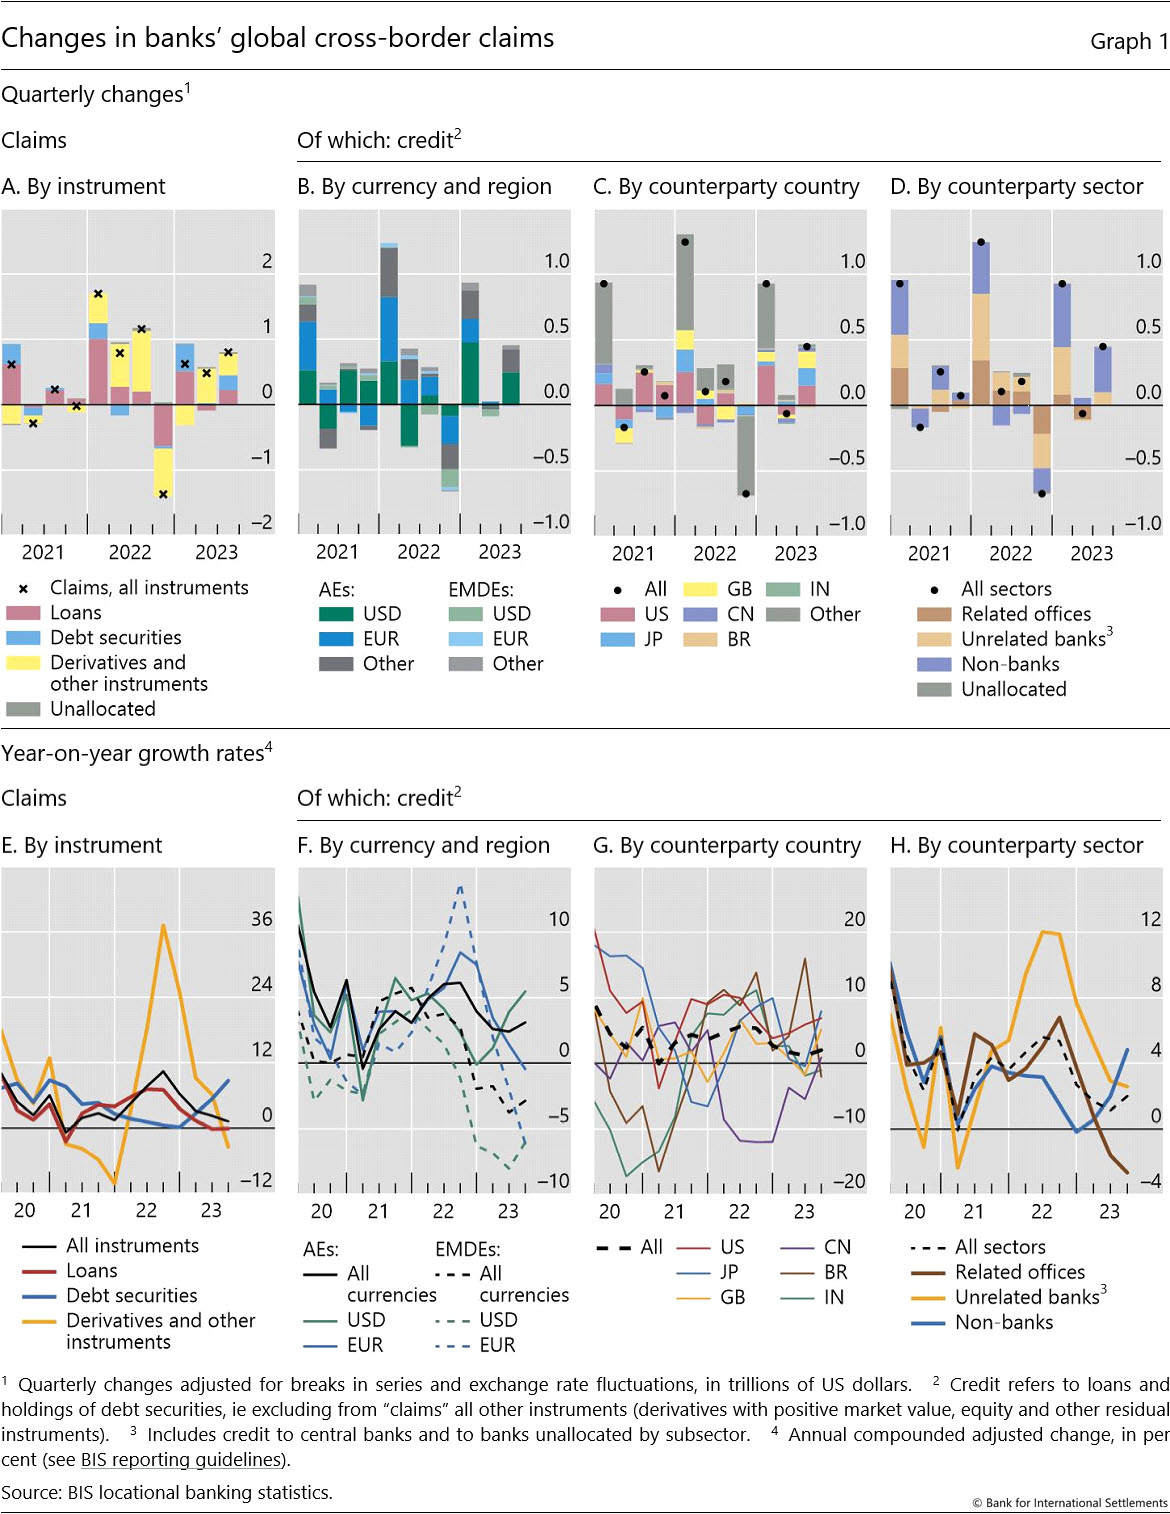
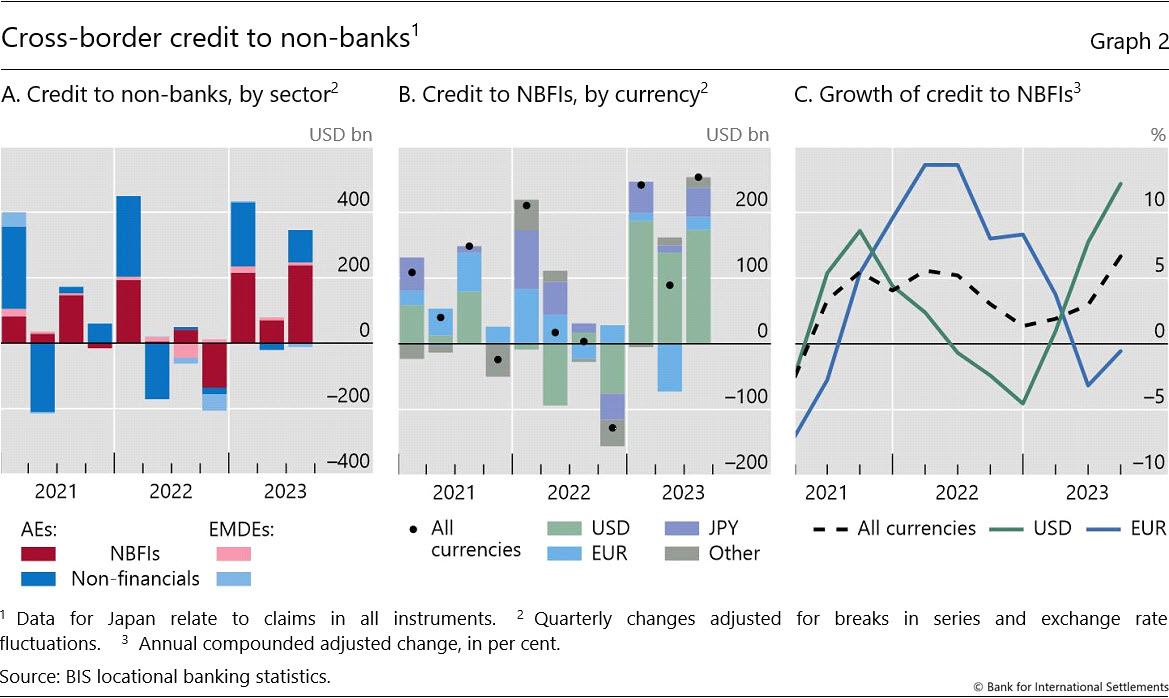
By sector of borrowers, cross-border credit to non-banks, especially those in AEs, drove the overall expansion. The $341 billion increase during Q3 raised the global stock of cross-border credit to non-banks to $15 trillion. Interbank credit added little, with credit to unrelated banks up by $95 billion in Q3. Interoffice lending was weaker, reflected in a 3% contraction yoy (Graphs 1.D and 1.H).
Focusing on the non-bank sector, new cross-border credit (in all currencies) mainly went to NBFIs, with those in AEs attracting $238 billion in new credit (Graph 2.A).2 Global dollar-denominated credit to NBFIs increased for a third consecutive quarter, this time by $173 billion (Graph 2.B). This pushed the yoy growth rate to 12% by end-September 2023; meanwhile, euro credit continued to fall (Graph 2.C).
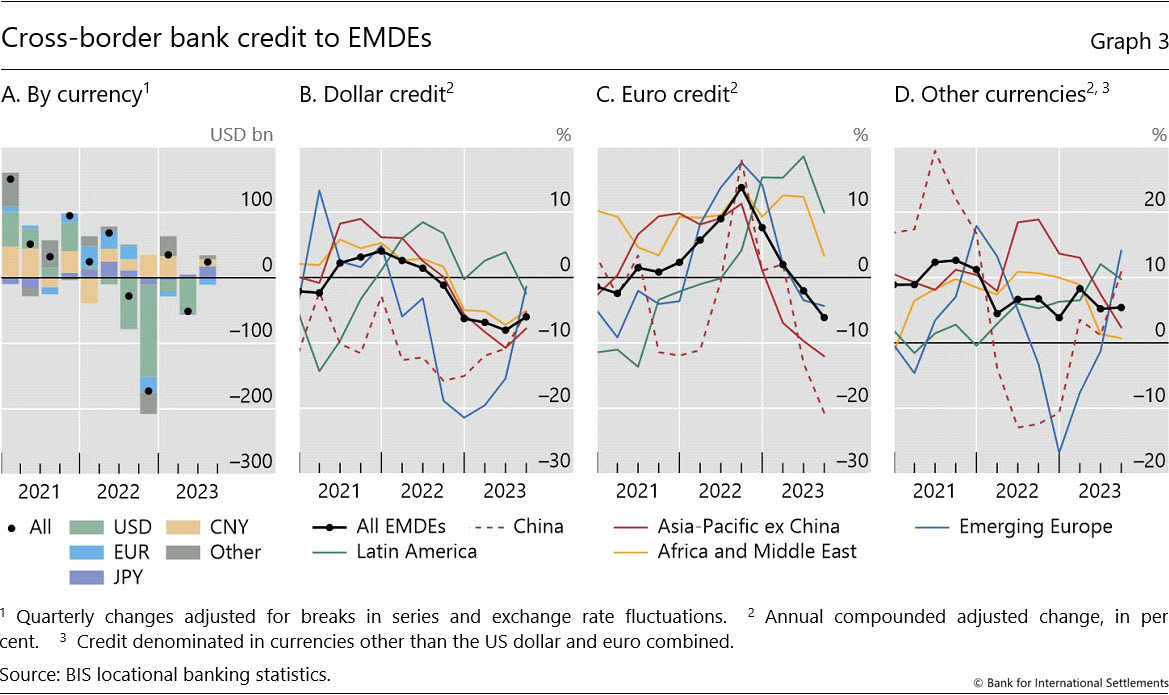
Looking at EMDEs, growth in overall cross-border credit to most regions remained sluggish on account of weak euro and dollar lending (Graph 1.F). In Q3, credit to borrowers in Latin America, particularly Brazil, declined the most. By contrast, credit to the Asia-Pacific region expanded (+$48 billion), especially vis-à-vis China, where the yoy growth rate turned positive for the first time since early 2022 (Graph 1.G).
Dollar credit to EMDEs remained below 2022 levels, despite showing signs of stabilisation in Q3 2023 (Graphs 3.A and 3.B). Euro credit weakened further, contracting by 6% yoy; the decline was larger still for China and other Asian countries (-21% and -12% yoy, respectively). By contrast, yen (+$17 billion) and renminbi (+$11 billion) credit strengthened. Credit denominated in currencies other than euro and dollar (combined) expanded at 5% yoy overall (Graph 3.D).
Credit to non-financial sectors in China declined
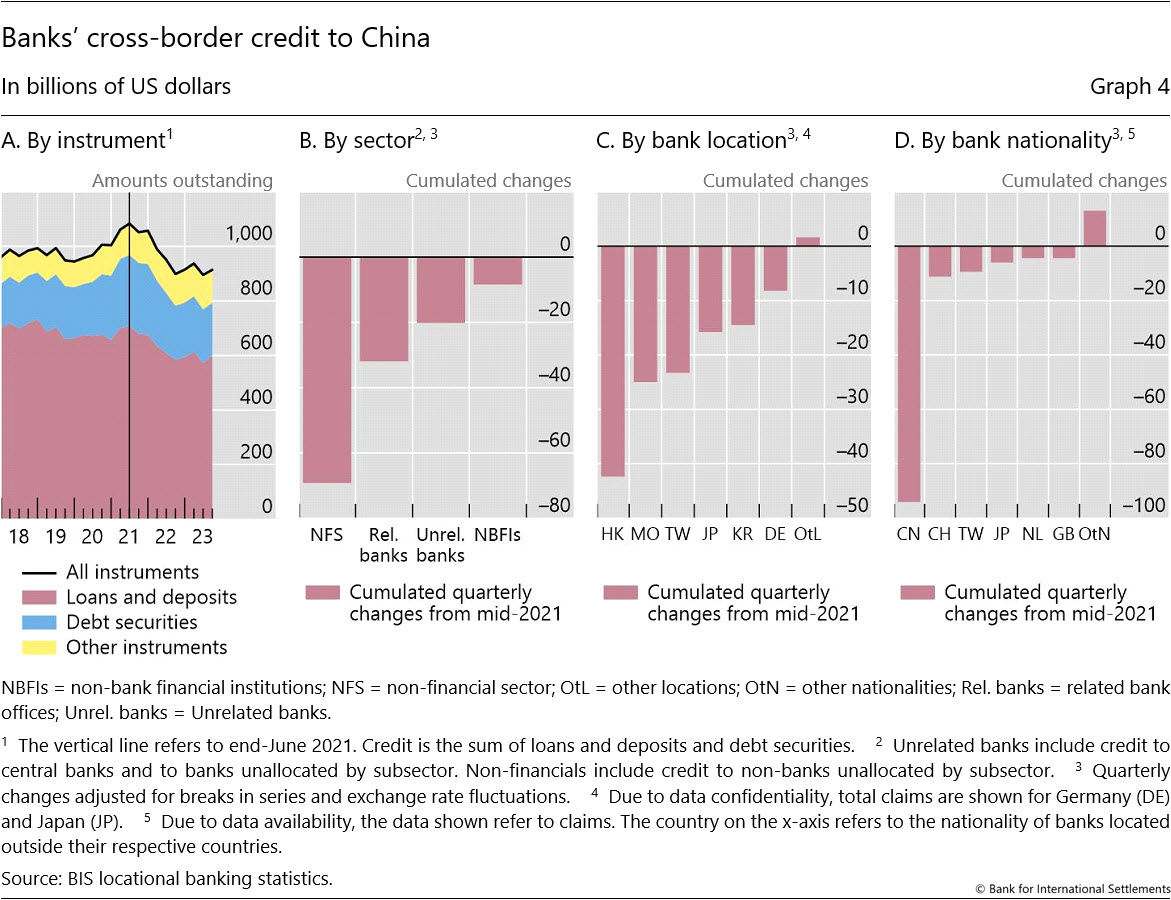
Despite the uptick in cross-border bank credit to China in Q3, the amount outstanding, at $793 billion, remained substantially lower than in mid-2021 (Graph 4.A).3 More than half of the decline over this period was vis-à-vis the non-financial sector (Graph 4.B), which includes real estate.4 Banks in the Asia-Pacific region have curbed their credit the most, by more than $100 billion since mid-2021 (Graph 4.C). The bulk of the overall decline was attributable to Chinese banks operating outside China (Graph 4.D).
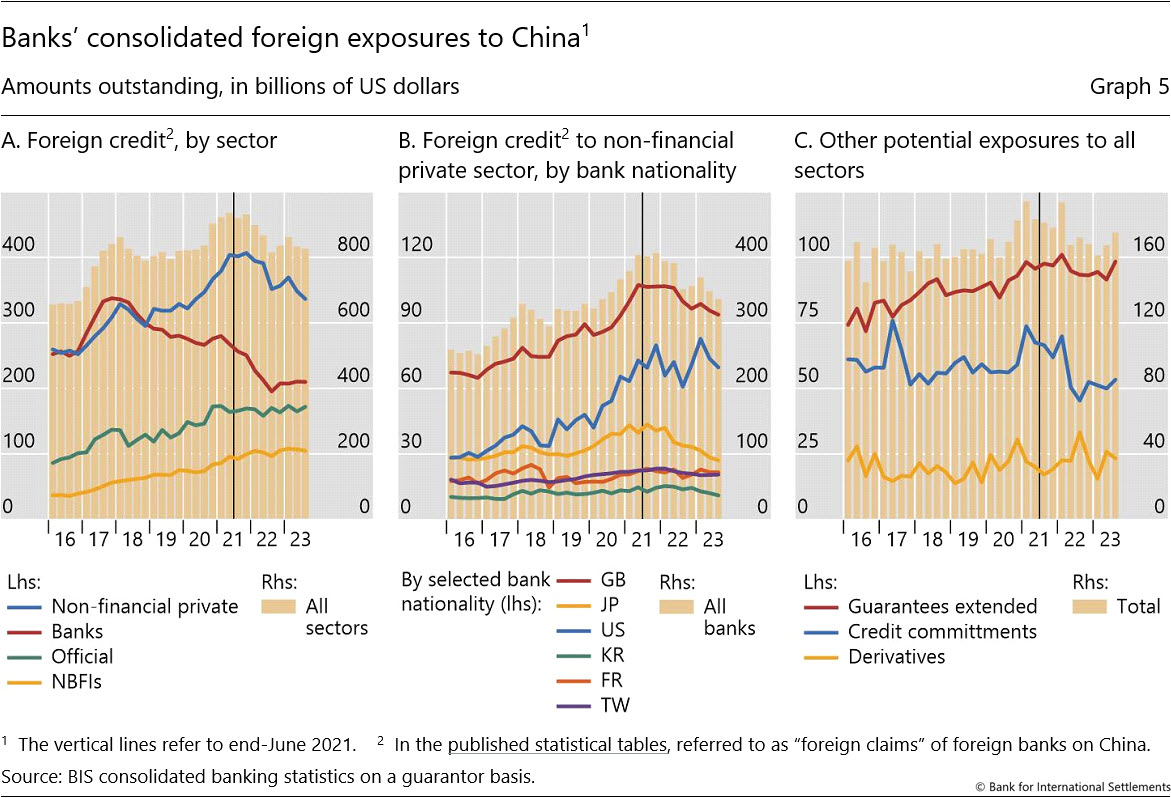
Non-Chinese banks' credit to China, as recorded in the BIS consolidated banking statistics, paint a similar picture (Graph 5).5 As of end-September 2023, global banks' credit to China, which includes both their cross-border credit and local credit booked by their affiliates located in China, stood at $826 billion, or 12% lower than in mid-2021 (Graph 5.A, beige bars).6 The drop can be almost equally attributed to lower credit to unaffiliated banks (red line) and to the non-financial private sector (blue line) in China. Other potential exposures did not decline as sharply (Graph 5.C).
Focusing more specifically on the non-financial private sector, its liabilities to foreign banks fell by almost $70 billion during this period, mostly vis-à-vis Japanese and UK banks (Graph 5.B).
Broader measures of credit to non-banks in China also point to reduced borrowing since mid-2021. Estimates of dollar credit to non-banks, as tracked in the BIS global liquidity indicators (see next section),7 has declined by $140 billion (-25%) since mid-2021. This drop was partly offset by an increase in yen credit over the same period (+$3 billion, at end-September 2023 exchange rates).
Global liquidity indicators at end-September 2023
The BIS global liquidity indicators (GLIs) track total credit to non-bank borrowers, covering both loans extended by banks and funding from global bond markets. The latter is captured through the net issuance (gross issuance less redemptions) of international debt securities (IDS). The main focus is on foreign currency credit denominated in the three major reserve currencies (US dollars, euros and Japanese yen) to non-residents, ie borrowers outside the respective currency areas.8
Foreign currency credit in US dollars and euros rose slightly in Q3 2023, while yen-denominated credit inched down. The quarterly increase of $41 billion in US dollar credit to non-banks outside the United States left the outstanding stock at $13 trillion (Graph 6.A, solid red line). Nonetheless, the yoy growth rate remained negative (Graph 6.B, solid red line). Euro-denominated credit to non-banks outside the euro area remained near €4 trillion ($4.3 trillion) (Graph 6.A, solid blue line), 4% higher than a year earlier. After two years of rapid expansion, yen credit outside Japan lost momentum due to a decline in bank loans. The outstanding stock, at ¥56 trillion ($390 billion), was still up 11% from a year earlier (Graph 6.B, solid yellow line).
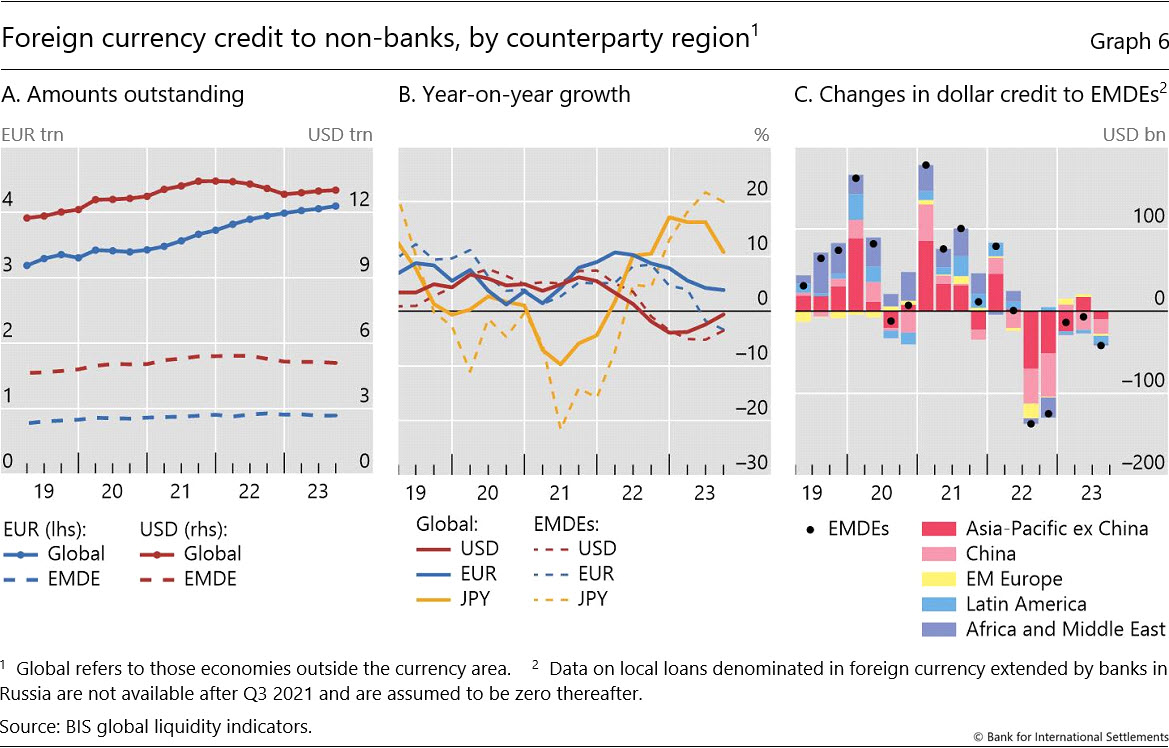
Dollar-denominated foreign currency credit to non-banks in EMDEs fell by $42 billion in Q3 due to weaker bank lending, leaving the amount outstanding at $5.1 trillion (Graph 6.A). As a result, the yoy growth remained firmly negative at -3.5% (Graph 6.B, dashed red line). Looking across regions, dollar credit to borrowers in the Asia-Pacific region fell the most in Q3 (-$27 billion), followed by credit to those in Latin America (-$9 billion) (Graph 6.C).
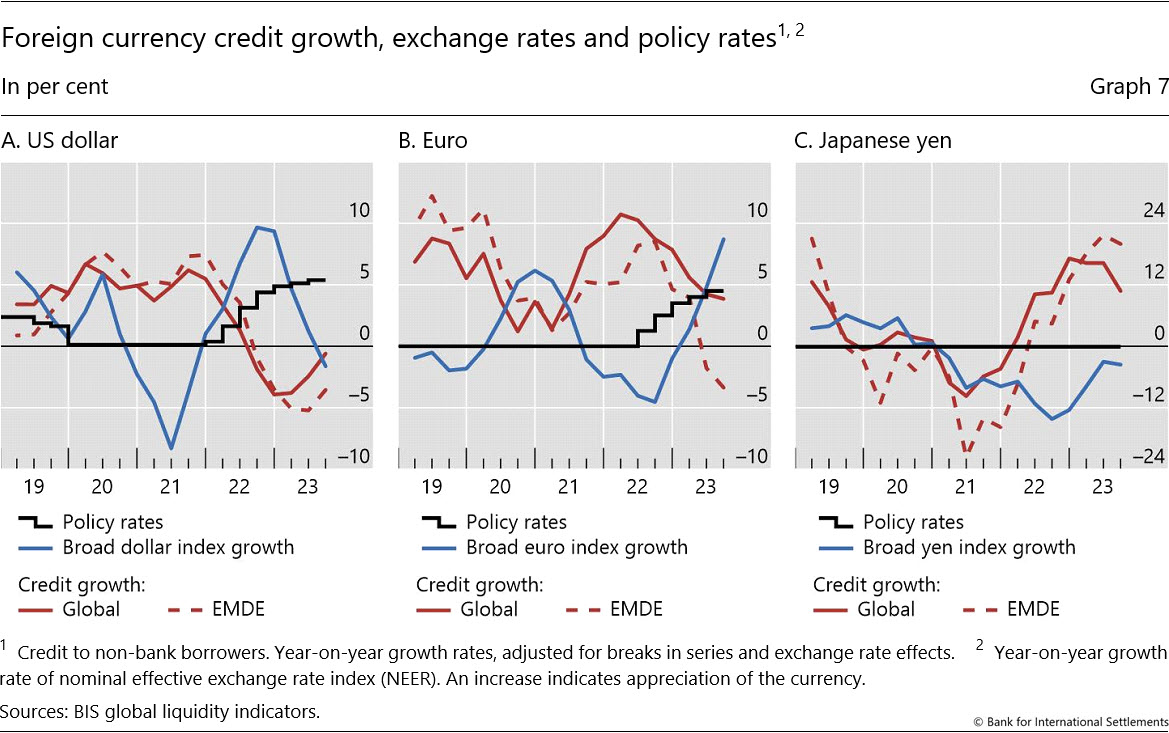
The differences in credit growth across the dollar, euro and yen reflect their respective funding costs and associated exchange rate movements. The negative co-movement between exchange rate indices and credit growth has been salient over the past few years (Graph 7). Monetary policy tightening by the Federal Reserve in response to the surge in inflation led to a stronger dollar from early 2022 onward, weighing on dollar-denominated bank lending and bond issuance. The European Central Bank followed suit, triggering a similar pattern in euro credit growth. Moreover, brisk growth in yen credit between early 2022 and mid-2023 went hand in hand with sustained yen depreciation as the Bank of Japan kept interest rates below zero.
The negative co-movement between exchange rates and credit growth was particularly evident for EMDEs. The 3.5% yoy decline in dollar credit to EMDEs at end-Q3 2023 was notable compared with the 0.6% global decline. The discrepancy was even more striking for euro credit. In Q3, euro credit to all borrowers outside the euro area grew by 3.9% yoy, but euro credit to EMDEs shrank by 3.4% yoy. Finally, yen credit to EMDEs continued to grow at 20% yoy, compared with a global figure of 11% yoy.
1 In the BIS LBS, bank claims comprise (i) loans and deposits, (ii) holdings of debt securities, and (iii) derivatives with a positive market value and other residual instruments (combined). Credit is defined as the sum of (i) and (ii).
2 Credit to the non-financial sector ("non-financials") also increased, albeit by less.
3 The increase in Q3 was largely due to credit to unrelated banks in China. The cumulative decline since mid-2021, most of which was vis-à-vis the non-financial sector in China, can be attributed to global and local influences. The COVID-19 pandemic, the conflict in Ukraine and international monetary policy tightening made for an adverse global backdrop. On a local level, weak economic growth due to the extended implementation of the zero-tolerance COVID-19 policy and the persistent strains in the real estate sector could also have contributed to the decline in lending.
4 Chinese real estate has faced persistent challenges since 2021. See "The real estate sector's evolving contribution to China's growth", Box B, and the discussions around Graph 15 in the BIS Annual Economic Report, Chapter 1, 2022.
5 In the consolidated banking statistics, the published statistical tables use the term "claims", which comprise mainly deposits, loans and holdings of debt securities, but exclude derivatives with a positive market value.
6 Only part of this is due to exchange rate effects. The US dollar has appreciated since mid-2021 (by 9% in the broad dollar index). On an FX-adjusted basis, BIS internal estimates point to a decline in the international component of foreign credit, which comprises cross-border and local credit in foreign currency. This was partly offset by an increase in local credit in renminbi.
7 The estimates from the GLIs combine banks' cross-border and local loans as well as residents' bond issuance in international markets.
8 For more details, see the GLI methodology: www.bis.org/statistics/gli/gli_methodology.pdf.