BIS residential property price statistics, Q3 2022

Key takeaways
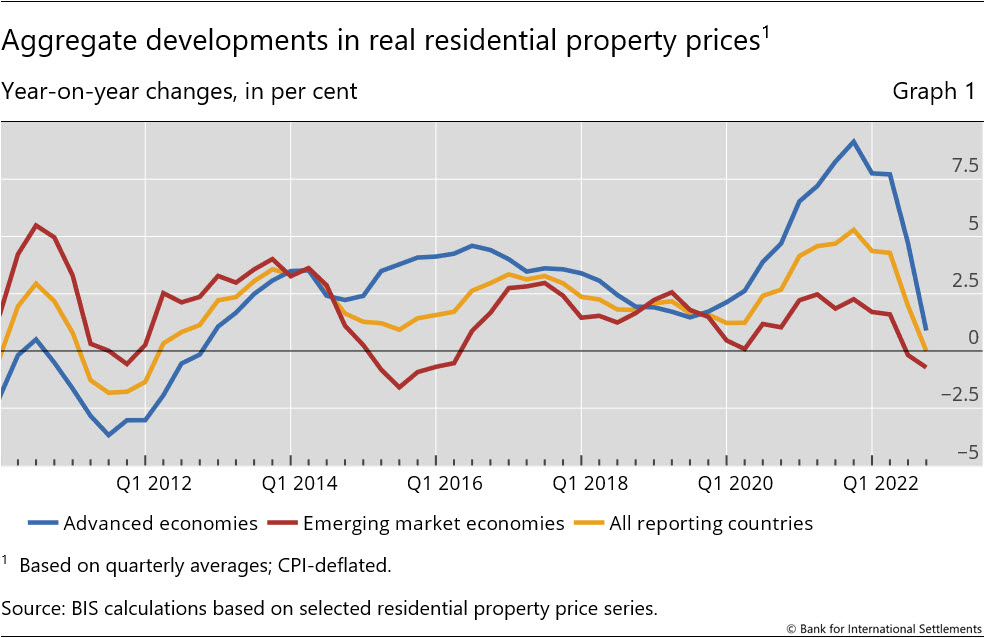
- Global real house prices have clearly decelerated, remaining unchanged year on year (yoy) in aggregate in the third quarter of 2022, for the first time after a decade of rapid growth. This stabilisation in real terms reflected a continued strong increase in nominal terms (+9%) offset by a surge in consumer inflation.
- The slowdown in real house price growth was particularly marked in advanced economies (AEs, +0.9% yoy). Prices extended their decline in emerging market economies (EMEs, -0.7%).
- Real house prices surged in Turkey (60%) and grew more modestly in Japan (+5%) and the United States (3%). They fell noticeably in Brazil, China, Canada and South Africa.
- In real terms, global house prices now exceed their immediate post-Great Financial Crisis average levels by 26% (37% in AEs and 18% in EMEs).
Summary of latest developments
In the third quarter of 2022, global real house prices remained flat yoy in aggregate, for the first time after a decade of sustained increase.1 This stability reflected the combination of strong growth in nominal terms (+8.7%) and an acceleration in consumer price indices (CPIs).2
Real house price growth came almost to a halt in AEs, at +0.9% yoy, down from 4.7% in Q2 2022. In EMEs, prices fell further, by 0.7% after 0.2% in the previous quarter (Graph 1), mainly driven by decreases in Latin America and Asia (–3.5% and –4.3%, respectively).
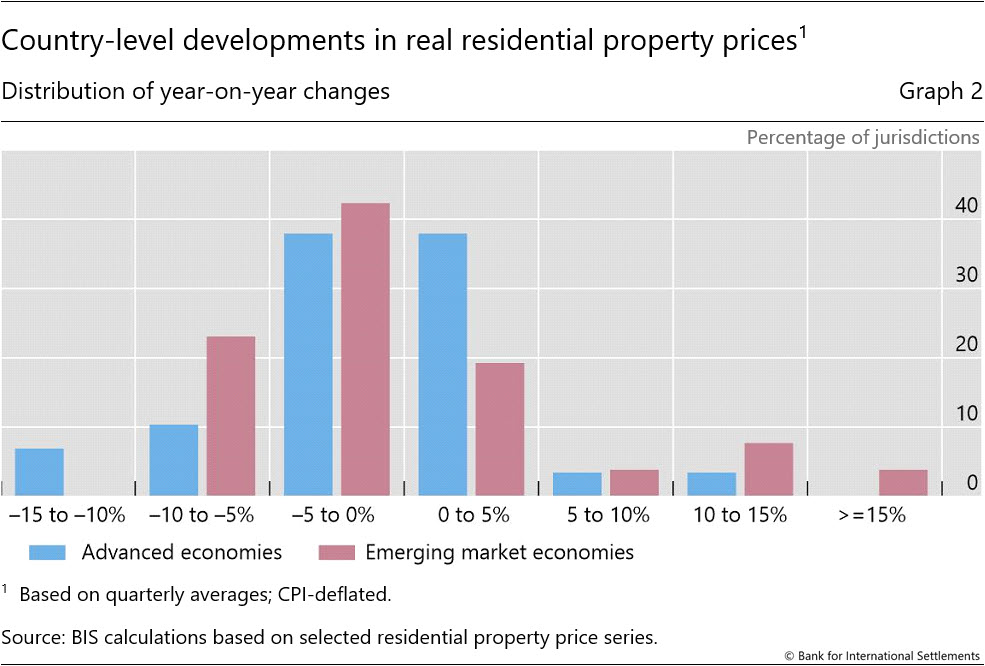
Country-level data show that the decline in real house prices is becoming more widespread, affecting half and two thirds of AEs and EMEs, respectively. Moreover, a significant number of jurisdictions now register price declines of more than 5% (Graph 2).3
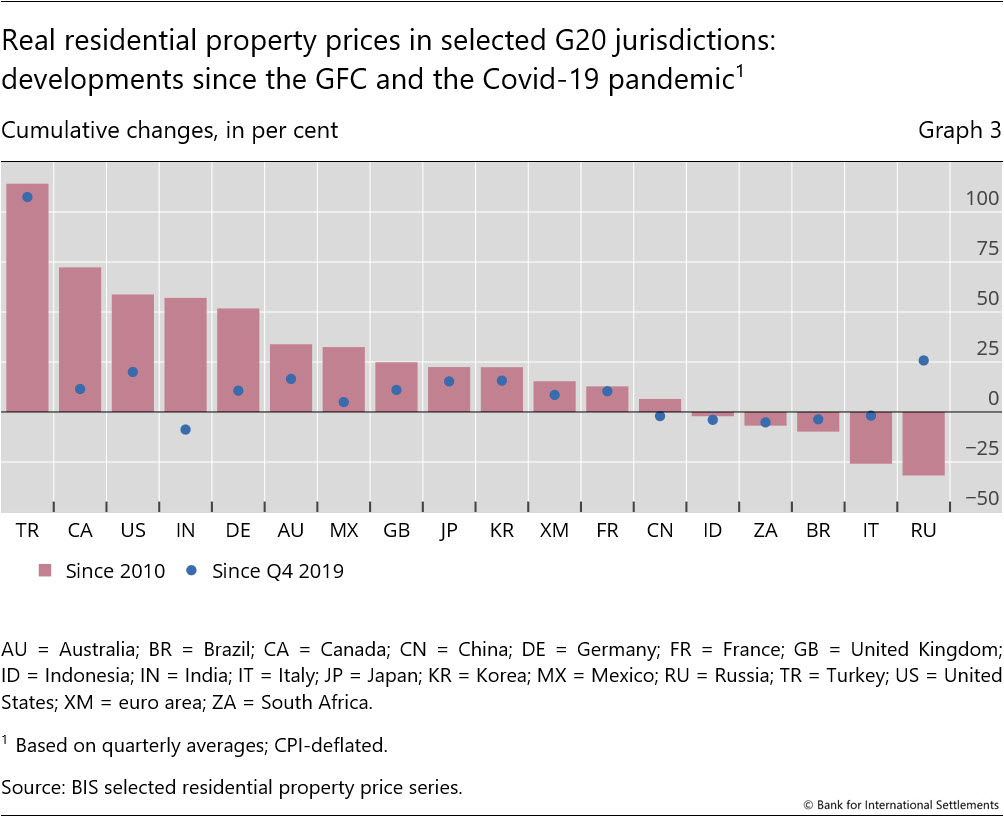
Despite their recent stabilisation, global real residential prices have remained well above their pre-Covid-19 pandemic levels (by 8% in aggregate). Compared with Q4 2019, they have increased by 107% in Turkey, and by 15–20% in Australia, Japan, Korea and the United States. In contrast, real prices have fallen by 9% in India since the end of 2019 (Graph 3).
Advanced economies
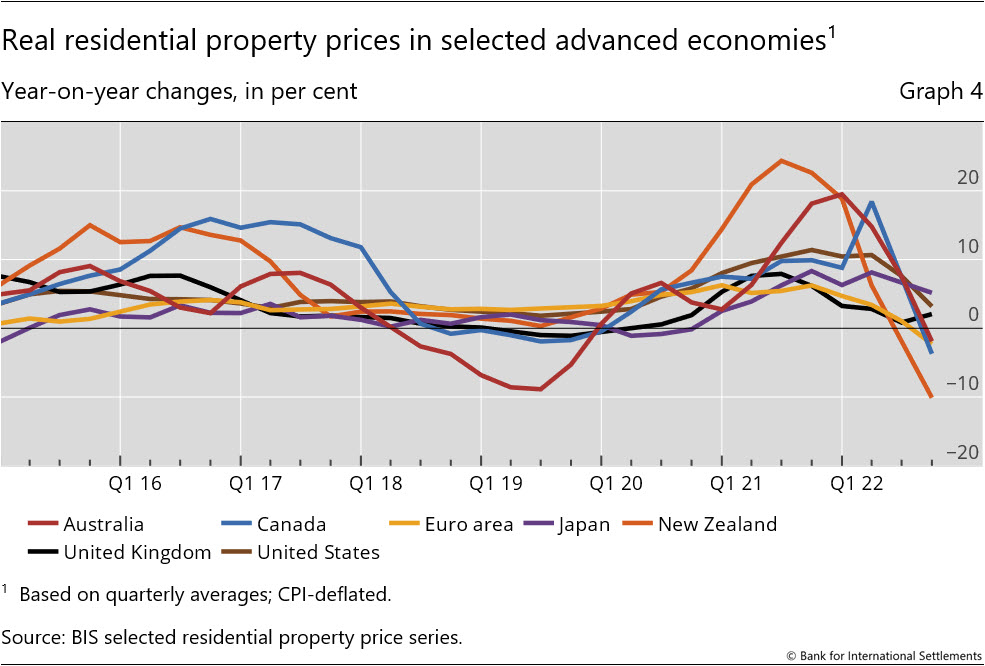
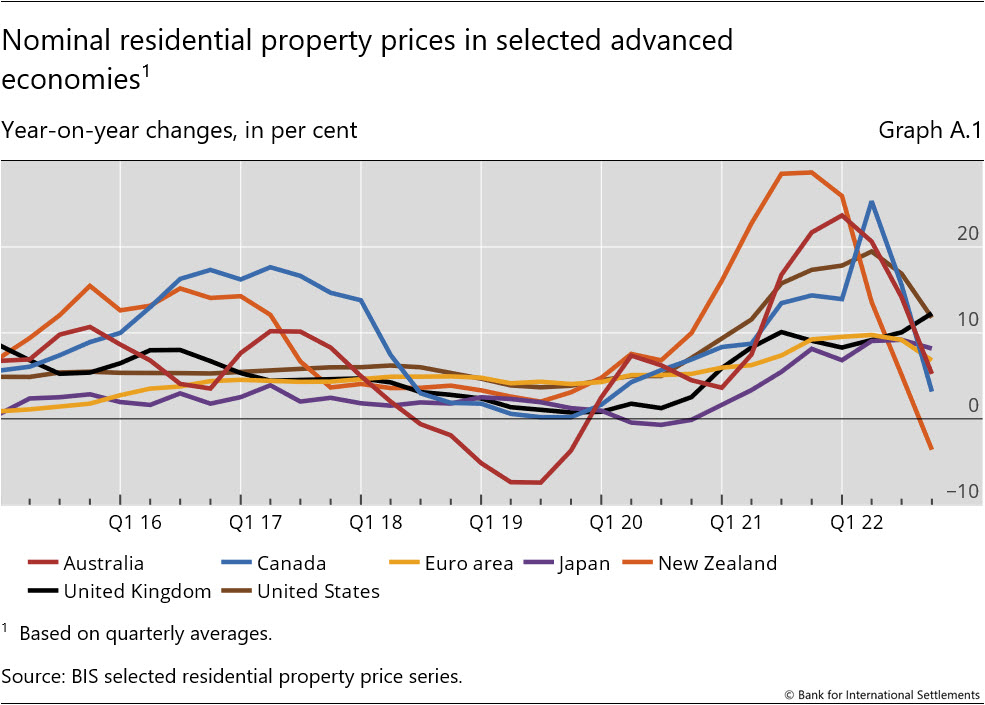
In aggregate for the group of AEs, real residential property prices grew by only 0.9% yoy in Q3 2022, down sharply from 4.7% in Q2 2022. They rose by 5% in Japan, 3% in the United States and 2% in the United Kingdom. They fell by 2% in Australia, 4% in Canada and even 10% in New Zealand (Graph 4).
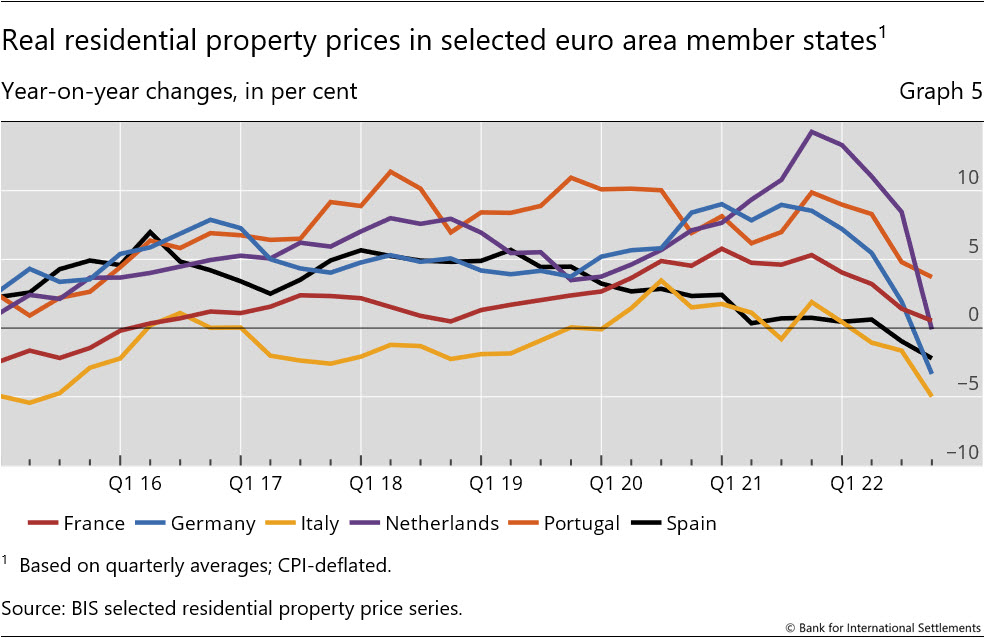
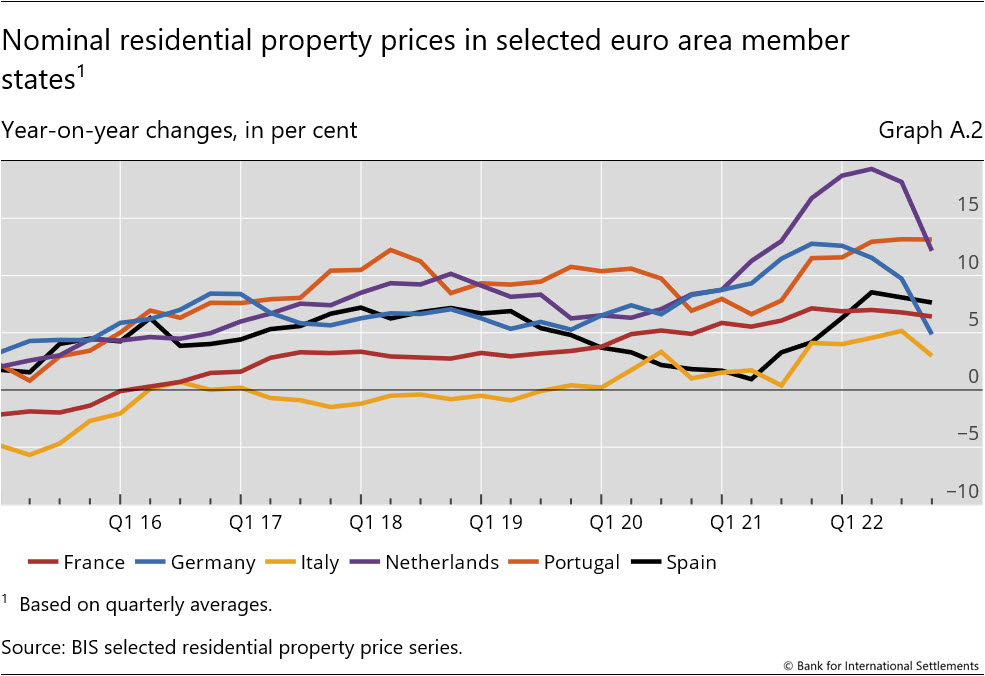
Prices fell for the first time since 2014 in the euro area (–2%), where developments continued to vary significantly among member states despite the general slowdown observed. Real house price growth remained in positive territory in Portugal (+4%) and France (+1%). But prices were stable in the Netherlands (0%) and fell in Spain (–2%), Germany (–3%) and Italy (–5%) (Graph 5).
Emerging market economies
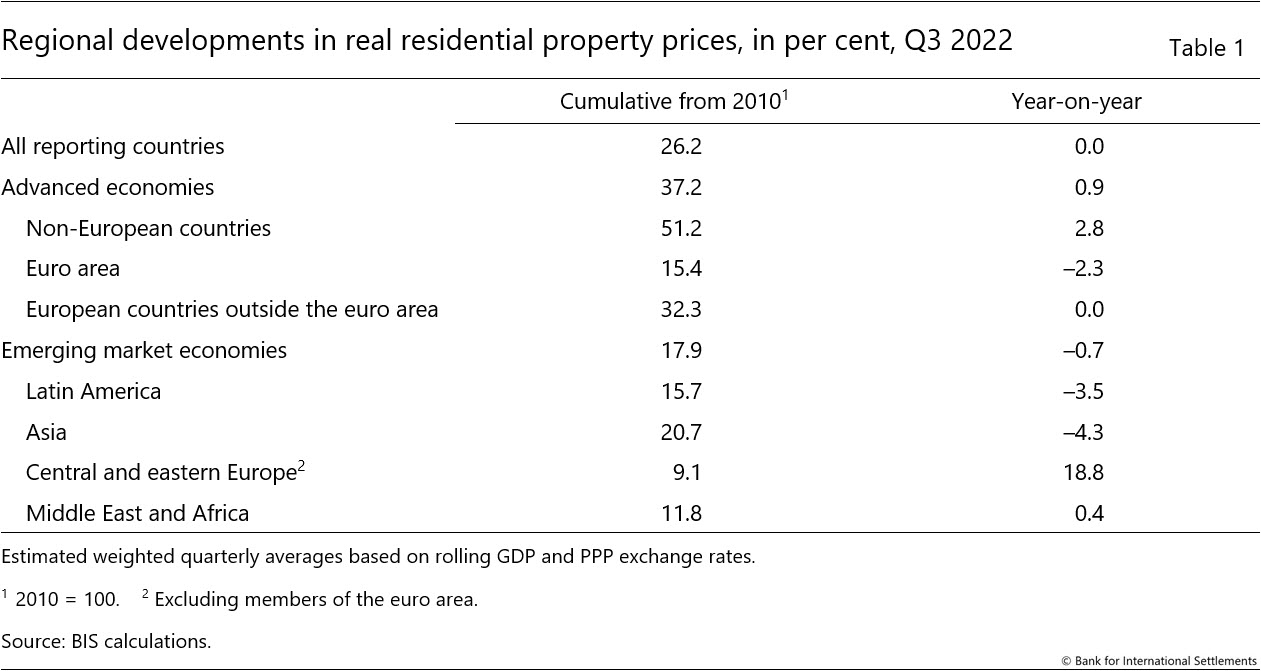
From a longer-term perspective, global house prices now exceed (in real terms) their immediate post-Great Financial Crisis (GFC) average by 26% (37% and 18% for AEs and EMEs, respectively (Table 1). Among G20 economies, real prices have more than doubled since 2010 in Turkey and risen by around 70% in Canada, 60% in India and the United States, and 50% in Germany. At the other end of the scale, they remain well below their post-GFC levels in Italy, by 26%.
Real residential property prices continued to fall moderately in EMEs during the third quarter of 2022, by 0.7% yoy (versus –0.2% % in Q2 2022).
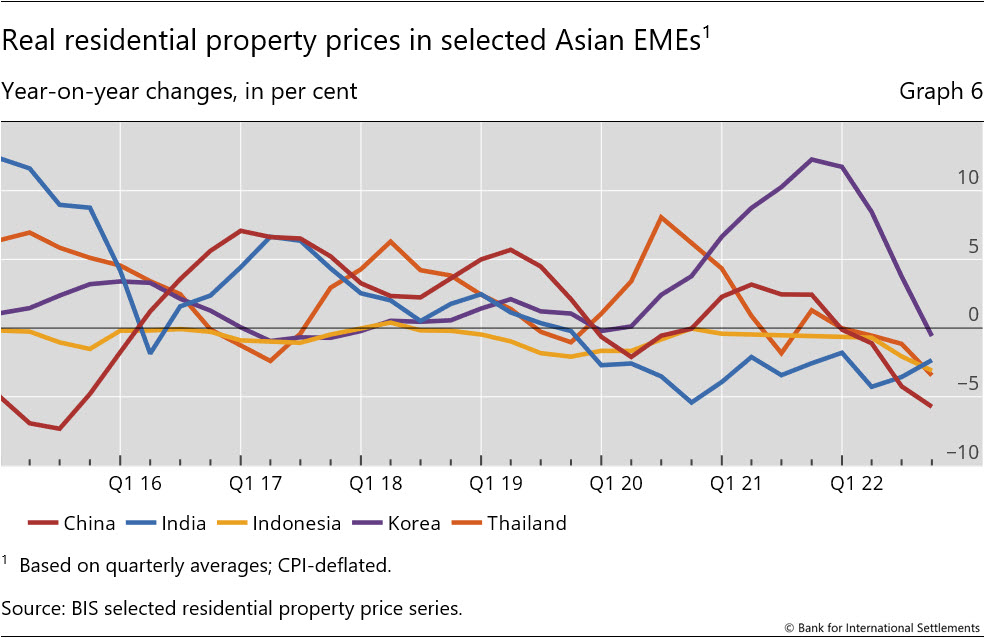
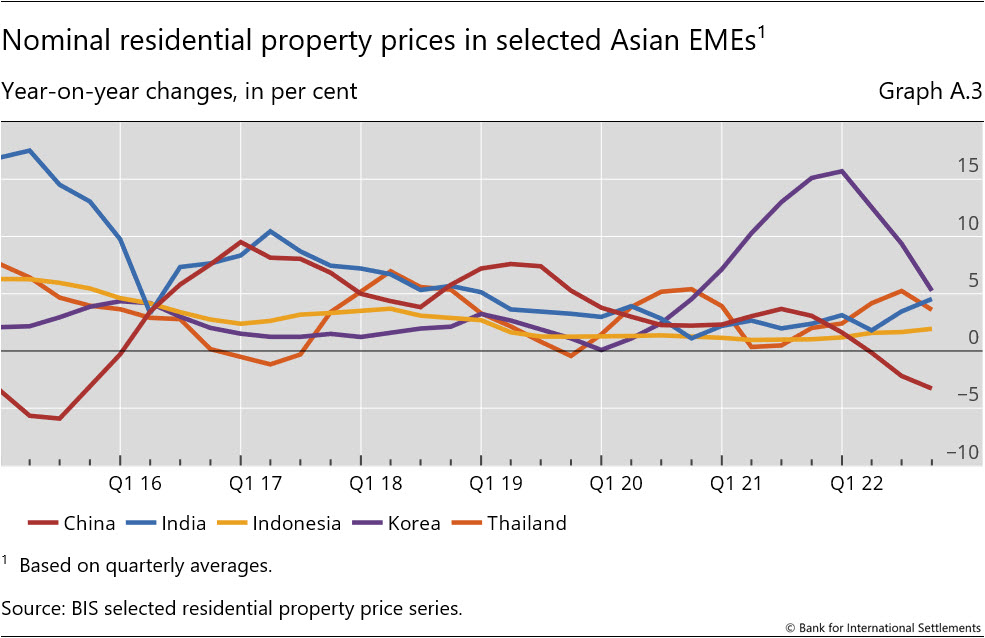
Prices declined in all major Asian economies, by 4.3% in aggregate (and by 1% in Korea, 2% in India, 3% in Indonesia and Thailand, and 6% in China; Graph 6).
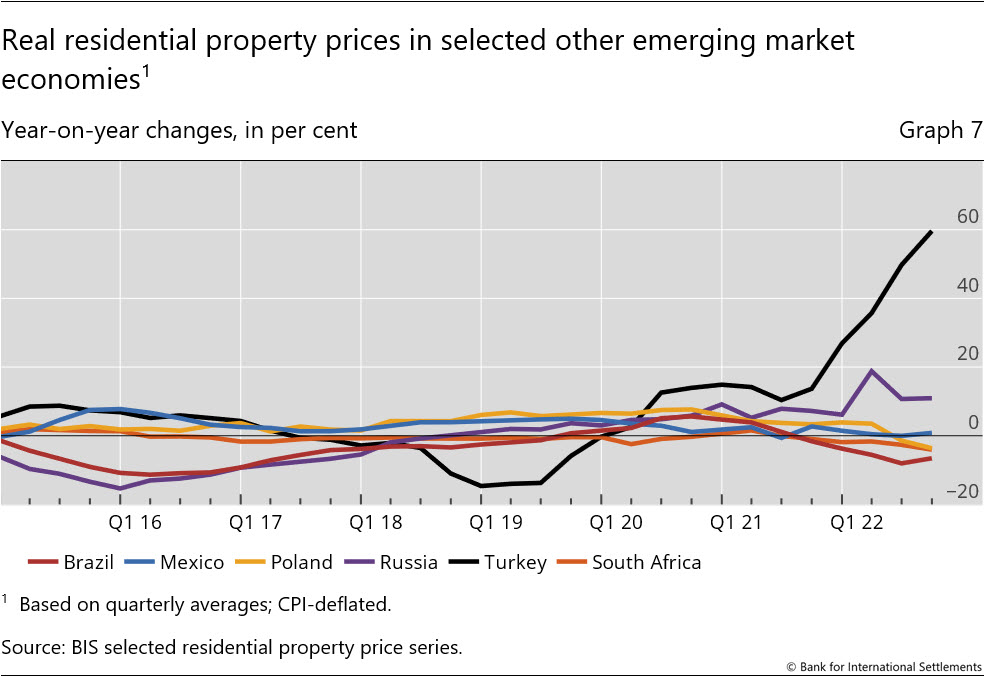
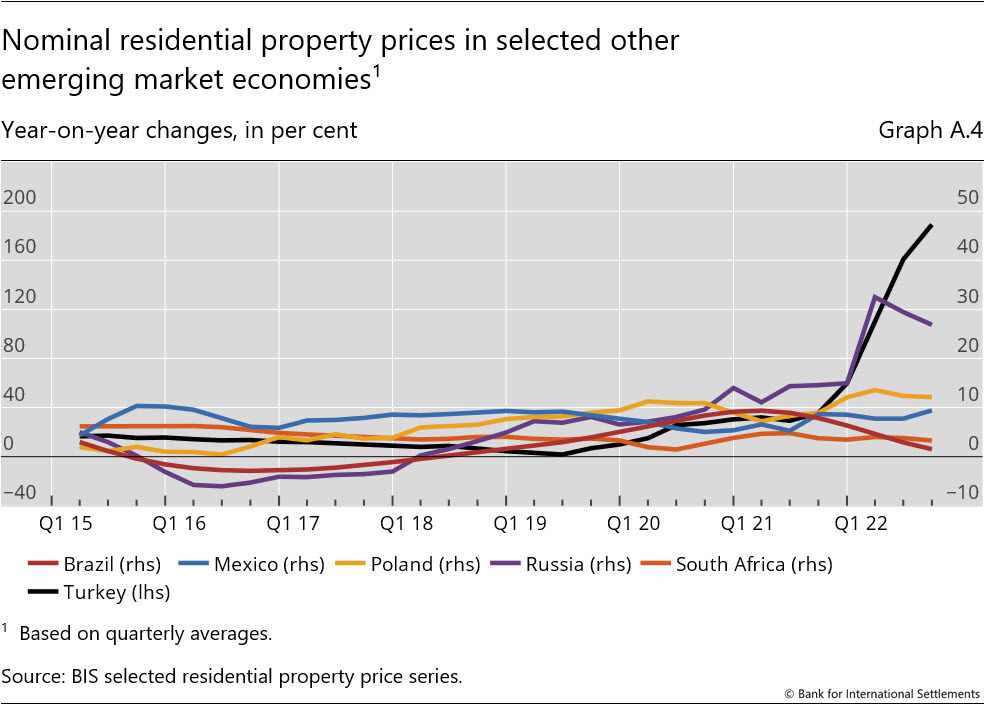
Real prices also went down in Latin America (by –3.5% in aggregate), as the slight increase in Mexico (+1%) was more than offset by the large decline observed in Brazil (–7%). Among central and eastern European countries (+18.8% in aggregate), real property prices surged by 60% in Turkey and declined moderately in Poland (–4%). Lastly, prices fell by 4% in South Africa (Graph 7).
Annex: Nominal house price developments
1 Real residential property prices refer to nominal residential property price indicators deflated by the consumer price index. Global figures are weighted aggregates of selected AEs (Australia, Canada, Denmark, the euro area, Iceland, Japan, New Zealand, Norway, Sweden, Switzerland, the United Kingdom and the United States) and EMEs (Brazil, Bulgaria, Chile, China, Colombia, Croatia, Czechia, Hong Kong SAR, Hungary, India, Indonesia, Israel, Korea, Malaysia, Mexico, Morocco, North Macedonia, Peru, the Philippines, Poland, Romania, Russia, Singapore, South Africa, Thailand, Turkey and the United Arab Emirates), based on PPP exchange rates. Regional aggregates have been available since 2007.
2 The year-on-year change in CPI was higher in Q3 2022 than in Q2 2022 in 85% of the economies covered in the BIS data set. Residential property price developments in nominal terms are shown in the annex.
3 As regional aggregate developments are driven mainly by property price changes in major economies, they can mask detailed country-level features presented in the histogram.