Claudia Buch: Opening speech - 15th Meeting of the Ottawa Group
Opening speech by Prof Claudia Buch, Deputy President of the Deutsche Bundesbank, at the 15th Meeting of the Ottawa Group, Eltville, 10 May 2017.
1. Introduction
The Bundesbank is very pleased to be organising one of the largest meetings in the history of the Ottawa Group. The 2017 meeting is the first to be hosted not by a statistical office but by a central bank. We are happy to welcome more than 100 participants from 30 statistical institutes, 10 central banks, 25 international organisations as well as leading scholars in the field of price statistics.
Price statistics are of key importance for central banks. The Harmonised Index of Consumer Prices (HICP) is the yardstick for the Eurosystem's monetary policy. It was launched 20 years ago, in March 1997. Given the prominent role central banks nowadays play in financial stability, asset prices - and real estate prices in particular - have been given more and more attention as well. Today's discussions will reflect this change in focus.
Before you get into the discussions, I would like to address three questions.
- What has been the contribution of the Group to the development of consumer price indices?
- What does digitalisation entail for price statistics?
- Where do we stand with regard to the measurement of real estate prices?
2. Contribution of the Ottawa Group
Central banks have a key interest in price developments. Given that we have commonly agreed standards on which price index to use, we tend to forget that defining "price stability" is not a trivial task: Which price index to focus on? How to construct the index and to measure price changes? What are the potential limitations when it comes to interpreting these indices? There are no easy answers to these questions, and it required a lot of interaction between central banks, academics, and statisticians to arrive at commonly agreed standards.
The report by the Boskin Commission on consumer prices 20 years ago was certainly a landmark in this debate. One key finding of the Commission was that commonly used CPI data overstated inflation by more than 1 percentage point - with important implications for many areas of public policy, including the calculation of social security contributions. One main reason for the discrepancy was a substitution bias: Individuals shift their expenditures across goods if relative prices change. The basket of goods considered thus needs to take into account substitution away from more expensive goods when relative prices change. By disentangling the adjustment of expenditure weights from one base year to another, price and quantity effects often move in opposite directions. This suggests that substitution plays a significant role.
In parallel to discussions about the Boskin report, the ground was being prepared for the launch of the euro in Europe. A number of key questions needed to be answered: Why did Eurostat conceptualise the HICP as a cost-of-goods index? Why does the Eurosystem define price stability as an increase in this index of below, but close to, 2 per cent over the medium term? Papers presented at the 1999 meeting of the Ottawa Group provided answers.
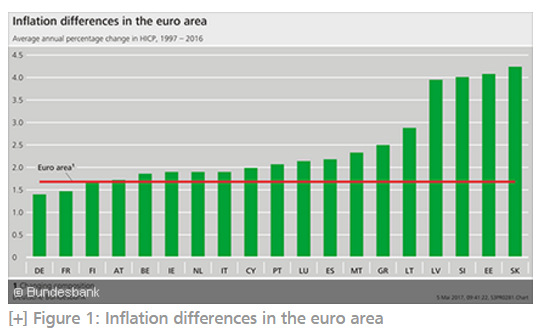
- The Eurosystem's definition of price stability includes a safety margin against deflation. Within any country and, in particular, across the different economies within a monetary union, there is a need for structural change and adjustment of relative prices. In the presence of nominal rigidities, positive inflation allows for the required adjustment of relative prices. Figure 1 shows that inflation differences in the euro area have been quite significant in the past 20 years, demonstrating the need for the adjustment of relative prices.
- Price indices should be transparent and easy to communicate. The euro area's HICP is a pure price index based on the Laspeyres formula, which has advantages over a cost-of-living index. A cost-of-living index requires the definition of consumer baskets with the same standard of living in the context of changing relative prices. This requires a utility framework. But how to define and measure individual preferences? How to aggregate across individuals? These questions are difficult to answer. Such problems can be avoided with a pure price index.
Apart from substitution effects, shifts in expenditure weights are explained by other factors such as income effects. Against this backdrop, HICP weights are updated more frequently in order to accommodate these changes. In April 2014, the ECB concluded in a Monthly Bulletin Box that, "[o]n the basis of the available evidence, it is not possible to estimate measurement bias in the euro area HICP". In short, much remains to be done for researchers and statisticians to re-examine this important topic in price statistics.
3. The impact of digitalisation on price statistics
Digitalisation obviously has an important impact on price statistics. Consumer behaviour and channels of distribution have changed profoundly, and weighting schemes need to take these changes into account.
- Do updates of consumer baskets sufficiently account for the introduction of new ICT goods?
- Do techniques used for quality adjustment filter out pure price changes in products if performance improves?
- Do reporting units reflect the relative importance of online shopping and traditional retail formats?
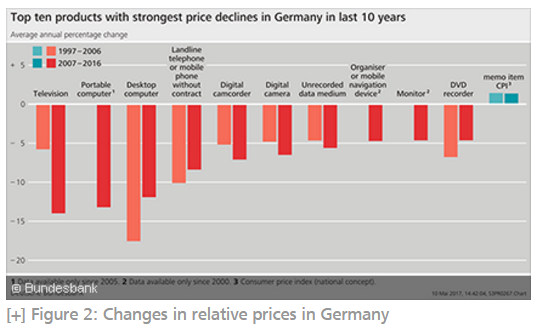
Perhaps surprisingly, the quantitative impact of digitalisation on the overall CPI has so far been limited. In Germany, the products for which prices have declined the most include audio, photo, and information devices (Figure 2). In some cases, prices have fallen by more than 10 per cent annually - against an overall increase in the CPI of less than 2 per cent. One reason for this discrepancy is that ICT goods such as audio, photo, and information devices account for only 1½ per cent of the current consumer basket. But even if we supplement the products of a predominantly digital character (eg software, e-books) or consisting mainly of digital components (eg computers, smartphones) with those goods which are affected by digitalisation to a higher degree (eg technical household appliances, entertainment equipment, vehicles), the share increases to no more than 10 per cent.
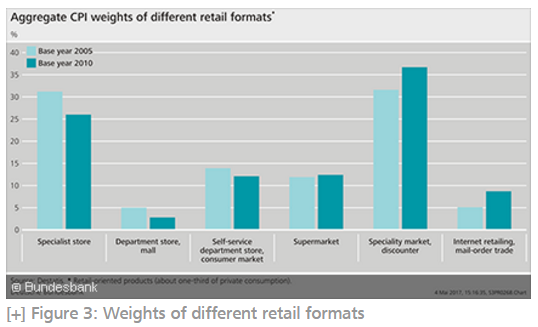
The widespread use of the internet has altered retail formats. Online shopping and mail-order trade doubled their share in Germany between 2005 and 2010. Nonetheless, in 2010, less than 10 per cent of all retail transactions were settled through these channels (Figure 3). In the meantime, the share has certainly increased markedly, given the evidence that the turnover of online retailers has continued to rise steeply in the current decade.
Changes in buying behaviour may pose challenges to statisticians. But digitalisation also offers potential benefits. Digitalisation enables vendors to change prices at a higher frequency. Nominal rigidities which result from the costs of price changes ("menu costs") thus decline. Dynamic pricing makes traditional tools for the collection of information on prices very labour-intensive or even renders them inappropriate. In a digitised world, statisticians are able to apply web-based tools to gather price information. They can also use IT equipment to store, process, and analyse vast amounts of data.
At this conference, it will also be discussed how the use of scanner data can facilitate research on price statistics. The use of scanner data has, for example, revolutionised research on the "law of one price". Traditional empirical work using price indices had mostly found substantive violations of the law of one price. With the availability of micro price data, however, the conventional wisdom on purchasing power parity has been under scrutiny.1
At the Bundesbank, we actively explore how the benefits of new data sources and of Big Data can be harnessed for use in our daily work. Two years ago, we set up a project group with the aim of examining the potential of unstructured data for statistical purposes as well as economic and financial stability research. Recently, we started using list prices of individual properties posted on internet platforms. I am sure that this could trigger further research in the field of residential property markets.
4. From price to financial stability: Closing data gaps with regard to real estate markets
One of the lessons of the global financial crisis has been that instabilities in markets for real estate can threaten financial stability. In contrast to price stability, there is no generally agreed metric for "financial stability". Increases in real estate prices may indicate that risks to financial stability are building up. But other indicators, reflecting credit standards and the build-up of housing debt, need to be considered as well. These include the leverage of households, debt sustainability, amortisation requirements, and loan-to-value ratios.
Traditional statistics often do not reflect these indicators of financial instabilities. The G20 Data Gaps Initiative addresses this.2
- In its first phase, a Handbook on Residential Property Price Indices was published in 2013. With regard to residential property prices, the bulk of the conceptual work has been done, and the focus has shifted to compilation and dissemination. Quality adjustment remains a controversial topic and is still a major source of deviations across residential property price indices.
- The initiative is currently in its second phase. Its main objective has shifted to implementing the regular collection and dissemination of reliable and timely statistics for policy use.
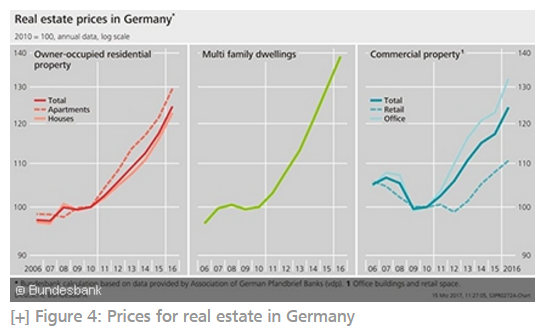
In Germany, prices of real estate property are available from several official and private providers. These indicators differ in terms of representativeness, periodicity, timeliness, breakdowns, and length of the time series. These data show that the prices of both residential and commercial property have risen considerably since 2010 (Figure 4). Owner-occupied housing is currently about 25 per cent more expensive than in 2010, and prices for multi-family dwellings have increased by about 40 per cent. On average, commercial property prices have also increased by 25 per cent since 2010, driven mostly by prices for office space.
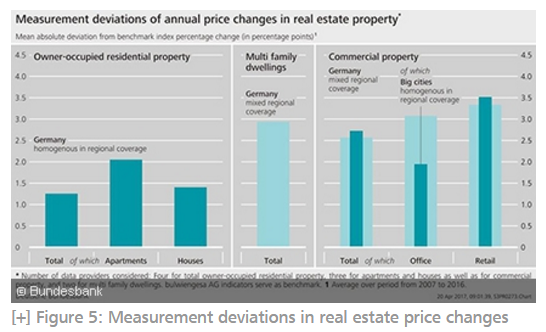
As regards commercial property prices, however, many conceptual issues still need to be clarified. For example, while office buildings, retail space, and industrial structures are classified as "commercial real estate", the classification of multi-family dwellings is not clear and depends on whether one follows the perspective of users or investors. Data availability remains challenging, too. The number of transactions is lower than for residential real estate, and heterogeneity is more pronounced. In the absence of official data, analysts rely on private data provided by market observers. Figure 5 depicts deviations in the measurement across indicators for price changes in German property markets. With regard to residential property prices in Germany, analysts may consider four main indicators published by different data providers. In this case, they are confronted with measurement deviations of about 1 percentage point for the annual price change of the total market on average (left-hand column). For office and retail space, the mean absolute deviation is considerably larger at 2½ percentage points. This is one of the underlying challenges of assessing such data.
Given that real estate prices have increased strongly, are risks to financial stability building up? Two issues need to be considered.
First, changes in prices need to be compared to changes in fundamentals such as income expectations, demographics, and the macroeconomic environment. These factors may indeed explain a significant share of the price increases in Germany. But there is still an unexplained component, and that component seems to have increased over time.3
Second, risks to financial stability emerge if a strong rise in real estate prices coincides with a strong expansion in credit volumes and an easing of credit standards. The house price momentum has caused credit growth, too, to accelerate since the beginning of the upswing on the German property market. Housing credit to households increased by 3.7 per cent in 2016. This is lower than the long-run average: since the early 1980s, the growth rate of housing credit has been about 5 per cent annually.
It is important to note that Germany currently has no consistent reporting on credit standards, eg the loan-to-value ratio or the debt service-to-income ratio.
The relevance of and urgent need for progress in the measurement of real estate prices is widely acknowledged. I am looking forward to the contributions that will be presented at this conference and encourage the statistical community to push ahead with this strand of research and practical implementation.
5. Summing up
To sum up, what can the conference contribute to these debates? Let me return to the three questions raised at the beginning.
- The Ottawa Group has a crucial role to play in discussing and addressing current challenges for price statistics. Its contributions are important to central banks, given their mandates for monetary policy and financial stability.
- Digitalisation has a profound two-fold impact on price statistics. Digitalisation changes product characteristics and alters consumer behaviour. This is a challenge for price measurement. Digitalisation also brings with it new data sources. We need to develop new methodologies and tools to fully exploit this potential for statistics, surveillance, and policy analysis.
- Improving our understanding of developments in real estate markets and their connection with financial stability is crucial. This is well recognised around the globe, and several initiatives, including one launched by the G20, are working on the various aspects of this issue. The contribution of statisticians is to provide more comprehensive, reliable, and timely statistics on property markets and financing conditions.
Both the presentations and poster sessions may lay the groundwork for an intensive exchange of views among participants and beyond. This will stimulate further research and foster better informed statistical practices.
References:
Astin, J. (1999), The European Union Harmonized Indices of Consumer Prices, Paper presented at the 5th Meeting of the Ottawa Group, Reykjavik, 1999.
Boskin, M. J., E. R. Dulberger, R. J. Gordon, Z. Griliches, D. W. Jorgenson (1996), Final Report of the Commission to Study the Consumer Price Index, U.S. Senate, Committee on Finance, Washington DC: GPO.
Broda, C., D. E. Weinstein (2008), Understanding International Price Differences Using Barcode Data, NBER Working Paper 14017.
Destatis (2013), Turnusmäßige Überarbeitung des Verbraucherpreisindex 2013, Wiesbaden, 2013.
Destatis (2016), Auswirkungen der Digitalisierung auf die Preisstatistik, Wiesbaden, 2016.
Deutsche Bundesbank (2013), Commercial property prices in Germany: Conceptual considerations and statistical status quo, Monthly Report, May 2013, pp 53-55.
Deutsche Bundesbank (2017), Housing prices in Germany, Monthly Report, February 2017, pp 51-53.
ECB (2012), New Standards for HICP Weights, Monthly Bulletin, April 2012, pp 36-39.
ECB (2014), Potential Measurement Issues in Consumer Price Indices, Monthly Bulletin, April 2014, pp 40-42.
Eurostat (2013), Handbook on Residential Property Price Indices (RPPIs), Luxembourg: Publications Office of the European Union, 2013.
Hill, P. (1999), COL Indexes and Inflation Indexes, Paper presented at the 5th Meeting of the Ottawa Group, Reykjavik, 1999.
IMF (2016), The Financial Crisis and Information Gaps: Second Phase of the G-20 Data Gaps Initiative (DGI-2), First Progress Report, September 2016. www.imf.org/external/np/g20/pdf/2016/090216.pdf
Triplett, J. E. (1999), Should the Cost-of-Living Index Provide the Conceptual Framework for a Consumer Price Index?, Paper presented at the 5th Meeting of the Ottawa Group, Reykjavik, 1999.
Turvey, R. (1999), True Cost of Living Indexes, Paper presented at the 5th Meeting of the Ottawa Group, Reykjavik, 1999.
1 See eg Broda and Weinstein (2008).
2 For more information on the Data Gaps Initiative, see the IMF paper at www.imf.org/external/np/g20/pdf/2016/090216.pdf
3 See Deutsche Bundesbank (2017).