Geoff Bascand: Changing dynamics in household behaviour - what do they mean for inflationary pressures?
Text of the Sir Leslie Melville Lecture by Mr Geoff Bascand, Deputy Governor and Head of Operations of the Reserve Bank of New Zealand, at the Australia National University, Canberra, 22 November 2016.
The views expressed in this speech are those of the speaker and not the view of the BIS.
I am very grateful to Martin Wong for his considerable help in the preparation of this address. I also wish to acknowledge Hayden Skilling for his research assistance on the household saving decomposition, and other colleagues for their comments on earlier drafts.
Introduction
Thank you for the opportunity to speak to you all today. It's wonderful to be back at the Australia National University (ANU) and an honour to give this lecture that promotes discussion between academics and policy practitioners.
Today, I would like to explore how changes in household behaviour- in particular saving1 and debt dynamics - are influencing inflationary pressures.
Nearly ten years on from the start of the global financial crisis (GFC), some advanced economies are still struggling to reach the "escape velocity" needed to ensure that the economy grows above trend and generates a path of inflation that is consistent with central bank inflation targets. Despite extraordinary monetary accommodation in these advanced economies, economic growth remains disappointingly weak.
Something seems to be different on the demand side of the economy since the GFC, and is challenging inflation modelling and inflation targeting frameworks. Estimates of the real neutral interest rate - that is the real interest rate consistent with the economy growing at full employment and achieving price stability over the medium term - have declined materially.2 Some commentators suggest that nominal interest rates will remain low for years to come.
Views vary as to the nature of the changing dynamics of aggregate demand. Some economists posit that we are now in an era of "secular stagnation", with a persistent deficiency in aggregate demand.3 Others point to an overhang from earlier excessive debt accumulation and suggest that demand is being depressed by a lengthy period of deleveraging.4 Irrespective of the reasons for the weak demand, several supply-side arguments point to lower rates of growth in the labour force, innovation, and productivity, and consequently investment and output growth. In my address, however, I will focus solely on the demand side of the economy.
While there are many common features to the international picture, there are also notable differences. In advanced economies, investment has generally been weak at a time when the household sector's consumption-saving balance has not materially altered.
A different picture, however, emerges in Australasia. As in other advanced economies, private debt levels rose rapidly in the early part of the twenty-first century, due to strong household credit growth. But, since the GFC, private debt levels have tended to stabilise and the household saving rate has increased. This is despite a large increase in wealth associated with rising house and equity prices.
The path of consumption and the relationship between consumption and wealth is crucial to the Reserve Bank of Australia's (RBA) and the Reserve Bank of New Zealand's (RBNZ) assessment of business cycle dynamics and inflation prospects. Indeed, weaker spending out of wealth than expected is part of the reason why inflation has been lower than forecast in New Zealand. To what extent heightened saving preferences represent a permanent shift or a prolonged deleveraging adjustment is uncertain, though some indicators provide tentative support to the view that it represents a prolonged cyclical correction.
In this address, I will briefly review international demand dynamics, before drawing a New Zealand and Australian perspective. I will then examine the changes in New Zealand's saving behaviour and debt dynamics since the GFC, before turning to the implications for the RBNZ's inflation modelling and forecasting.
Increased saving or lower investment?
Since 2008, OECD economies have grown more slowly relative to previous expansions (figure 1). Over the past seven years, growth has averaged 1.2 percent compared to 2.6 percent in the decade preceding the GFC. A similar picture emerges when comparing relative rates of consumption growth. Lower economic growth has been associated with lower neutral interest rates. The extent to which this reflects lower growth in aggregate demand or higher saving is unclear, as is the extent to whether it is a prolonged cyclical phenomenon or a permanent shift in growth rates.5 Summers (2016) believes that long-term secular forces are at play that raise desired saving and reduce the propensity to invest, thereby driving down long-run equilibrium interest rates.
Figure 1: Expansions in real GDP (OECD aggregate)6
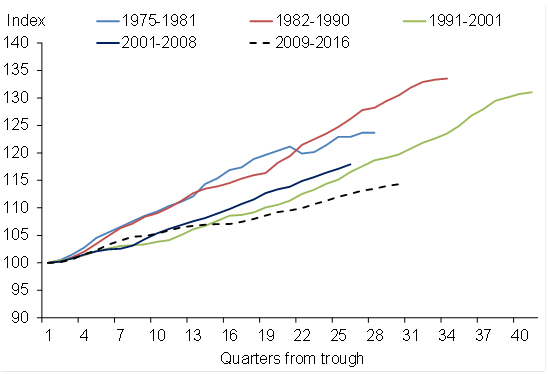
Source: OECD.
An increased propensity to save could reflect many factors. For example, stronger precautionary motives in light of the severe global recession (due to upgraded assessments of financial and employment risk); demographic shifts towards higher saving households; greater saving related to population ageing and longer lives; more-binding credit constraints associated with higher debt levels; rising income inequality; and potentially a downgrading of future prospects for investment returns and growth.
A lower propensity to invest might reflect lower rates of innovation and productivity growth, lower expected investment returns,7 less capital-intensive technologies, and structural change towards less capital-intensive service industries.
An alternative explanation proffered by Rogoff (amongst others) is that our economies are experiencing a prolonged period of deleveraging (in the public and private sectors), aimed at winding back excessive debt accumulation from the period preceding the GFC. In this scenario, national saving would be higher and growth in investment lower (or at least credit-financed investment) for many years.
What does the evidence suggest?8 For advanced economies as a whole, national saving has not altered significantly over the last 25 years and, if anything, have declined slightly (figure 2). The savings-glut hypothesis proposed by Bernanke and others was associated with the large build-up of savings from China in the mid-2000s, much of which ended up financing higher United States (US) spending. However, more recently, China's national saving rate has moderated, while in advanced economies saving rates have recovered towards pre-GFC levels.
Figure 2: Gross national saving (share of GDP)
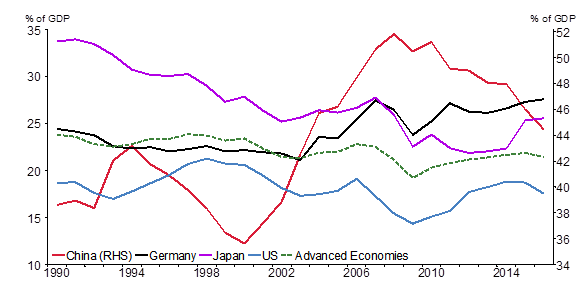
Source: IMF.
The US personal saving data illustrates these developments. Between 1991 and the onset of the GFC in 2008, the personal saving rate as a share of household disposable income fell by 5.4 percentage points.9 This trend decline coincided with a large rise in house prices and build-up in household debt. Debt ratios deteriorated due to increased access to new financial products, the baby-boom generation transitioning towards middle age, and educational attainment for the population was rising (Dynan and Kohn, 2007). Following the GFC, the large decline in house prices led to a reassessment of household balance sheets and an associated cutback in consumption.10
While national saving in the advanced economies has broadly recovered since the crisis, the weakness in investment has been striking. After being relatively stable as a share of GDP through the 1990s and early 2000s, the investment ratio tumbled in the GFC and has risen only marginally since (figure 3). The US investment ratio has recovered only modestly despite low financing costs, and as at 2016 remains 1.4 percentage points lower than its pre-crisis average level between 1990 and 2005.
On the face of this data, the reduced propensity to invest appears to have more power than heightened saving behaviour in explaining the weak aggregate demand story, at least for the advanced economies grouping.
Figure 3: Total investment (share of GDP)
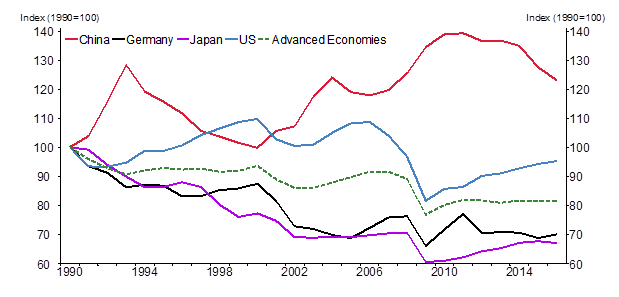
Source: IMF.
Household and government sector debt has risen significantly as a share of GDP since 1990. A reasonably sharp deleveraging in household debt has been observed in the US since the GFC, followed by modest deleveraging in the UK and Germany, but this appears to be an exception to the general pattern observed for advanced economies where debt-to-GDP has been broadly flat (figure 4). These trends are broadly consistent with slow credit growth, in part due to tighter financial regulation and the diminished appetite for debt in the private sector. Bank credit in the private non-financial sector for advanced economies has barely expanded since 2008, while it grew at an annual rate of 8 percent in the eight years preceding the crisis.11 Elevated debt levels may have inhibited credit, investment and consumption growth, but significant deleveraging is not yet apparent in the aggregate data (Buttliglione, Lane, Reichin and Reinhart, 2014).
Figure 4: Household debt (share of GDP)12
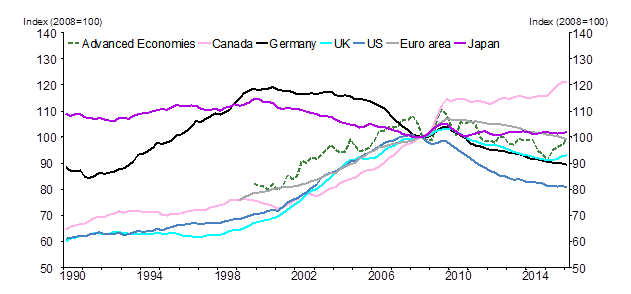
Source: Bank of International Settlements.
Australasian trends
In contrast to some other advanced economies, New Zealand and Australia have experienced fairly stable investment-to-GDP ratios and uplift in saving, especially by the household sector.
Relative to international trends, the Australasian investment story has been stronger with investment ratios now close to their pre-crisis average (figure 5). Both countries benefitted from large commodity price gains, and Australia experienced an extraordinary mining investment boom. New Zealand also experienced a surge in residential investment following the Canterbury earthquake and in response to the acute shortage of housing in Auckland.13 But even beyond these sectoral shocks there are no obvious signs that the propensity to invest has weakened.
Figure 5: Percentage point deviation in investment and saving from pre-crisis averages (share of GDP)14
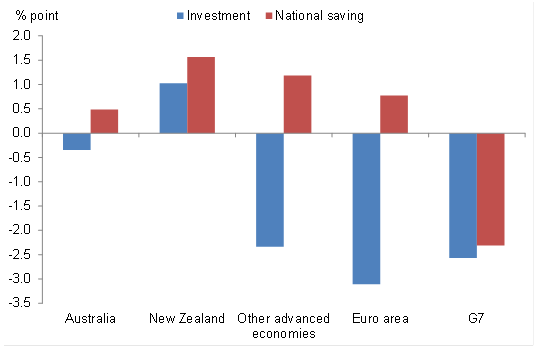
Source: IMF.
In Australia and New Zealand, weaker-than-expected demand has come via lower-than-expected consumption growth relative to income and, in particular, relative to wealth. Notwithstanding a smaller financial crisis than experienced in many advanced economies, Australasian households appear to have adopted a new-found prudence.
One indicator of this is the net foreign liability position, which for New Zealand has fallen from a peak of 84 percent of GDP in March 2009 to around 65 percent of GDP in the 2016 June quarter. This reflects a narrowing current account deficit over the period resulting from higher national saving. In addition, there was a sharp narrowing in the investment income deficit (from 6.3 percent to 3.7 percent of GDP) as interest on foreign debt declined. In Australia, national saving began rising in 2004 and eventually peaked at 24.8 percent of GDP in 2011, contributing to a narrowing in the current account deficit since the mid-2000s. National saving has eased slightly in recent years, but the current account deficit and net foreign liability position have remained broadly stable.
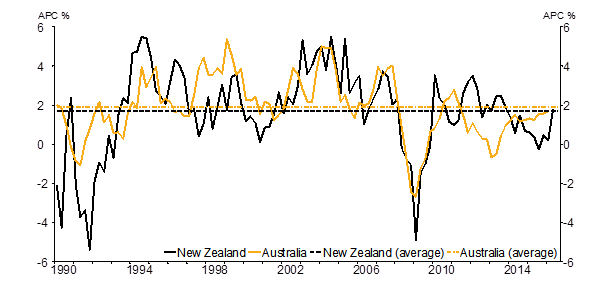
Turning more directly to the household sector, Australia's household saving rate increased from around zero in 2003 to an average of about 7 percent of disposable income thereafter (figure 6). New Zealand also saw a recovery in the household saving rate from a trough of -6.8 percent in 2003 to 2.4 percent in 2012.
Over a longer-term context it is striking that the 1990s and early 2000s were an exceptional period of low or negative saving. For example, in Australia, the personal saving rate has averaged about 10 percent since 1960 and was as high as 19 percent in 1973. In New Zealand, household saving averaged 4 percent of household disposable income from 1987 to 1994, and was then negative for most years until 2010.
Figure 6: Household net saving rate (percent of disposable income)
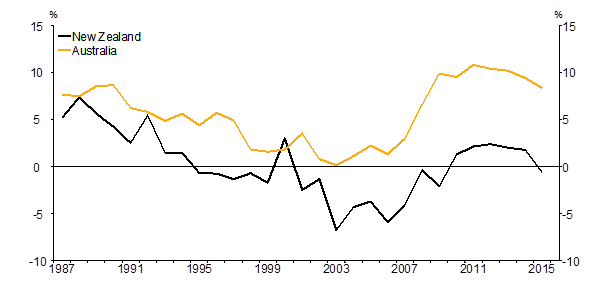
Source: Statistics New Zealand, Australian Bureau of Statistics.
Decomposing changes in household saving
Why has household saving increased? A number of explanations are plausible as I highlighted earlier. It is not my intention to examine these hypotheses comprehensively today. But I will point to some promising lines of inquiry by reviewing how different household groups have behaved before and after the GFC.
The RBA recently examined the rise in the Australian household saving ratio between 2003-04 and 2009-10 by examining saving behaviour for different household groupings (Finlay and Price, 2014). They found that the propensity to save rose most for households reliant on less secure sources of income, or who are more vulnerable to asset price shocks, indicating a greater degree of risk aversion and thus heightened precautionary motives. University educated households also increased their propensity to save relative to high school educated households, which the authors suggested could reflect a downward reassessment of future income prospects by higher-educated households. Wealthy households and those with high debt levels displayed an increased propensity to save, reflecting a desire to rebuild wealth following the asset price shock during the crisis, and a more prudent attitude towards debt.
We have recently undertaken similar analysis for New Zealand using Household Economic Survey (HES) data that compares consumption and saving across households at the peak of the last cycle (2007) and some five years after the recession (2013).15 Whilst the HES provides a flawed estimate of aggregate household saving relative to national accounts data,16 it is reasonably consistent in its methodology over time, affording a useful decomposition of changes in saving patterns.
The HES data shows a smaller increase in the median saving ratio relative to the rise in the overall level of saving (or the aggregate saving ratio). This appears to be explained by much lower dissaving among individuals below the median as opposed to higher saving among those above the median. The saving ratios at the top end of the saving distribution are largely unchanged (figure 7).
Figure 7: Distribution of the saving ratio (percent of disposable income)
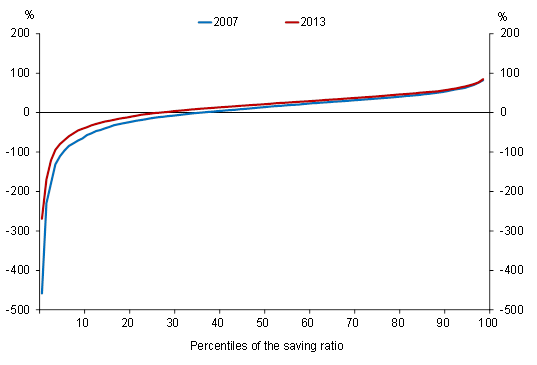
Source: Statistics New Zealand Household Economic Survey.
Similar to Australia, saving rose much more sharply for higher educated households (those holding a degree), suggesting a downward assessment of future income prospects, such that much of the income growth over the period was saved.17 Another parallel with the Australian study is the significant reduction in dissaving amongst those with the highest debt-to-income (DTI) ratio (figure 8), supporting the notion of a debt overhang and a desire amongst such households to lower their debt ratios, or a reduced supply of lending to such households.
These studies suggest there is tentative evidence of a recent shift in saving behaviour in Australasia owing to pessimism around income growth and the negative shock to wealth emanating from the GFC. The former would suggest a more enduring change, while the latter is more consistent with a prolonged cyclical adjustment.
In both countries, there is no obvious sign that ageing demographics (i.e. an increasing concentration of middle-aged households with higher saving rates) had a strong influence over the change in saving behaviour during the period. When adjusted for changes in the age composition of households, the aggregate saving ratio in 2013 was only marginally lower than the unadjusted rate, implying that most of the (large increase) was due to economic factors.18 Correspondingly, the increase in the saving rate was smaller amongst the 50-64 year old age cohort than it was for the 30-49 cohort or the 65+ group.
Figure 8: Saving ratio by DTI quartile (percent of disposable income)19
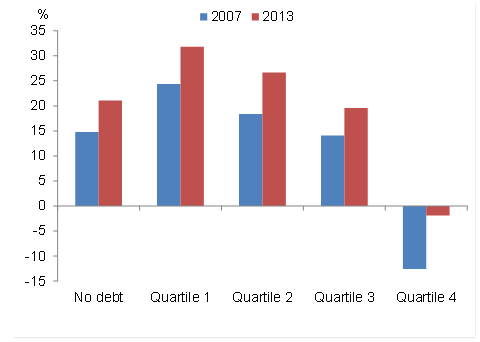
Source: Statistics New Zealand Household Economic Survey.
Consumption and wealth
In absolute terms, real consumption growth has not been noticeably weak since the crisis, with annual real consumption growth in both countries similar to its long-term average of around 2.5 percent. However, population growth has been rapid and thus real consumption per capita has grown by only 1.2 percent and 0.8 percent per annum on average since 2008 in New Zealand and Australia respectively (figure 9), well below its long-term average. Moreover, this modest per capita consumption growth has occurred when wealth, namely housing wealth, has been rising rapidly.
Figure 9: Consumption per capita (annual growth, percent)20
Source: Statistics New Zealand, Haver Analytics.
In the early 2000s, rapid increases in housing wealth were associated with strong growth in credit and consumption. A number of analyses focused on the mechanism of "housing equity withdrawal" whereby households either borrowed against rising housing wealth or sold down to realise the gains and potentially to finance general consumption.21 Equity withdrawal represents one mechanism for dissaving and, for New Zealand, this dynamic can be observed in figure 10.
It is clear that net equity withdrawal from housing wealth has so far been confined to the early to mid-2000s, which coincided with strong household consumption growth and a fall in the household saving rate. Although there has been a large rise in housing wealth in New Zealand and associated credit expansion since 2013, equity withdrawal has not eventuated according to our measure. The introduction of loan-to-value restrictions for housing loans since 2013 has likely played a part in offsetting credit growth related to the resurgence in housing market activity. Likewise in Australia, housing equity withdrawal was only a phenomenon that occurred in the early to mid-2000s (Kent, 2015).
Figure 10: Housing equity withdrawal (percent of disposable income)22
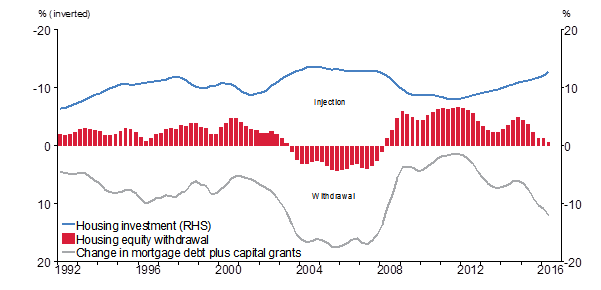
Source: RBNZ, Statistics New Zealand, Housing New Zealand, REINZ.
The reduced tendency to take on debt secured against the rise in the value of housing wealth has meant that we have not witnessed a rise in household indebtedness to quite the same extent that occurred prior to the crisis - at least not until very recently. New Zealand household debt rose from 60 percent of household disposable income in 1990 to 100 percent in 2000 and 160 percent in 2008 (figure 11). Post GFC, it then declined modestly in relation to income but has risen again recently, reaching 165 percent of household income in June 2016. Australia has exhibited a similar but slightly higher household debt track. In both countries, the ratios to income have been affected by commodity price movements, initially favourably and then negatively by lowering entrepreneurial incomes. The ratios to wealth are less affected.
Figure 11: Household debt and wealth
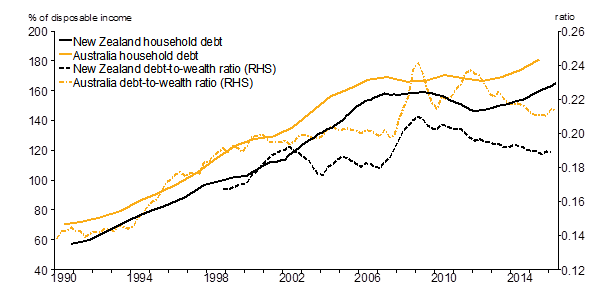
Source: RBNZ, Haver Analytics.
What might we infer from this broad stabilisation in debt levels for consumption and aggregate demand relative to the period leading up to the GFC? On its own, it doesn't portend a significant tendency towards deleveraging. On the other hand, given the very large house price and wealth movements observed, the increase in household debt appears more modest relative to the previous cycle. This is consistent with the observed increase in saving, in part indicating greater caution on the behalf of households. Even when compared with financial wealth alone, household debt declined after the GFC, only increasing very recently.
Undoubtedly, financial liberalisation and persistently lower nominal interest rates have supported greater debt accumulation, and this appears a marked phenomenon of the 1990s-2000s. The trend in debt levels appears to have plateaued, although the very recent observations make this less clear (household credit growth ran at 8.5 percent annually in the three months to August 2016).
Nevertheless, the concern from a financial stability viewpoint is a high concentration of debt in the housing market, particularly when house prices are significantly over-stretched against conventional metrics, such as income. High and rising debt levels amongst households leave them increasingly vulnerable to a deterioration in economic conditions or normalisation of currently-low mortgage rates.
To assess more rigorously whether the household sector has exhibited lower consumption out of wealth than it did during the "excessive" 2000s, we have undertaken some updated econometric modelling.23 The new work includes improved measures of household wealth and data since the GFC. We estimate the long-run per-capita relationship between the level of consumption and the levels of housing and financial wealth and income from 1986 to 2016, and then examine the estimates for stability (or structural change).24
The relationship is estimated using a split sample before and after 2005 where the housing market and housing equity withdrawal was near its peak. The parameter on income and housing fell by 32 percent and 50 percent respectively since 2005, while the parameter on financial wealth increased25. This implies that for any given increase in income or housing wealth, consumption increases by less, indicating more cautious consumer behaviour since the mid-2000s.26 The change in behaviour may reflect a reassessment of expected future capital gains from different forms of wealth following the crisis, particularly given heightened uncertainty in the housing market, and greater precaution about the stability or durability of income growth.
How has the increase in saving affected inflation and monetary policy?
In the standard New Keynesian model, monetary policy responds to shocks that affect inflation by setting interest rates to influence the gap between actual economic activity and its long run, sustainable level. When the level of output is below potential and inflation is falling, as it is currently for most advanced economies,27 a reduction in interest rates accelerates investment and consumption, bringing forward spending from future periods to raise output.
This orthodoxy assumes that current demand conditions and real interest rates are low for temporary reasons rather than reflecting any long-term structural shift in demand or productivity growth that would deter consumers and investors from responding to lower policy-induced interest rates. Strong forms of the secular stagnation hypothesis would argue that an interest rate adjustment is ineffective in inducing an inter-temporal shift in demand when consumers and investors anticipate, let alone experience, near-zero long-run interest rates. A weaker form would acknowledge that the neutral real interest rate has fallen transitorily, requiring a lower policy rate than previously - a complication for economies close to or at the zero lower bound.
In New Zealand, there are a couple of reasons why the secular stagnation hypothesis appears unsupported. Potential output growth has substantially recovered from cyclical lows and has not inhibited actual GDP growth to the extent that it has in many other advanced economies. In saying that, potential output growth has still been slower in the current cycle relative to the previous two (figure 12), consistent with some reduction in the neutral interest rate. This is largely due to a much weaker contribution from total factor productivity and growth in the capital stock relative to the past two cycles. Much of the improvement in potential GDP in the current cycle is accounted for by the growth in labour supply owing to greater labour force participation and high net immigration. New Zealand is not currently exhibiting signs of a demographic slowdown that is besetting many advanced economies (population growth in the year to June 2016 was 2.1 percent).
Figure 12: Contribution to annual potential GDP growth in recent business cycles
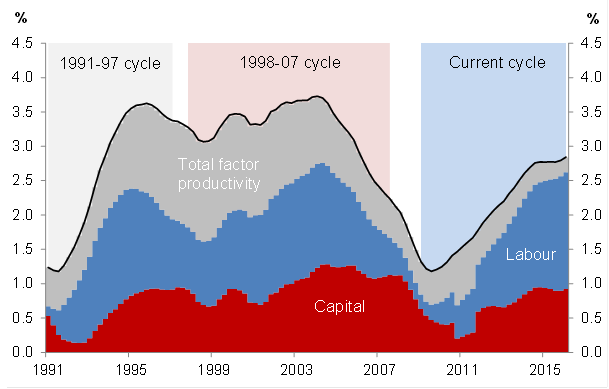
Source: RBNZ.
Secondly, there is no strong evidence to suggest that aggregate demand growth is less responsive to interest rate adjustments.28 The stimulus from low interest rates appears to be supporting house prices and construction sector activity via residential investment in line with previous cycles (even after accounting for the Canterbury earthquake reconstruction).29 Construction sector activity continues to have a strong influence on the output gap. Although consumption growth per capita has been weaker than projected since 2013, this is partly explained by exaggerated expectations rooted in the housing cycle of the early 2000s. We have observed a lower propensity to consume out of housing wealth and an increase in household saving to more moderate levels since the GFC. With hindsight, it appears over-optmistic to have extrapolated the experience of the 1990s and early 2000s when debt accumulation and consumption out of wealth was exorbitant.
As we have explained elsewhere (McDermott, 2016), New Zealand's very low inflation has reflected negative traded goods inflation over the past 5 years. Non-tradables inflation has been slightly lower than expected, largely due to more rapid growth in supply capacity (and especially labour supply) than projected. That said, projections of demand arising from historical estimates of consumption from wealth have been over-optimistic, contributing to downward revisions to forecasts of the output gap. Weaker spending than expected out of wealth is part of the reason why inflation has been lower than forecast. We have been gradually incorporating the weaker relationship between consumption and housing wealth in our projections in recent Monetary Policy Statements, as our understanding of household behaviour has improved.
Conclusion
A number of hypotheses are available to help explain the persistently low economic growth in the advanced economies since the GFC. Secular stagnation in aggregate demand associated with excess saving and a long-term decline in the real neutral rate of interest is favoured by some. Prolonged - but nonetheless temporary - adjustment to debt overhang is an alternative proposition.
In my speech today, I've contrasted Australian and New Zealand debt and household dynamics with those observed in other advanced economies. Since the GFC, Australasia has witnessed a moderation in debt accumulation, a return to historical (pre-2000) saving behaviour, and steady output growth. Saving appears to have risen more sharply amongst the most heavily-indebted households. While house price inflation has been strong and housing credit growth robust, this appears to reflect portfolio adjustment - an asset price response to low interest rates - and rapid population growth. This cycle has not seen the pattern of equity withdrawal that characterised the excessive growth in leverage of the early 2000s. Modelling suggests that the elasticity of household spending in response to housing wealth has moderated since 2005.
Overall, the developments in Australia and New Zealand are more consistent with a debt overhang hypothesis, a laRogoff, than secular stagnation, a la Summers. Moreover, rather than indicating a new low-growth paradigm, they tend to imply that extrapolations of high growth expectations from the 2000s were misplaced. High investment and consumption growth rooted in low world interest rates generated by increased savings primarily from Asian countries, and especially China, temporarily boosted growth and asset markets. In Australasia, the current outlook looks a lot like that which prevailed before the 2000s. In other advanced economies, weak investment growth coupled with a disappointing expansion in the supply side of the economy points to a world more consistent with lower long-term growth expectations.
We have been taking into account the change in household behaviour in our modelling of inflation and our policy settings. Allowing for the increase we have seen, the links between interest rates, output and inflation appear stable. Nonetheless we will be attentive that such developments are not foreshadowing any greater or longer term change in household preferences. Currently, we are projecting per-capita consumption growth to improve and provide an impetus to output growth. The acceleration is modest compared to the previous cycle as household saving is expected to remain positive over the forecast horizon. Despite robust domestic growth, slow growth in many other advanced economies suggests that global disinflationary pressures will continue to act as a headwind as we endeavour to deliver domestic inflationary outcomes consistent with the midpoint of our target band.
References
Buttiglione, L., Lane, P., Reichlin, L., & Reinhart, V. (2014). "The 16th Geneva Report on the world economy: Deleveraging, what deleveraging?" International Center for Monetary and Banking Studies/Center for Economic Policy Research.
Carroll, C. D., Otsuka, M., & Slacalek, J. (2011). "How large are housing and financial wealth effects? A new approach." Journal of Money, Credit and Banking, 43(1), 55-79.
De Veirman, E., & Dunstan, A. (2008). "How do housing wealth, financial wealth and consumption interact? Evidence from New Zealand." RBNZ Discussion Paper, DP2008/05.
Dynan, K. E., & Kohn, D. L. (2007). "The rise in US household indebtedness: Causes and consequences." Finance and Economics Discussion Series Divisions of Research & Statistics and Monetary Affairs Federal Reserve Board, Washington, D.C.
Finlay, R., & Price, F. (2014). "Household saving in Australia." RBA Research Discussion Paper, RDP 2014-03.
Holston, K., Laubach, T., & Williams, J. (2016). "NBER International Seminar on Macroeconomics July 2016: Measuring the natural rate of interest: International trends and determinants." Journal of International Economics (Elsevier).
Hunt, K. (2014). "Household debt: a cross-country perspective." RBNZ Bulletin, 77(4)
IMF (2009). "Crisis and Recovery." World Economic Outlook (Apr 2009).
IMF (2014). "Recovery Strengthens, Remains Uneven." World Economic Outlook (Apr 2014).
IMF (2016). "Subdued Demand, Symptoms and Remedies." World Economic Outlook (Oct 2016).
Kaplan, G., Mitman, K., & Violante, G. L. (2016). "Non-durable Consumption and Housing Net Worth in the Great Recession: Evidence from Easily Accessible Data." National Bureau of Economic Research, No. w22232.
Kent, C. (2015). "Monetary Policy Transmission - What's Known and What's Changed." RBA speech delivered on 15 Jun 2015.
Lo, S. H., & Rogoff, K. (2015). "Secular stagnation, debt overhang and other rationales for sluggish growth, six years on." BIS Working Papers,No. 482.
McDermott, J. (2016). "Understanding low inflation in New Zealand." RBNZ Speech delivered on 11 Oct 2016.
Rachel, L., & Smith, T. (2015). "Secular drivers of the global real interest rate." Bank of England staff working paper, No. 571.
Reinhart, C. M., & Rogoff, K. S. (2010). "Growth in a time of debt (digest summary)." American Economic Review,100(2), 573-578.
Schwartz, C., Hampton, T., Lewis, C., & Norman, D. (2006). "A Survey of Housing Equity Withdrawal and Injection in Australia." RBA Research Discussion Paper, RDP2006-08.
Smith, M. (2006). "What do we know about equity withdrawal in New Zealand." RBNZ Workshop (14 Nov 2006): Housing, Savings, and the Household Balance Sheet, Wellington.
Summers, L. H. (2013). "Why stagnation might prove to be the new normal." Financial Times, 15.
Summers, L. H. (2016). "Age of Secular Stagnation: What It Is and What to Do about It." The Foreign Affairs, 95, 2.
Vink, M. (2016). "Intergenerational developments in household saving behaviour." New Zealand Economic Papers,50(1), 3-28.
Wong, M. (forthcoming). "An assessment of the consumption-wealth effect in New Zealand." RBNZ Analytical Note.
1 'Saving' in this speech refers to the national accounts definition of income less expenditure.
2 Holston, Laubach and Williams (2016)
3 Summers (2013; 2016)
4 Reinhart and Rogoff (2010); Lo and Rogoff (2015)
5 Estimates for potential growth in advanced economies for the period 2016-2021 have fallen by 0.4 percentage points over the past two years, reflecting both lower factor growth and lower total factor productivity growth (IMF, 2016).
6 The expansions correspond to periods following global recessions, as identified by IMF (2009), while also including the dot-com crash of 2001 that coincided with mild recessions in many advanced economies.
7 Investment profitability appears to have declined since the crisis and the spread between equity and sovereign bond returns has widened, implying rising risk premia (IMF, 2014).
8 Rachel and Smith (2015) provide a comprehensive exposition of the multiple hypotheses for the decline in the global long-run real interest rate through shifts in the saving and investment schedules, generally treating the changes as enduring. They evaluate the estimated 450 basis point fall in the long-run real rate of interest since the 1980s with 100 basis points due to lower trend growth, 140 basis points through reduced investment demand and 160 basis points through shifts towards higher saving. They observe that in advanced economies lower investment demand appears to play a larger role, while in emerging market economies the shift upwards in saving preferences is larger.
9 Source: OECD.
10 Kaplan, Mitman and Violante (2016) estimates that a 30 percent decline in house prices was reflected in a 3.1 percent decline in nondurables consumption from 2007 to 2011. Kaplan et al. (2016) find no effect of initial debt levels on consumption.
11 Source: Bank of International Settlements.
12 We focus on changes in the household debt-to-GDP ratio rather than the level given measurement and institutional differences as discussed in Hunt (2014).
13 The share of construction investment relative to potential output in New Zealand has increased by 3 percentage points since the crisis.
14 Other advanced economies include: Australia, Czech Republic, Denmark, Hong Kong (SAR), Iceland, Israel, Korea, New Zealand, Norway, Singapore, San Marino, Sweden, Switzerland, Taiwan (Province of China). The pre-crisis period is 1990 to 2005.
15 Access to the data used in this study was provided by Statistics New Zealand under conditions designed to give effect to the security and confidentiality provisions of the Statistics Act 1975. The results presented in this study are the work of the author, not Statistics New Zealand.
16 For example the aggregate household saving rate in the HES was 14 percent in 2007 and 26 percent in 2013, compared with national accounts estimates of -4 percent and 2 percent.
17 The analysis did not identify education-related debt. It is unclear whether this is a factor in this result.
18 A New Zealand study by Vink (2016) found that the rise in the proportion of the population in prime-saving age groups contributed only one quarter to the overall trend increase in the aggregate HES saving rate between 1984 and 2010. The remaining three quarters of the aggregate trend increase is attributable to the rise in average saving rates of successive cohorts born since 1930.
19 DTI is based on mortgage debt held against owner-occupied property. Quartiles are based on those with positive debt levels.
20 Average is calculated over the full sample from 1990.
21 Schwartz, Hampton, Lewis, and Norman (2006); Smith (2006)
22 We follow the methodology in Smith (2006) where housing equity withdrawal is defined as the change in mortgage lending plus capital grants minus housing investment. Housing investment includes residential investment in dwellings, household transfer costs, transfers of dwellings to the household sector, and net transfers of land to the household sector. Capital grants include Kiwisaver first home withdrawals and Home Start grants since their introduction in 2011. Estimated residential investment and residential insurance pay-outs relating to the Canterbury rebuild have been excluded, as the related fluctuations in equity may not represent changes in household behaviour.
23 Wong (forthcoming)
24 For details of the cointegration estimation framework, see De Veirman & Dunstan (2008). The full-period analysis suggests that a 1 percent increase in real per-capita housing wealth is associated with a 0.20 percent increase in real per-capita consumption on average, while the long-run income elasticity is 0.47 percent. The marginal propensity to consume out of housing wealth is almost twice that of financial wealth (0.12 percent), although this difference in magnitude was much lower than that found in De Veirman & Dunstan (2008).
25 The increase in the coefficient on financial wealth is difficult to interpret as it was not well defined (statistically significant) in the pre-2005 sample. In other results, excluding farm income that is highly variable, the parameter on financial wealth is more stable and statistically significant across the split samples.
26 Given potential instability in the long-run relationship, which may undermine the cointegration approach, the wealth effects are also estimated using an alternative approach developed by Carroll, Otsuka, and Slacalek (2011). The result is similar to the baseline in that the marginal propensity to consume out of housing wealth has fallen in the split sample post-2005, while it increased for financial wealth.
27 The IMF (2016) estimated an output gap of -0.8 percent (as a percentage of potential GDP) for advanced economies in 2016, improving from a trough of -3.8 percent in 2009.
28 Modelling work in the RBNZ has found the response of the output gap to an interest rate shock since the GFC is not statistically different from the pre-GFC period.
29 Similar results for Australia were reported by Kent (2015).