Highlights of global financial flows
The BIS, in cooperation with central banks and monetary authorities worldwide, compiles and disseminates data on activity in international financial markets. This chapter summarises the latest data for international banking markets, available up to June 2016, and for international debt securities, available up to September 2016. One box looks at new BIS data on positions with central counterparties, and another at China and Russia as new reporting countries to the BIS locational banking statistics.1
Takeaways
- International lending stagnated during the second quarter of 2016. While global cross-border claims rose by $489 billion between end-March and end-June 2016, intragroup activity accounted for most of the increase. On a consolidated basis, after excluding intragroup positions, banks' international claims were virtually unchanged.
- In contrast to the overall trend, claims on emerging market economies (EMEs) grew by $124 billion in Q2 2016, ending a run of three consecutive quarterly declines. The increase was led by a $61 billion rise in claims on China. Cross-border lending to the rest of emerging Asia, Middle East and Latin America also rose.
- The BIS consolidated banking statistics (CBS) point to a gradual shift in the composition of international interbank credit across regions over the past year. The share of international lending to banks in advanced economies rose by 4 percentage points, while international lending to banks in EMEs dropped by 3 percentage points.
- International debt securities issuance by EMEs was $57 billion (21%) lower in the third quarter of 2016 compared with the second quarter, but 75% higher with respect to the third quarter of 2015.
- The trend towards greater use of the euro as a funding currency slowed in the third quarter, as dollar issuance by financial institutions resumed and reached a record high.
- New data on central counterparties (CCPs) show that central clearing has made significant inroads in over-the-counter (OTC) interest rate derivatives markets but is less entrenched in other segments. Box A examines these trends.
- As of December 2016, the BIS locational banking statistics (LBS) provide a finer breakdown of the non-bank sector and inter-office transactions by individual counterparty country. Further, China and Russia have recently begun contributing to the BIS LBS. Box B presents the new data from these two countries.
Recent developments in the international banking market
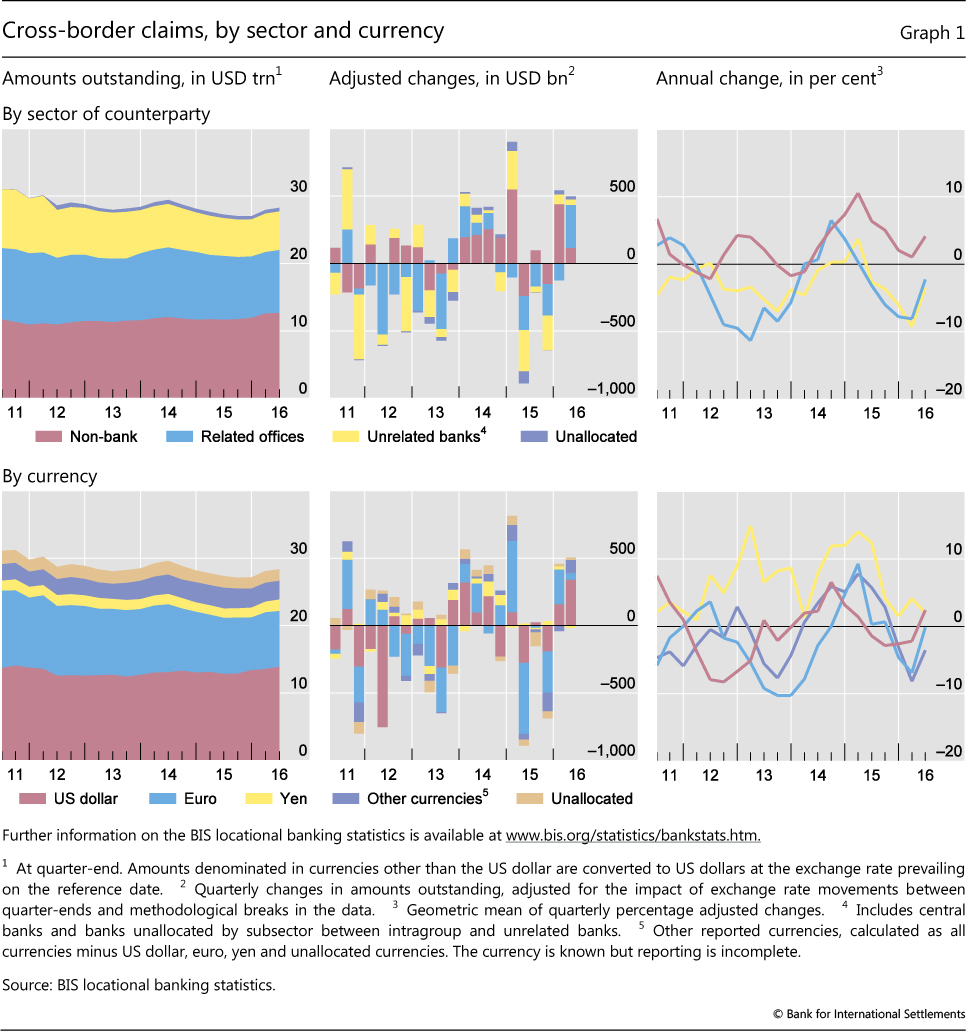
International bank lending stagnated during the second quarter of 2016. Even though cross-border claims rose by $489 billion during Q2 2016, the BIS LBS2 reveal that the majority of the increase was driven by intragroup activity. At end-June 2016, cross-border claims stood at $28.4 trillion, up $125 billion from a year earlier.3
In terms of currencies, the aggregate rise in unconsolidated cross-border lending was primarily driven by a $340 billion increase in US dollar-denominated claims (Graph 1, bottom panels). Cross-border lending in euros grew by $48 billion. In addition, BIS reporting banks extended more cross-border credit denominated in sterling ($40 billion) and Swiss francs ($32 billion). By contrast, cross-border claims denominated in yen saw a $16 billion decline.
According to the BIS CBS4 on an immediate counterparty basis, international claims5 on banks actually fell slightly, from $4,255 billion to $4,245 billion, while international claims on the non-bank private sector rose from $8,553 billion to $8,602 billion during the same period.
Divergent trends in consolidated and unconsolidated interbank lending
The divergent trends in the consolidated and unconsolidated data reflect a sizeable increase in cross-border positions within banking groups. Cross-border claims on banks, which in the LBS capture positions with related offices as well as with other banks, climbed by $351 billion in the second quarter of 2016. While this represented the largest quarterly increase since the same quarter in 2010, the annual growth rate of cross-border interbank claims remained in negative territory, at -3% in the year to end-June 2016. More than 90% of the quarterly rise in interbank claims was due to a rise in claims on related offices (Graph 1, top panels).6 For stocks of both claims and liabilities, the intragroup subsector accounted for about 60% of all outstanding interbank cross-border positions in mid-2016.
With respect to the recipients of interbank funding, cross-border claims on banks in Germany expanded the most. A rise in euro-denominated claims fuelled the $80 billion increase. Cross-border claims on banks in the United Kingdom (+$62 billion) and the United States (+$46 billion) also grew, mainly driven by US dollar-denominated positions.
Turning to the lenders, banks in the United Kingdom reported the highest increase in cross-border interbank claims (+$128 billion), followed by banks in Japan (+$80 billion) and the United States (+$69 billion). US dollar-denominated claims on related offices dominated the rise in interbank credit reported by banks in Japan (55%) and the United States (86%). By contrast, cross-border inter-office transactions denominated in euros accounted for about 60% of the overall increase in cross-border interbank lending reported by banks in the United Kingdom.
The CBS reveal a gradual shift in the composition of international interbank credit across regions during the past year. Claims on banks in advanced economies (as a share of global interbank claims) rose by 4 percentage points, accounting for 72% of all international interbank claims in mid-2016. Over the same period, the share of international lending to banks in EMEs contracted by 3 percentage points, to 21% of the total, as a result of three consecutive quarterly declines. International interbank claims on offshore centres made up 7% as end-June 2016, slightly below the 8% reported a year earlier.
More cross-border lending extended to the non-bank sector
Cross-border claims on non-banks, as reported to the LBS, rose by $115 billion between end-March and end-June 2016 (Graph 1, top panels). This aggregate number masks significant variation across instruments. While banks extended more credit to non-banks in terms of cross-border loans (+$166 billion), their debt securities holdings fell by $104 billion.
The $115 billion non-bank increase in the second quarter of 2016 resulted from a $141 billion rise in claims on non-bank financial institutions, and a $34 billion fall in lending to the non-financial sector. In mid-2016, claims on the non-bank financial sector accounted for about 39% of all non-bank claims, while claims on non-financial entities captured about half. For cross-border liabilities, these shares amounted to 48% and 39%, respectively. Residual shares accrue to a category of unallocated positions vis-à-vis non-banks.
Cross-border lending to EMEs picks up
The second quarter of 2016 saw a substantial rise in cross-border lending to EMEs, in parallel with high levels of international debt securities issuance (as discussed below). According to the LBS, cross-border claims on EMEs rose by $124 billion (Graph 2, top panels). However, this only partially offset the $372 billion drop that took place during the previous three quarters. The outstanding stock of cross-border claims on EMEs was $3.6 trillion at end-June 2016, down 7% from a year earlier and well below its mid-2014 peak of $3.9 trillion. All major EME regions, with the exception of emerging Europe, shared in the latest quarterly increase.
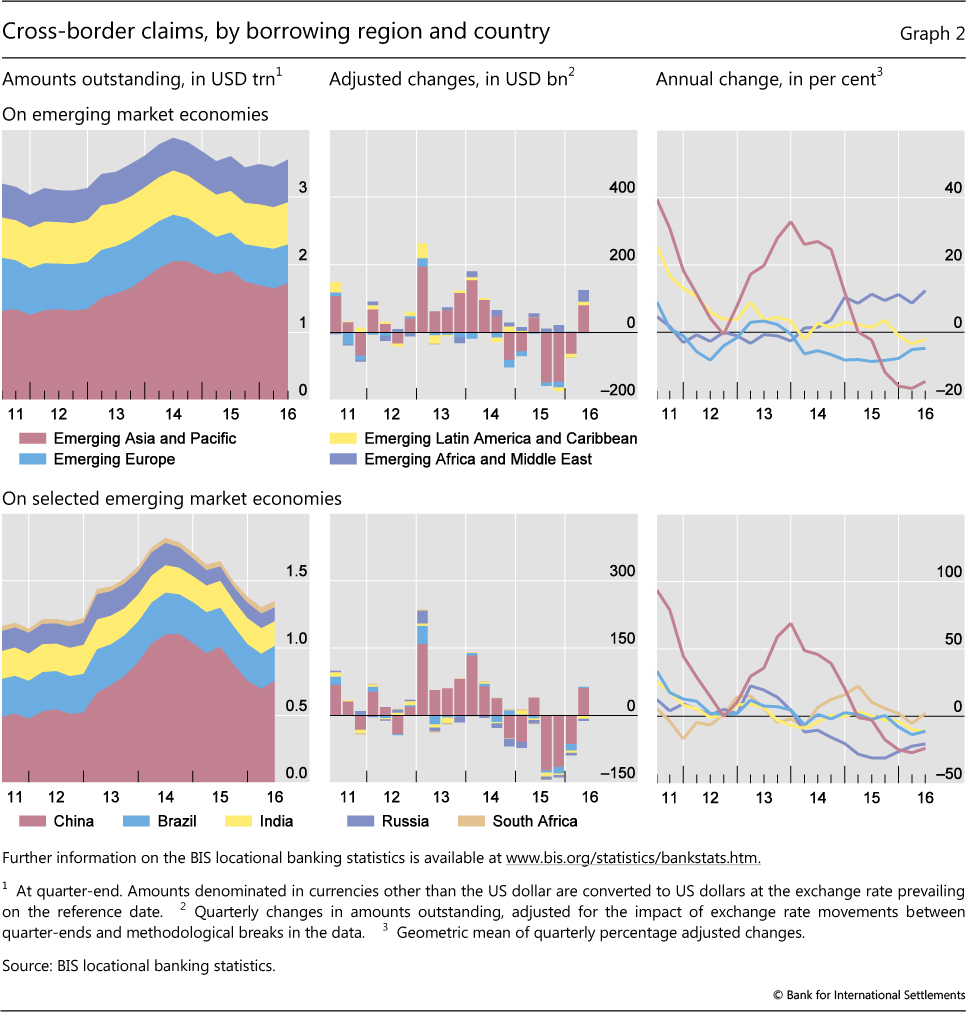
The $61 billion rise in cross-border lending to China dominated the $80 billion expansion in lending to emerging Asia. Despite this recent strength, claims on China and emerging Asia remained well below the levels observed a year ago (by 24% and 15%, respectively). The picture for other major economies in emerging Asia varied markedly. Korea (+$11 billion), Thailand and Pakistan (+$3 billion each) saw an increase in cross-border claims on their residents. By contrast, lending to India contracted by $7 billion, down 11% in the year to end-June 2016. Since the first quarter of 2015, cross-border claims on India fell by a cumulative $27 billion, taking the outstanding stock to $182 billion as of mid-2016.
Cross-border lending to Latin America and the Caribbean grew by $10 billion Most of this reflected higher claims on Mexico (+$7 billion), Brazil and Ecuador (+$2 billion each).
Lending to emerging Europe contracted by $2 billion during Q2 2016. At $578 billion outstanding, cross-border claims were 4.7% below the levels observed a year earlier. Regional developments, however, varied considerably across individual countries. Cross-border lending to Russia dropped by another $5.3 billion in the second quarter, to just $103 billion outstanding, down from a peak of $189 billion at end-March 2013. This latest quarterly drop took the annual rate of decline to -21%. Cross-border lending to Romania also saw a $1.2 billion decline. By contrast, cross-border claims on Poland and the Czech Republic expanded by $1.7 billion and $1.6 billion, respectively. Cross-border lending to residents of Turkey also grew, by $1.3 billion in Q2 2016, or 3% in the year to end-June 2016.
The latest $35 billion quarterly rise in cross-border lending to Africa and the Middle East pushed the annual growth rate to 12% and the outstanding total to its highest level on record ($ 632 billion). The overall expansion was led by a rise in cross-border claims on oil exporters, including the United Arab Emirates (+$16 billion), Saudi Arabia (+$9 billion) and Qatar (+$4 billion). These developments coincided with increased international debt securities issuance by borrowers from those countries (see below). The CBS on an immediate counterparty basis indicate that banks incorporated in France, Japan, Italy and the United Kingdom were the largest providers of international credit to residents of Africa and the Middle East.
International debt securities issuance reverts to dollars
International debt securities issuance during the third quarter of 2016, at $1.4 trillion, was 10% lower than in the previous quarter.
Borrowers in advanced economies issued $150 billion on net over the third quarter, a 40% increase, with less gross issuance but an unusually low level of repayments (Graph 3, left-hand panel). Net issuance for the first nine months of 2016 is now well ahead of its pace in 2015, and indeed is at its highest level since 2009.
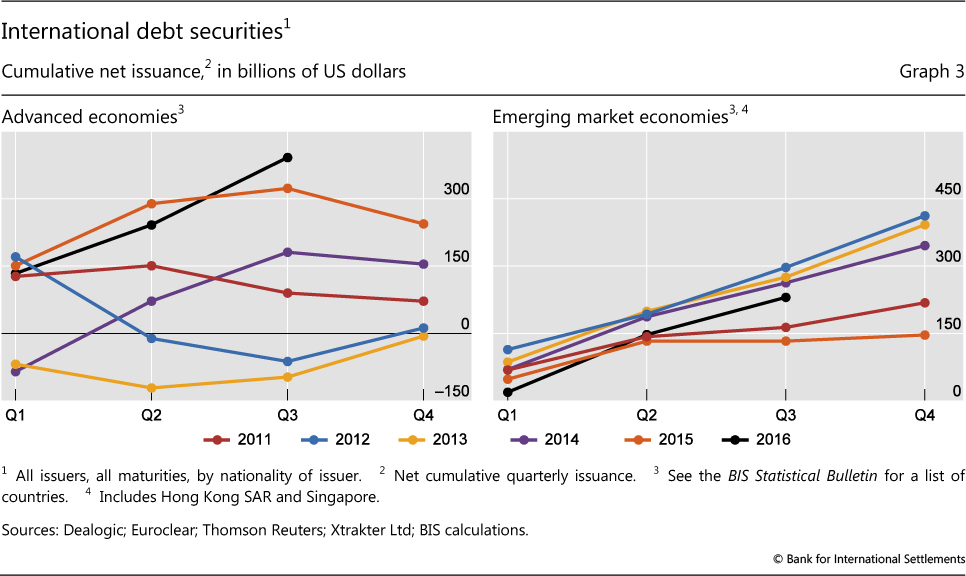
In EMEs, net borrowing on international securities markets in Q3, at $83 billion, was 35% below that of the previous quarter, when the issuance volume was unusually large. Cumulative EME debt issuance during the first three quarters of the year was 73% higher than that in the first three quarters of 2015, though it still lagged the rapid pace of issuance seen in each of the three years up to 2014 (Graph 3, right-hand panel).
The lower EME net issuance figure in the third quarter largely resulted from weaker government borrowing. In particular, sovereign borrowing by oil producers slowed. However, this anticipated a record $17.5 billion sovereign bond issue by Saudi Arabia in October and followed an extraordinary issuance level in the second quarter, which had been fostered by the fiscal needs of oil exporters (mostly Oman, Qatar, and the United Arab Emirates) in response to low oil prices. Debt issuance by private financial and non-financial companies in EMEs recovered strongly in the third quarter after the turbulent beginning of the year.
The trend towards greater use of the euro as a funding currency was interrupted in the third quarter (Graph 4). International issuance in euros fell to $351 billion, the lowest value in the last 13 years. This was particularly evident in the borrowing patterns of financial and non-financial firms in the euro area (upper right-hand panel).
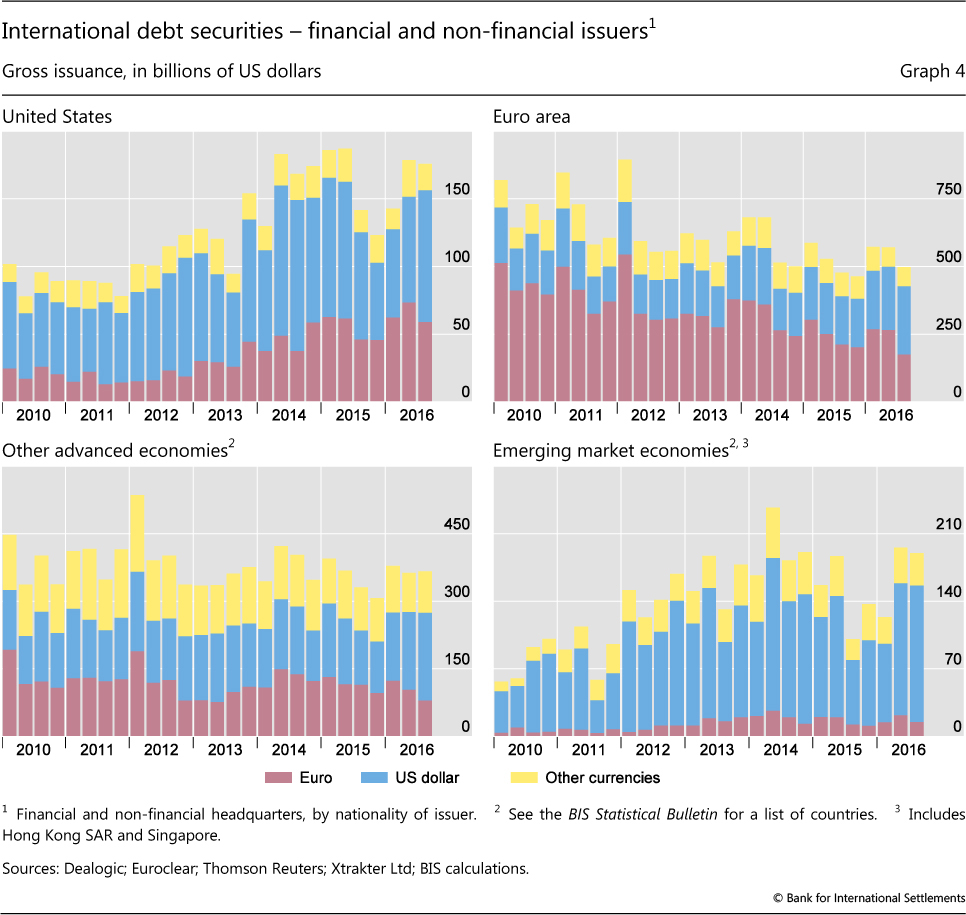
At the same time, issuance in US dollars reached a record value of $792 billion. Dollar borrowing was supported by the widening of US dollar Libor, mostly resulting from the regulatory change in the prime money market fund industry in the United States.7 This hindered the supply of short-term dollar funding for European and Japanese banks and pushed them to borrow through longer-term instruments.
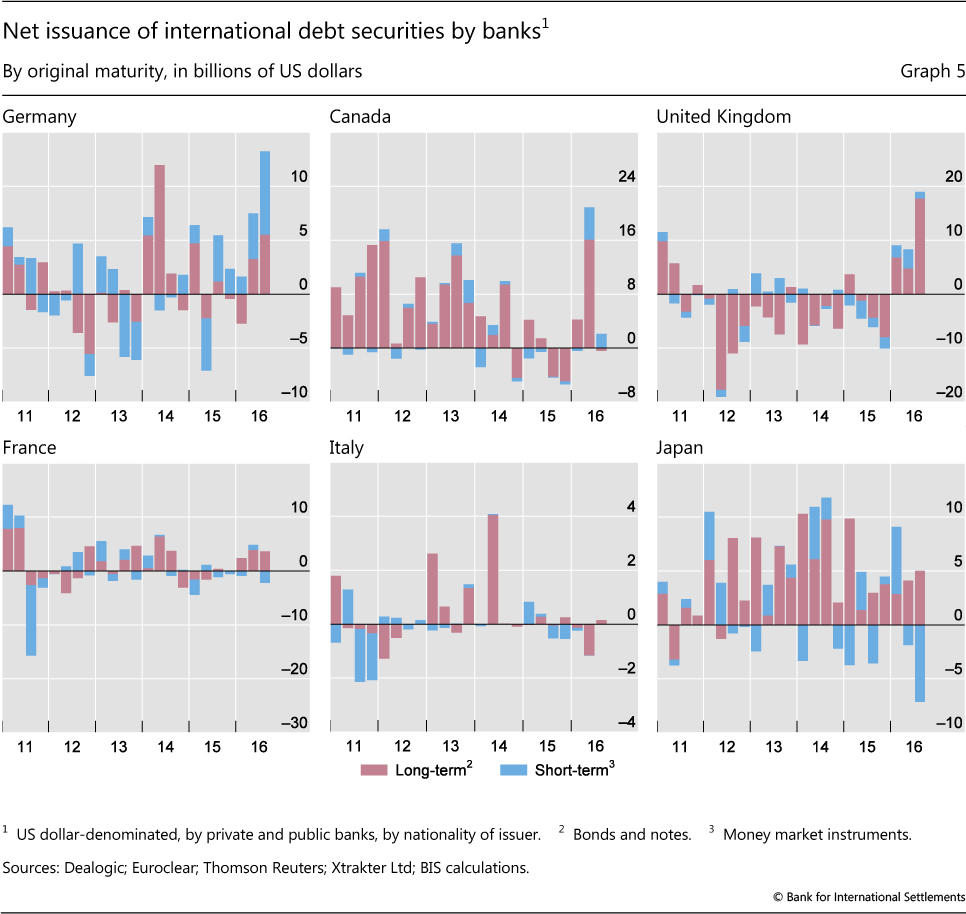
Partly reflecting funding shifts related to the money market reform, total euro-denominated borrowing by financial firms in the third quarter was the lowest in the last nine years, while US dollar-denominated borrowing was the highest. German, French, Canadian and UK banks have increased their net borrowing of international debt securities in 2016 (Graph 5). Banks from these countries issued on net $90 billion of dollar-denominated short and long-term securities on international markets in the first three quarters of 2016, compared with net repurchases of $25 billion in the whole of 2015. Most of these issues were bonds and notes (including medium-term notes, red bars), though German banks also made use of shorter-term money market instruments (blue bars). Japanese and Italian net borrowing patterns were little changed in aggregate, though Japanese banks redeemed a relatively large volume of short-term instruments in the third quarter.
To some extent, the shift from the euro to the dollar in the third quarter may also have arisen because of changes in the relative costs of borrowing in the two currencies across countries. The widening cross-currency basis and higher dollar funding costs made it relatively more expensive for US nationals to issue in foreign currencies such as the euro and then swap the proceeds back into dollars. At the same time, it became relatively cheaper for foreign nationals to borrow in the US dollar debt markets and swap the proceeds back into local currencies.
Box A
Central clearing predominates in OTC interest rate derivatives markets
New BIS data show that central clearing has made significant inroads into over-the-counter (OTC) interest rate derivatives markets but is less prevalent for other OTC derivatives. Central clearing is a key element in authorities' agenda for reforming OTC derivatives markets to reduce systemic risks. As of end-June 2016, 75% of dealers' outstanding OTC interest rate derivatives contracts were against central counterparties (CCPs), compared with 37% for credit derivatives and less than 2% for foreign exchange and equity derivatives. Overall, 62% of the $544 trillion in notional amounts outstanding reported by dealers was against CCPs, and 41% of the $21 trillion in gross market value.
In the BIS OTC derivatives statistics, data on CCPs were previously collected only for credit default swaps (CDS), whereas starting from end-June 2016 CCPs were separately identified for all types of OTC derivatives. Dealers report their outstanding positions in terms of notional amounts, which provide a measure of the aggregate amount of risk that they transfer from other counterparties to CCPs, as well as market values, which provide a measure of their counterparty exposure to CCPs. While outstanding positions against CCPs are not synonymous with the proportion of trades that are cleared through CCPs - known as the clearing rate - the former can be adjusted to approximate the latter. In the OTC derivatives statistics, a trade between two dealers that is subsequently novated to a CCP is captured twice: each dealer reports an outstanding position against the CCP. Therefore, under the extreme assumption that all positions with CCPs were initially inter-dealer contracts, a lower bound on the clearing rate can be estimated by halving outstanding positions against CCPs. Inter-dealer trades novated to CCPs would thereby be counted only once.
 However, this underestimates the significance of clearing because an (unknown) portion of cleared trades are not between dealers and thus not double-counted in the BIS statistics. Moreover, CCPs' share of outstanding positions is lower than their share of trades because compression is more common for cleared trades.
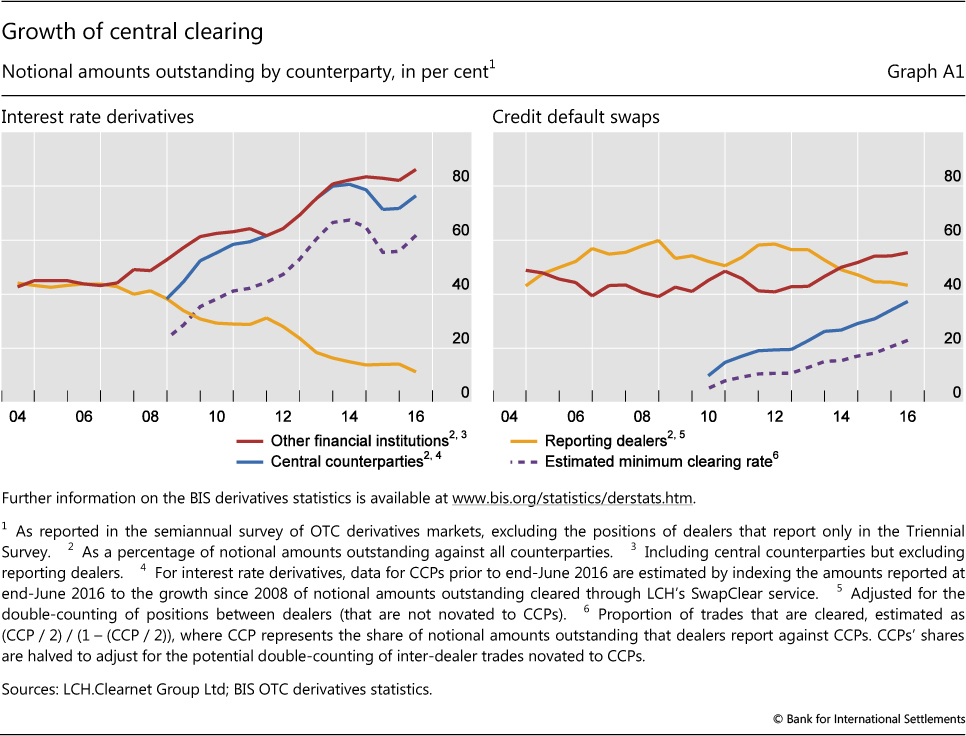
While comprehensive data on central clearing are available only from end-June 2016, the share of outstanding positions with other financial institutions - with which CCPs were previously grouped indistinguishably - can be used to approximate the pace of the shift in activity towards CCPs. For OTC interest rate derivatives, this share has been climbing steadily since 2007, from 44% of notional principal at end-June 2007 to 86% at end-June 2016 (Graph A1, left-hand panel). In contrast, the inter-dealer segment declined markedly in importance over this period, from 43% to 11%. These opposing trends were probably driven in part by the novation of inter-dealer contracts to CCPs. Using data from LCH to backdate the BIS statistics on CCPs, the clearing rate for OTC interest rate derivatives is estimated to have more than doubled between 2008 and 2016; it could plausibly have tripled (Graph A1, left-hand panel).
In the OTC interest rate derivatives market, the share of notional amounts booked against CCPs was highest for forward rate agreements, at 91% at end-June 2016 (Graph A2, left-hand panel). This is equivalent to a clearing rate of at least 84%, although this is probably an underestimate. For interest rate swaps, the share booked against CCPs was 80%, which is equivalent to an estimated minimum clearing rate of 66%. However, for interest rate options, central clearing was close to zero. Across major currencies, the importance of CCPs was uniformly high, ranging from 72% for interest rate derivatives denominated in euros to 86% for those in Canadian dollars, with US dollars in between at 77% (Graph A2, right-hand panel). Among EME currencies, it was significantly lower.
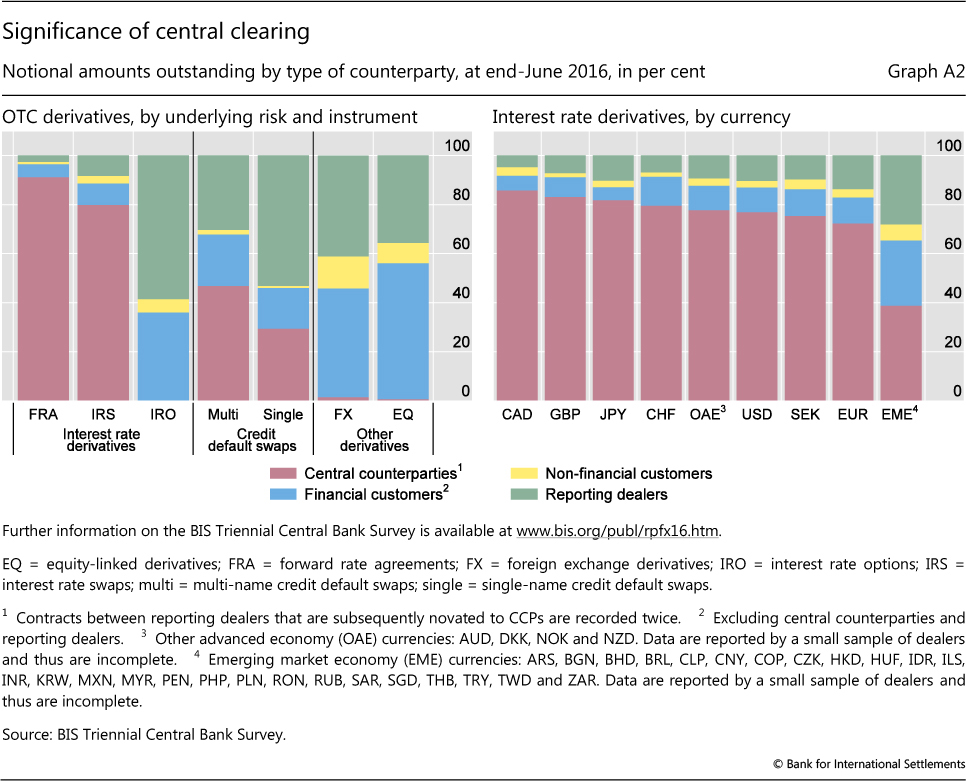
Central clearing has also gained in importance in credit derivatives markets. The proportion of outstanding CDS cleared through CCPs has increased steadily since these data were first reported, from 10% at end-June 2010 to 37% at end-June 2016. After adjusting for the potential double-counting of trades, this was equivalent to an increase in the estimated minimum clearing rate from 5% to 23% (Graph A1, right-hand panel). The share of CCPs is higher for multi-name than for single-name products: 47% versus 29% for notional amounts outstanding (Graph A2, left-hand panel). Multi-name products, which consist primarily of contracts on CDS indices, tend to be more standardised than single-name products and consequently more amenable to central clearing.
In other segments of OTC derivatives markets, central clearing was negligible. For FX derivatives, the share of outstanding notional amounts cleared through CCPs was 1.5% at end-June 2016, and for OTC equity derivatives 0.7% (Graph A2, left-hand panel). For commodity derivatives, CCPs' share is not known because a counterparty breakdown for this asset class is not collected in the BIS OTC derivatives statistics.
The relatively low shares for FX and equity derivatives are explained partly by differences in the regulations that apply to different derivatives. Regulators in most of the major derivatives markets require certain standardised OTC derivatives to be centrally cleared, particularly interest rate swaps, CDS and non-deliverable FX forwards; deliverable FX derivatives and equity derivatives are often not covered by these requirements. Also, some instruments, such as options, are currently not offered for clearing by CCPs. That said, regulators continue to expand clearing requirements, and many are also starting to require higher capital and margin for non-centrally cleared derivatives. This strengthens the incentive to move trades to CCPs. In the United States and other key markets, margining requirements began to be phased in starting in September 2016, so their impact on clearing will only become clear in future data.
See BIS, "OTC derivatives statistics at end-June 2016", statistical release, November 2016. Clearing rates published by other organisations typically refer to trading volumes, not outstanding positions, and count each trade only once. Volume-based statistics are influenced by the maturity of trades; contracts with very short maturities are captured each time the contract is rolled over during the period in which volumes are measured. For a discussion of compression, see T Ehlers and E Eren, "The changing shape of interest rate derivatives markets", BIS Quarterly Review, December 2016, pp 53-65. See Financial Stability Board, OTC derivatives market reforms: eleventh progress report on implementation, August 2016. See R McCauley and C Shu, "Non-deliverable forwards: impact of currency internationalisation and derivatives reform", BIS Quarterly Review, December 2016, pp 81-93.
Box B
China and Russia join the BIS locational banking statistics
China and Russia have started to report to the BIS locational banking statistics (LBS), taking the number of LBS-reporting countries from 44 to 46. A total of 12 EMEs now report to the LBS, along with 12 offshore financial centres and 22 advanced economies. Expanding the LBS-reporting population had been identified as a priority as part of the enhancements to the banking statistics agreed by the Committee on the Global Financial System in 2012 as well as the Data Gaps Initiative launched by the IMF and FSB in 2009 with the endorsement of the G20.
The LBS reported by China are compiled from nearly 650 deposit-taking institutions located on the mainland, while those reported by Russia are compiled from about 700 institutions. Many of these institutions are affiliates of banks headquartered abroad: the reporting banks in China represent some 35 nationalities, and those in Russia nearly 30 countries. In China, foreign banks are allowed to operate through branches or subsidiaries, but in Russia they can operate only through subsidiaries.
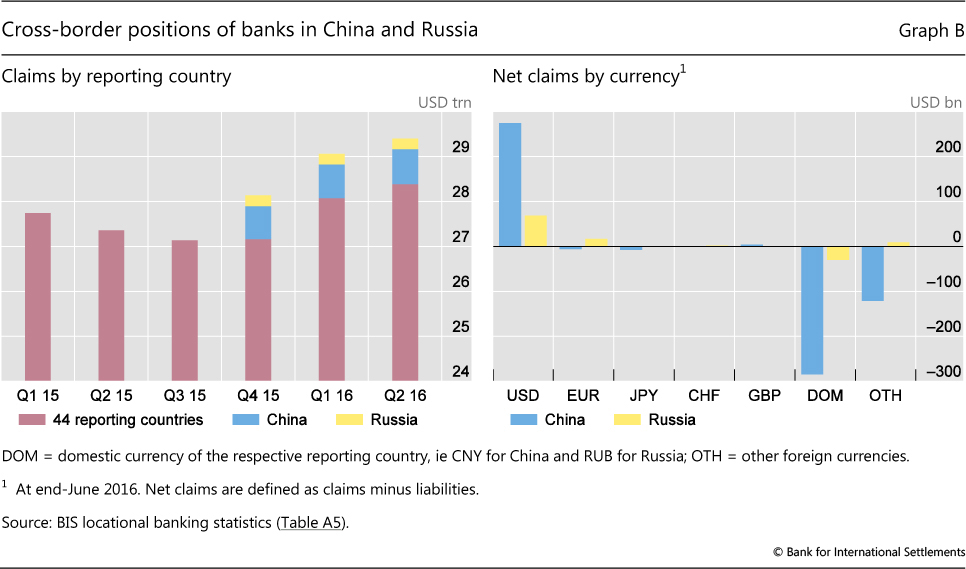
The claims and liabilities of domestic and foreign banks located in China and Russia have been included in global aggregates in the LBS since end-December 2015. At end-June 2016, banks in China reported outstanding cross-border claims of $778 billion and liabilities of $918 billion, while banks in Russia reported claims of $240 billion and liabilities of $171 billion (Graph B, left-hand panel). This makes China the 10th largest cross-border creditor in the international banking market, and Russia the 23rd largest.
The inclusion of China and Russia resulted in a 3.8% increase in the global total for LBS-reporting banks' outstanding cross-border claims at end-December 2015 and a 4.8% rise in outstanding cross-border liabilities. For some individual borrower countries, the impact was much larger. For example, the addition of China and Russia resulted in double-digit increases in the outstanding claims of LBS-reporting banks on some offshore centres and developing countries in Africa and eastern Europe. That said, the bulk of the two countries' cross-border claims was on advanced economies.
Turning to the currency composition of their cross-border claims and liabilities, at end-June 2016 banks in both China and Russia were net lenders of US dollars, with dollar claims exceeding dollar liabilities by $275 billion (claims: $549 billion; liabilities: $274 billion) and $69 billion (claims: $163 billion; liabilities: $94 billion), respectively (Graph B, right-hand panel). Domestic currency-denominated cross-border liabilities of banks in Russia were $54 billion, more than double their cross-border claims in roubles ($24 billion). However, $358 billion, or 39%, of Chinese banks' cross-border liabilities were denominated in renminbi. Renminbi-denominated cross-border claims of banks in China stood at $73 billion, much less than their cross-border liabilities.
Turning to positions with local residents, at end-June 2016 banks in Russia reported local claims of $1.1 trillion on all borrowers, equivalent to 80% of GDP and about four times greater than their cross-border claims. About 76% of these local claims were denominated in roubles, and the rest mainly in US dollars. The US dollar liabilities of banks in Russia to Russian residents exceeds their US dollar lending to residents by $18 billion. China does not yet report local positions to the BIS.
Chinese and Russian banking groups are spreading their networks globally. Chinese banks operate in more than 20 of the 46 LBS-reporting countries and Russian banks in 15 reporting countries. Based on the (incomplete) data currently reported to the BIS by LBS-reporting countries that host Chinese and Russian banks, the cross-border claims of Chinese banks, including intragroup positions, totalled about $1,480 billion at end-June 2016 and those of Russian banks about $230 billion. This makes Chinese banks the eighth largest lenders in the international banking market and Russia banks the 19th largest.
These changes were implemented after the preliminary release of the LBS for the second quarter in October 2016. Committee on the Global Financial System, Improving the BIS international banking statistics, CGFS Papers, no 47, November 2012. For more information about the LBS reported by China, see H Hu and P Wooldridge, "International business of banks in China", BIS Quarterly Review, June 2016, pp 7-8.
1 This article was prepared by Cathérine Koch (catherine.koch@bis.org) and Gianpaolo Parise (gianpaolo.parise@bis.org). Statistical support was provided by Kristina Bektyakova, Swapan-Kumar Pradhan and Jana Sigutova.
2 The locational banking statistics are based on the location of banking offices and capture the activity of all internationally active banking offices in the reporting country regardless of the parent bank's nationality. Banks record their positions on an unconsolidated basis, including those vis-à-vis affiliates of the banking group in other countries.
3 Sum of quarterly changes in outstanding amounts. Quarterly changes are adjusted for the impact of exchange rate movements between the respective quarter-ends and for methodological breaks in the data series in the LBS.
4 The CBS are based on the nationality of reporting banks and are reported on a worldwide consolidated basis, ie excluding positions between affiliates of the same banking group. Banks consolidate their inter-office positions and report only their claims on unrelated borrowers without providing a currency breakdown. As a consequence, exchange rate-adjusted changes are not available in the CBS.
5 International bank claims are the sum of banks' cross-border claims and their local claims denominated in foreign currencies.
6 As of this release, covering data up to the second quarter of 2016, the BIS LBS provide a more detailed breakdown of inter-office positions by counterparty country. They also provide a finer sectoral breakdown, splitting the non-bank sector by individual counterparty country into a non-bank financial and non-financial component (see next section).
7 See "A paradigm shift in markets?", BIS Quarterly Review, December 2016.