The costs of deflations: a historical perspective
Concerns about deflation - falling prices of goods and services - are rooted in the view that it is very costly. We test the historical link between output growth and deflation in a sample covering 140 years for up to 38 economies. The evidence suggests that this link is weak and derives largely from the Great Depression. But we find a stronger link between output growth and asset price deflations, particularly during postwar property price deflations. We fail to uncover evidence that high debt has so far raised the cost of goods and services price deflations, in so-called debt deflations. The most damaging interaction appears to be between property price deflations and private debt.1
JEL classification: E31, E32, N10.
Concerns about deflation - falling prices of goods and services - have loomed large in recent policy discussions. The debate is shaped by the deep-seated view that deflation, regardless of context, is an economic pathology that stands in the way of any sustainable and strong expansion.
The almost reflexive association of deflation with economic weakness is easily explained. It is rooted in the view that deflation signals an aggregate demand shortfall, which simultaneously pushes down prices, incomes and output. But deflation may also result from increased supply. Examples include improvements in productivity, greater competition in the goods market, or cheaper and more abundant inputs, such as labour or intermediate goods like oil. Supply-driven deflations depress prices while raising incomes and output.
And even if deflation is seen as a cause, rather than a symptom, of economic conditions, its effects are not obvious. On the one hand, deflation can indeed reduce output. Rigid nominal wages may aggravate unemployment. Falling prices raise the real value of debt, undermining borrowers' balance sheets, both public and private - a prominent concern at present given historically high debt levels. Consumers might delay spending, in anticipation of lower prices. And if interest rates hit the zero lower bound, monetary policy will struggle to encourage spending. On the other hand, deflation may actually boost output. Lower prices increase real incomes and wealth. And they may also make export goods more competitive.2
The bottom line is that, whether deflation is seen as symptom or cause, its cost is ultimately an empirical question. As a symptom, it depends on its underlying drivers; as a cause, on the relative strength of various channels.
Moreover, while the impact of goods and services price deflations is ambiguous a priori, that of asset price deflations is not. As is widely recognised, asset price deflations erode wealth and collateral values and so undercut demand and output. Yet the strength of that effect is an empirical matter. One problem in assessing the cost of goods and services price deflations is that they often coincide with asset price deflations. It is possible, therefore, to mistakenly attribute to the former the costs induced by the latter.
Data limitations have so far made it difficult to answer these questions. In this special feature, we take a step forward based on a newly constructed data set that spans more than 140 years, from 1870 to 2013, and covers up to 38 economies. In particular, the data include information on both equity and property prices as well as on debt.
We highlight three conclusions. First, before accounting for the behaviour of asset prices, we find only a weak association between goods and services price deflations and growth; the Great Depression is the main exception. In some respects, this confirms previous work. Second, the link with asset price deflations is stronger and, once these are taken into account, it further weakens the association between goods and services price deflations and growth. Finally, we find some evidence that high private debt levels have amplified the impact of property price deflations but we detect no similar link with goods and services price deflations.
The rest of the article is organised as follows. The first section briefly reviews the historical deflation record. The second analyses the costs of deflation by considering its correlation with output growth, while the third extends the analysis to asset price deflations. The fourth section asks whether more debt in an economy has increased the costs of deflations. In conclusion, we briefly consider the implications of our findings for monetary policy, highlighting caveats when applying them to the current situation.
The deflation record
For current purposes, we define a deflation in the prices of goods and services - or "price deflation" for short - simply as a fall in the corresponding price index. This sidesteps a couple of issues. Analytically, economists make a distinction between one-off price changes, typically seen as reflecting relative adjustments (eg a fall in the price of oil), and self-sustaining rates of change. The term "deflation" is then restricted to the latter. Similarly, given its negative connotations, some would prefer to restrict the term to destabilising self-reinforcing downward wage-price spirals. Our choice reflects the practical difficulties in distinguishing one-off from self-sustaining changes and our wish to avoid prejudging the costs of deflation by incorporating them in the definition.
Pragmatically, we address the issue by distinguishing persistent from more transitory price declines. Persistent deflations should be expected to be more costly than transitory ones. We define persistent deflations as those for which the price level declines cumulatively over at least a five-year period, based on annual consumer price data.3 Using the cumulative change in the level rather than consecutive rates of change helps identify periods of persistent deflation that look through bursts of volatility in the index. Volatility was especially high during the gold standard period, given the index composition and the lack of core inflation measures.
Importantly, our sample covers a variety of monetary regimes. These include: the classical gold standard (1870-1913), in which currencies were tightly tied to gold; the interwar years (1919-38), in which countries first gradually re-established this link before abandoning it again; and the postwar era (1946-2013), in which the link was effectively absent and the authorities experimented with various arrangements that resulted in widely varying inflation rates, from the Great Inflation of the 1970s to the recent period of very low, sometimes negative, inflation. Our long sample allows us to see how far the costs of deflation depend on monetary regimes. We also consider the Great Depression (1930-33) separately, to examine whether it was sui generis (see also Box 1).4
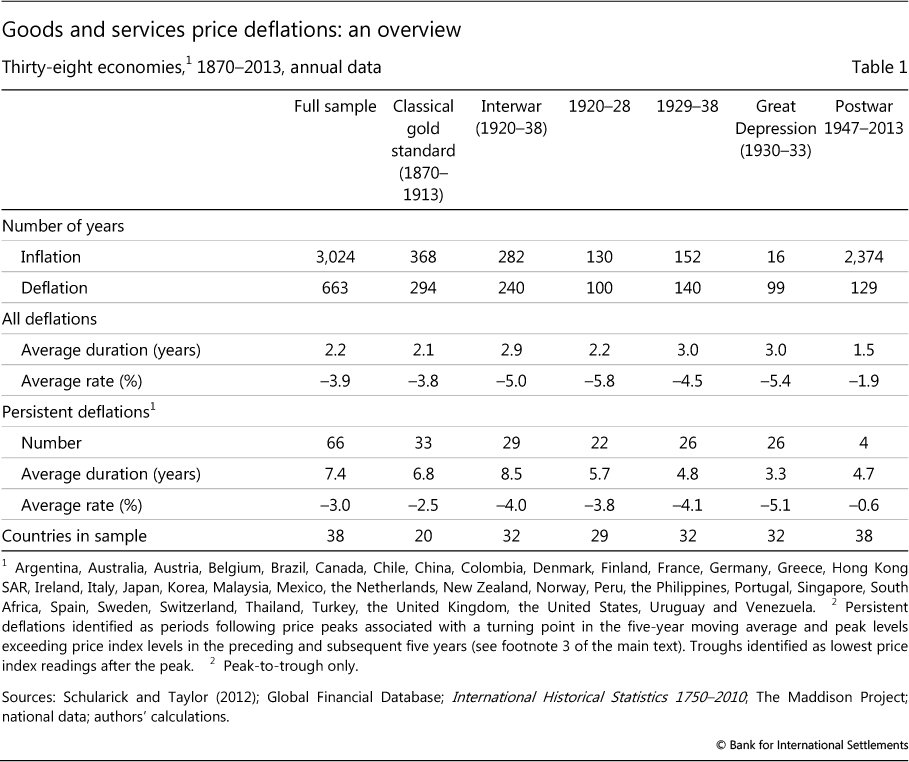
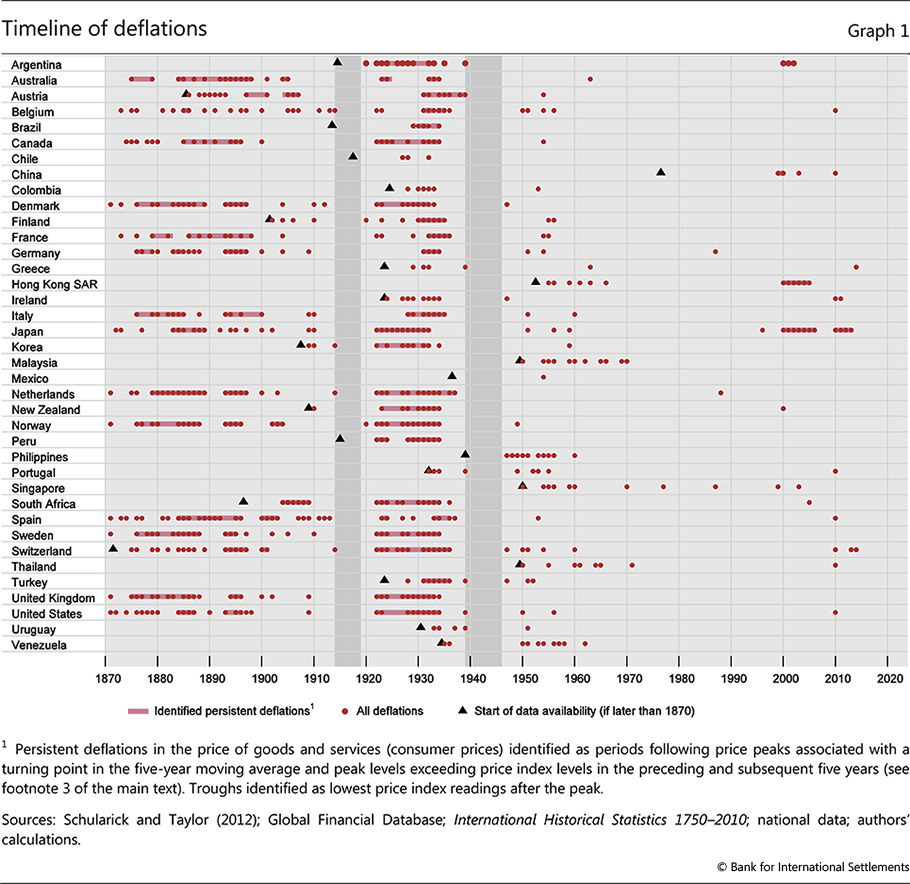
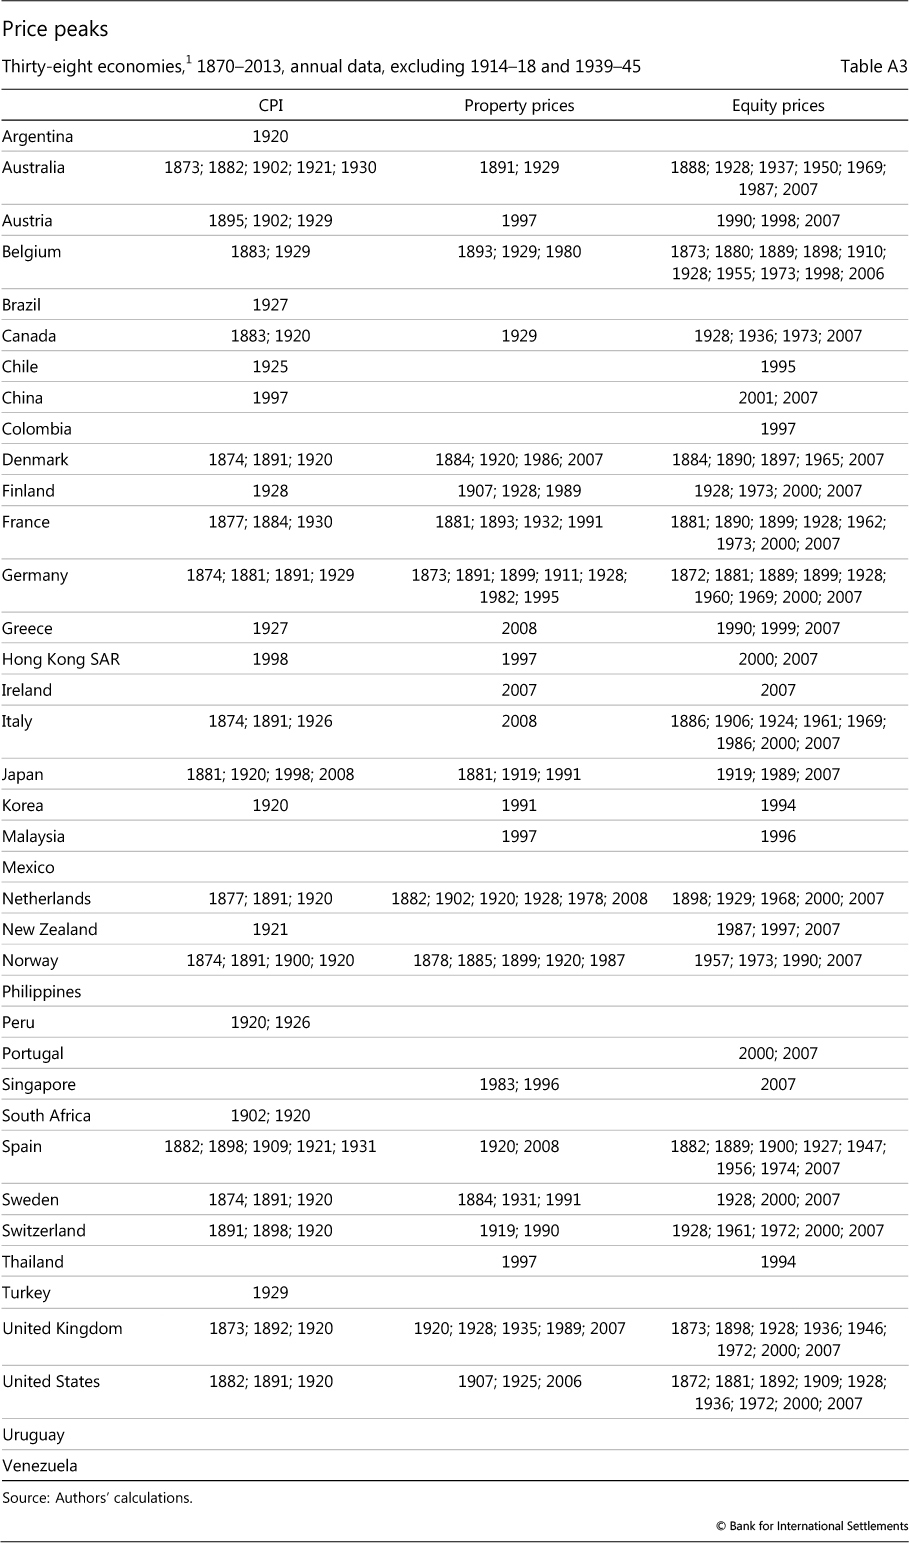
Graph 1 and Table 1 provide a bird's eye view of the deflation record. Deflations, as is well known, were very common before the Second World War. The bulk of persistent deflations took place during that phase: only four have occurred postwar (in Japan (twice), China and Hong Kong SAR).5 That said, transitory deflations have not been rare in the postwar era: there have been well over 100 deflation years in our sample of 38 economies.6 Similarly, the intensity of deflations, measured by the yearly average percentage change, as well as their duration were considerably greater in the prewar era. Interestingly, in terms of average and cumulative price declines, the Great Depression was no outlier. This is partly because prices had already been falling for many years previously, including during the strong expansion of the "roaring twenties" in several countries, and partly because of the sizeable dispersion in price declines across countries, which makes the average less representative (Box 1).
Price deflations and output growth: link or no link?
What has been the relationship between deflations and output growth? To assess the link, we first consider the experience across all deflation years and then focus more narrowly on persistent deflations. As is common in work that spans a long historical period, we measure growth in per capita terms, so as to make the figures more comparable across time. That said, our results do not hinge on this measure.
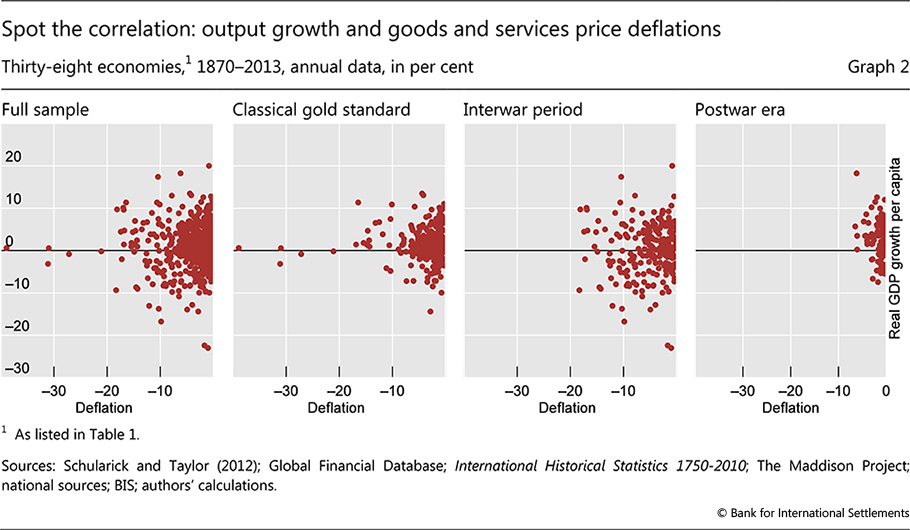
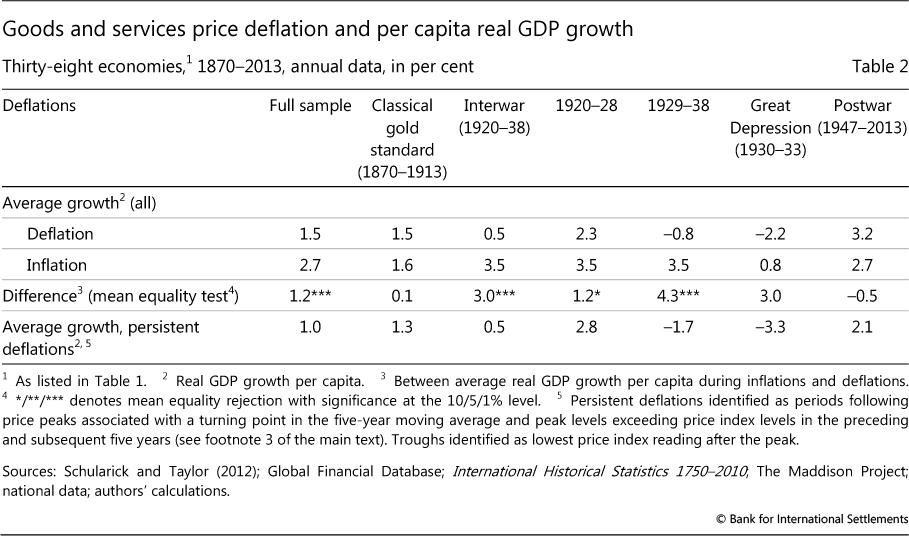
A preliminary assessment of the link between deflations and growth does not suggest a negative relationship. Price deflations have coincided with both positive and clear negative growth rates (Graph 2). And a comparison of all inflation and deflation years suggests that, on balance, inflation years have seen only somewhat higher growth (Table 2). The difference in average growth rates is highest and statistically significant only during the interwar years, particularly in the period 1929-38 that includes the Great Depression (some 4 percentage points), and much smaller at other times. It is the experience of the interwar years that influences the full sample results. Indeed, in the postwar era, in which transitory deflations dominate, the growth rate has actually been higher during deflation years, at 3.2% versus 2.7%.
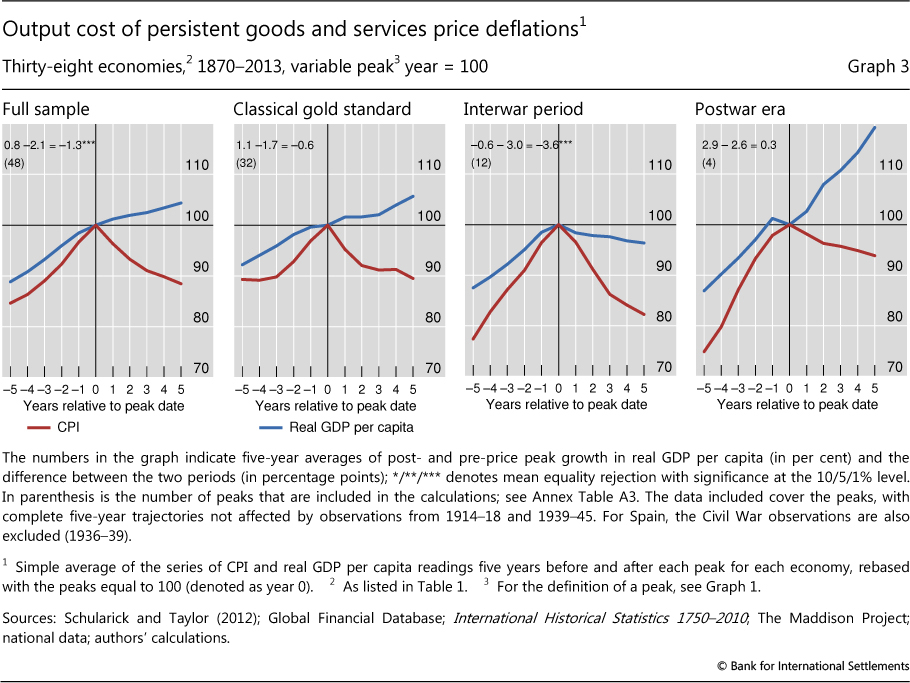
A shortcoming of this analysis is that it lumps together inflation and deflation episodes of very different durations, regardless of the economic backdrop. A finer test is to compare output performance before and after the price peaks that usher in persistent deflations.
This comparison indicates only a weak association between deflation and slower growth (Graph 3). While mean growth rates are mostly lower in the five years post-peak, the difference is large, 3.6 percentage points, and clearly statistically significant (ie cannot be attributed purely to chance) only in the interwar years, when the Great Depression took place - the subperiod that appears to drive also the results for the full sample. The difference during the classical gold standard period is 0.6 percentage points but it is not statistically significant. In fact, in the postwar era, average growth was even 0.3 percentage points higher in the five years after a price peak, although the difference is not statistically significant.7 Moreover, only in the interwar years did output actually fall post-peak. The benign output performance during the classical gold standard period is what has led previous researchers to characterise such deflations as "good" (Bordo and Redish (2004), Atkeson and Kehoe (2004), Borio and Filardo (2004), Bordo and Filardo (2005)). On this basis, the same could be said of the postwar deflations.
Price vs asset price deflations: which ones are costly?
To what extent does the weak association between deflation and growth change once we also consider asset price deflations? In order to explore this question, we rely on an extended data set that includes historical series for property (house) prices - an asset price that, unlike stock prices, has proved very hard to obtain.8 Our data set builds on the sources identified in the very helpful recent work by Knoll et al (2014), adding further economies (see Annex 1 for details). We examine asset prices in nominal terms, so as to avoid any spurious results that could arise if we deflated the asset prices by the price of goods and services.
We follow a similar sequence of tests to the one adopted so far. We first consider all inflations and deflations in the three price indices. This test will shed light on the direction and strength of the relationship between output growth, on the one hand, and changes in each of the three indices, on the other. We then zero in on persistent deflations in goods and services, property and equity prices, respectively. Here we break down the analysis into two steps: initially, to provide intuition, we consider each asset price deflation in isolation and then the three types of deflation jointly.
Box 1
The Great Depression
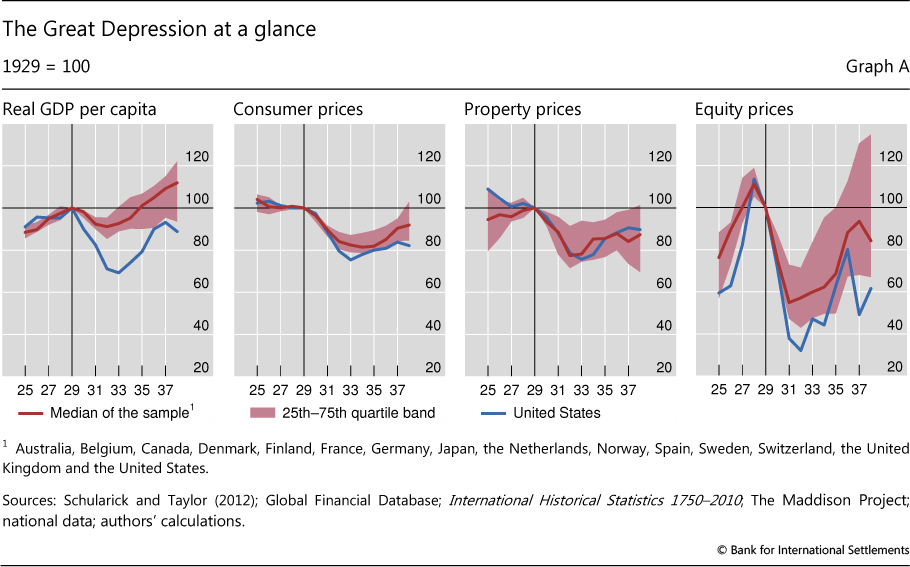
The perception that deflation is very costly is shaped to a large extent by the Great Depression, and in particular by the US experience. Especially in that country, the Great Depression followed a period of surging asset values, for both stock and house prices, a credit boom and robust output growth. Inflation was low or negative, reflecting strong increases in productivity, and interest rates were low. This period of apparent prosperity was brought to an end by the Wall Street Crash of October 1929. An unprecedented financial and economic meltdown followed, characterised by asset price collapses, bank panics, massive real economic contraction, mass unemployment, and dramatic goods and services price deflations in many countries. Between 1929 and 1933, real output in the United States dropped by almost one third and consumer prices by almost a quarter (Graph A). At the same time, nominal wages (hourly earnings in manufacturing) also fell by about one fifth, while the unemployment rate rose from 3% to 25%.
While the Great Depression was a global phenomenon, output generally contracted much more severely in the United States than elsewhere (Graph A, first panel). In the 15 countries in our sample, output, goods and services prices and asset prices fell substantially, but the cross-country dispersion is considerable. The median drop in real output between 1929 and 1933 was roughly 7%, much smaller than in the United States. And output recovered much faster too: by 1938, the median output per head in the group of economies for which data are available stood about 12% above its 1929 value, while it was still about 11% below in the United States.
Over this period, consumer prices behaved in a more similar way across countries (Graph A, second panel). The median price decline was about 18%, with a relatively narrow interquartile range across economies. The graph also shows that price levels were already on a declining trend before the onset of the Great Depression, consistent with our observation that persistent price deflation started in most countries during the early or mid-1920s. By contrast, property and equity prices in most countries peaked just before the economic contraction (Graph A, third and fourth panels). The median decline in house prices between 1929 and 1933 was about 22%; that in equity prices from their 1928 peak was about 51% by 1931 and in the United States no less than 67%.
The extensive literature on the Great Depression includes Friedman and Schwartz (1965), Bernanke (1983, 1995), Bernanke and James (1991), Eichengreen (1992) and Temin (1989).
All inflations and deflations
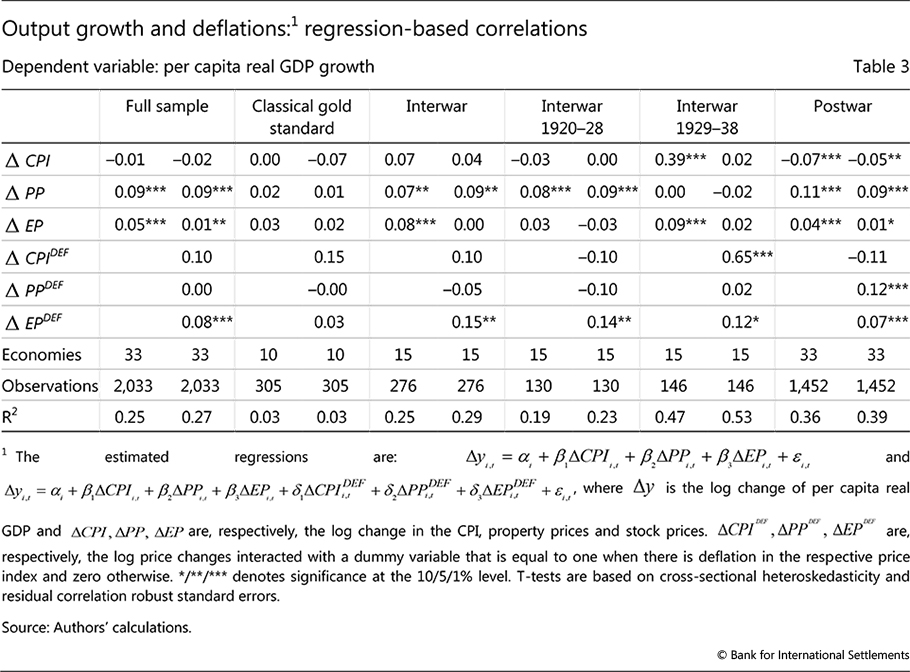
To assess the correlation between output growth and the change in goods and services prices and asset prices, we run a regression of output growth on the contemporaneous annual percentage change in the individual price indices. In addition, we also allow for the possibility that the correlations may change during deflations in the respective indices. Specifically, we estimate the following relationship:

where Δy is the log change of per capita real GDP and ΔCPI, ΔPP, ΔEP are, respectively, the log change in the CPI, house prices and stock prices. ΔCPIDEF, ΔPPDEF, ΔEFDEF are the corresponding log price changes interacted with a dummy variable that is equal to one when there is deflation in that price index and zero otherwise.
The regression coefficients show the sign and strength of the correlation between growth and price changes. And a positive coefficient on the interaction terms indicates that the correlation is stronger when prices are falling. We run the regressions on a panel of economies for the period 1870-2013 excluding the observations from the war years 1914-18 and 1939-45. The sample of economies is 33 for the whole period, given fewer observations for house prices in some cases. For the classical gold standard period, it is 10; and for the interwar period, 15.9
On balance, the relationship between changes in the consumer price index and output growth is episodic and weak (Table 3).10 Higher inflation is consistently associated with higher growth only in the second half of the interwar period, which is dominated by the Great Depression - the coefficients are positive and statistically significant. At other times, no statistically significant link is apparent except in the postwar era, in which higher inflation actually coincides with lower output growth, with no significant change in the correlation during deflations. In other words, the only sign that price deflation coincides with lower output growth comes from the Great Depression and its immediate aftermath.
By contrast, output growth and asset price changes are significantly positively correlated over the full sample and in most subsamples (same table).11 The only exception is the classical gold standard period: this may reflect the comparatively high volatility of yearly changes in the various variables, which weakens the precision of the estimates as it inflates the standard errors. The relative performance of equity and property prices varies across subperiods, but they all have a positive relationship with growth in the postwar era. That of property prices is especially sizeable during this period. Moreover, the positive and statistically significant coefficients on the interaction terms suggest that, postwar, the link with asset price declines is stronger than the link with increases. In particular, the coefficient of the change in property prices more than doubles when these prices decline.12
Persistent deflations
Does this general picture survive once we zoom in on persistent deflations? The answer is yes.
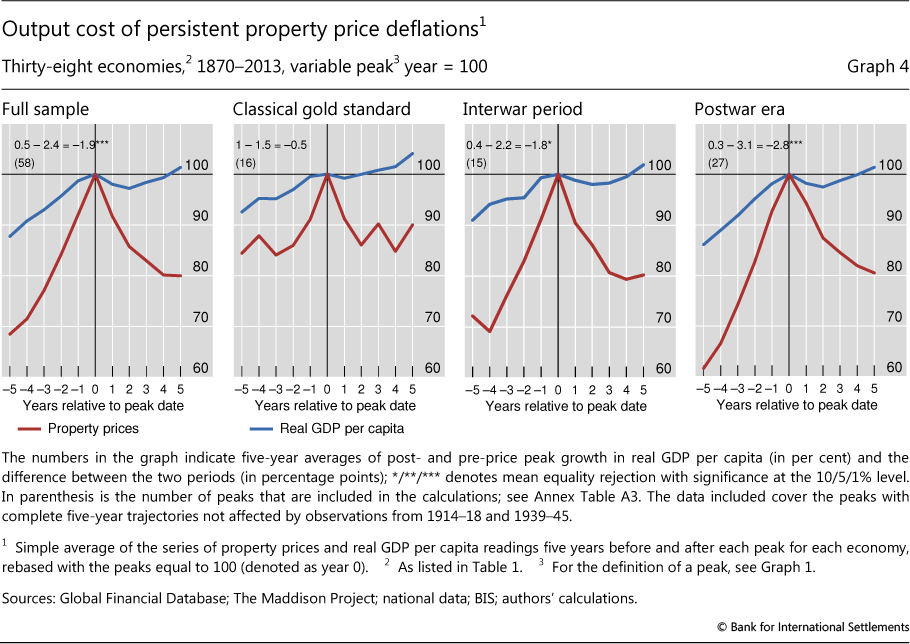
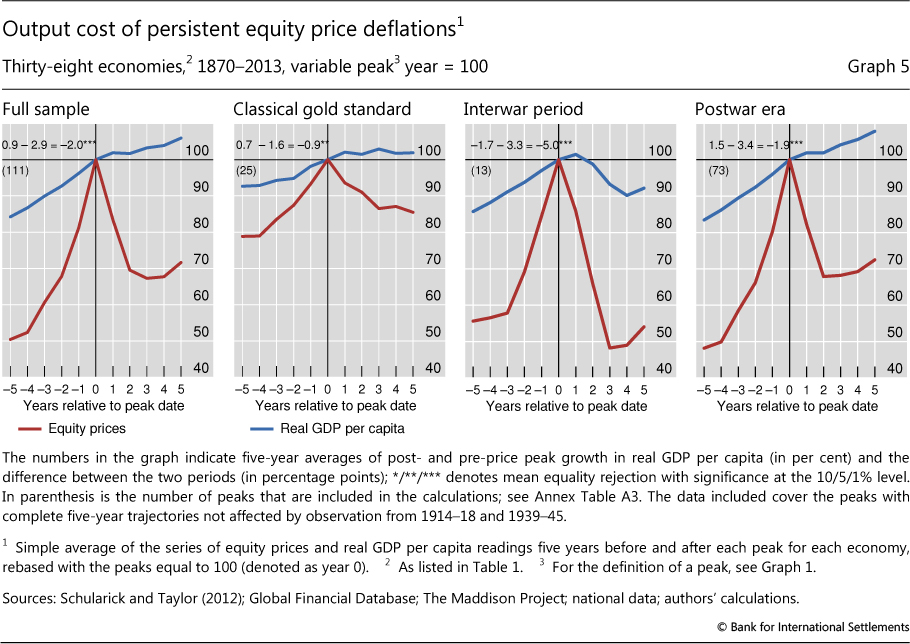
A first look at persistent asset price deflations in isolation points to very similar conclusions to the previous analysis (Graphs 4 and 5). Output growth is consistently lower during both property and equity price deflations, and the slowdown is statistically significant except in the classical gold standard period for house prices. The importance of property prices is again greater in the postwar period. And while, on average, output actually falls consistently after property prices peak, it does so after equity prices peak, with a lag, only in the interwar years.
When we assess how the different types of deflation jointly behave, the relative importance of asset price deflations actually strengthens. Here we run a set of regressions of the change in output growth over a specific horizon on a set of dummies that take the value of one when the respective price index reaches a peak and zero otherwise. We consider horizons between one and five years post-peak, ie those that correspond to our definition of persistent deflation.13 The sample and periods are the same as before. The specification is the following:

where y is the log level of per capita real GDP and PCPI, PPP, PEP are, respectively, the CPI, property and equity price peaks.14
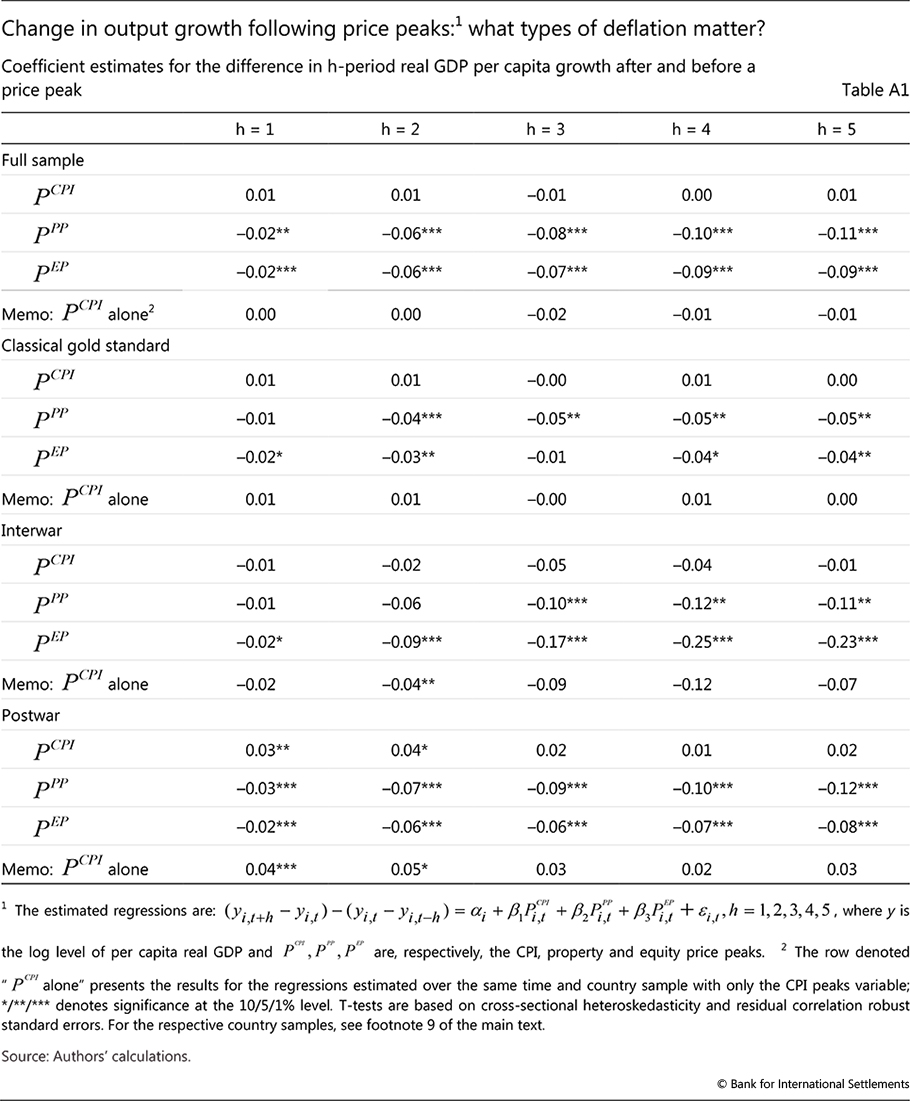
Graph 6 displays the estimated regression coefficients and their statistical significance (detailed results are reported in Annex Table A1). The graph plots three lines, for goods and services prices (red), property prices (blue) and equity prices (yellow). Each line traces the estimated relationship with output growth one to five years post-peak relative to output growth one to five years pre-peak. If the circles on the lines are filled, it means that the corresponding link is statistically significant.
The results are rather striking. Once we control for persistent asset price deflations and country-specific average changes in growth rates over the sample periods, persistent goods and services (CPI) deflations do not appear to be linked in a statistically significant way with slower growth even in the interwar period. They are uniformly statistically insignificant except for the first post-peak year during the postwar era - where, however, deflation appears to usher in stronger output growth. By contrast, the link of both property and equity price deflations with output growth is always the expected one, and is consistently statistically significant.
The absence of a clear negative relationship between CPI deflation and output growth even in the interwar years may appear surprising, especially given the previous results. This reflects in part the fact that the changes in growth are smaller when they are measured relative to the country average: this makes it harder to distinguish them statistically from zero.15 It also reflects the impact of including asset price peaks: this further reduces the size of the coefficients for the CPI price peaks. If the CPI peaks are included in isolation, we do find larger negative coefficients (Annex Table A1).
Taken at face value, the output slowdown in the wake of both equity and property price peaks is sizeable. For example, in the full sample, the slowdown is quite similar for both sets of asset prices: cumulative growth is about 10 percentage points lower by the end of the five years. In addition, the relative ranking is broadly similar to that found in the previous analysis. And notably, the slowdown following property price peaks appears to be somewhat stronger in the postwar era.

Do debt deflations matter?
Against the background of record high levels of both public and private debt (Graph 7), a key concern about the output costs of goods and services price deflation in the current debate is "debt deflation", ie the interaction of deflation with debt. The idea is that, as prices fall, the real debt burden of borrowers increases, inducing spending cutbacks and possibly defaults. This harks back to Fisher (1933), who coined the term.16 Fisher's concern was with businesses; today the focus is as strong, if not stronger, on households and the public sector. This type of debt deflation should be distinguished from the strains on balance sheets induced by asset price deflations. This interaction has an even longer intellectual tradition and has been prominent in the public debate ever since the re-emergence of financial instability in the 1980s (see eg Borio (2014a)).

Assessing empirically the relevance of debt deflation over a long time span is not easy, owing to serious data limitations for the pre-Second World War era. We take a first step based on a data set that draws on various sources (Annex). Given the data shortcomings, however, this part of the analysis cannot be more than exploratory in nature.
We focus on persistent deflations and follow the same methodology as in the previous section. Here, we control not only for price peaks but also for the possible interaction of these peaks with debt, D. A negative interaction term indicates that post-peak output growth is slower when debt is higher. Specifically, we estimate the following relationship:
We consider both public and private debt.17 For the public sector, we use the corresponding debt-to-GDP ratio.18 For the private sector, we consider two different measures. One is simply its corresponding debt ratio to GDP.19 The other is a measure of "excess debt", which should, in principle, be more relevant. We use the deviation of credit from its long-term trend, or the "credit gap" - a variable that in previous work has proved quite useful in signalling future financial distress.20
Box 2
Japan's growth and deflation: two lost decades?
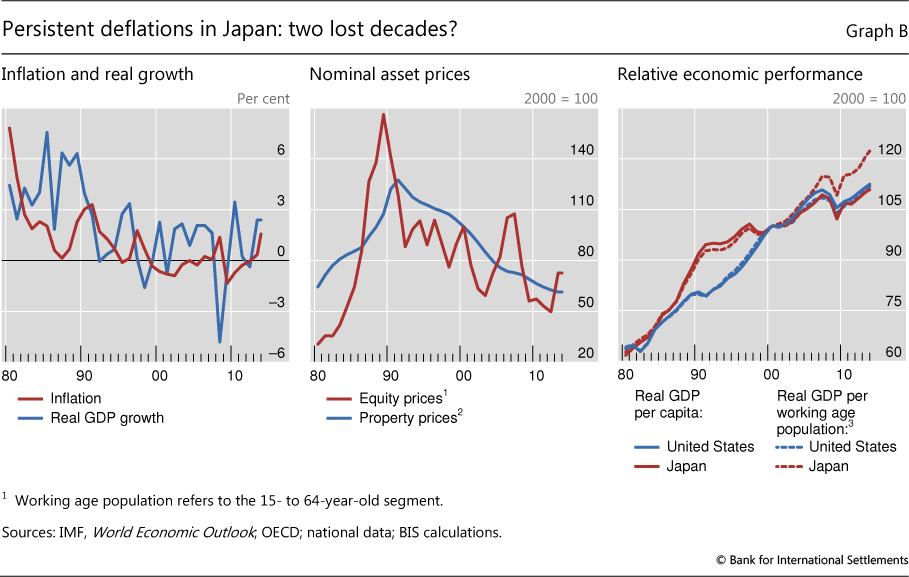
The most important case of persistent deflation in the postwar era is Japan since 1998. This deflation episode has been mild, with a cumulative fall in consumer prices of just 4% between 1998 and 2012, but very persistent, lasting for more than a decade (Graph B, left-hand panel).  The deflation followed a sharp drop in share and land prices starting in the early 1990s, in the wake of a strong boom in asset prices and credit in the second half of the 1980s (Graph B, centre panel). The collapse in asset prices impaired bank balance sheets and ushered in a so-called lost decade for growth between 1991 and 2000. Since growth has, in fact, never returned to pre-bust rates, the entire post-1991 period is sometimes referred to as "two lost decades", with persistent deflation characterising the second.
That said, the picture of Japan's uninterrupted economic decline since the early 1990s is qualified when demographic factors are considered. The growth slowdown and the rapid ageing of the population acted as a drag on growth from the turn of the millennium. This needs to be controlled for when assessing the relationship between deflation and economic performance. Indeed, on a per capita basis, real GDP growth slowed markedly during the 1990s, but actually rose during the 2000s. Between 1991 and 2000, cumulative per capita real GDP grew by a mere 6%, compared with 26% in the United States (Graph B, right-hand panel). Between 2000 and 2013, however, cumulative per capita real growth was 10%, compared with roughly 12% in the United States. Real GDP per working age population, a measure that also takes into account the effect of ageing on economic performance, shows an even stronger performance. It indicates that cumulative growth in the period 2000-13 exceeded 20% in Japan, compared with roughly 11% in the United States (Graph B, right-hand panel). This picture does not change when we exclude the Great Financial Crisis. In the period 2000-07, cumulative per capita real GDP growth in Japan and the United States were, respectively, about 9% and 11% and, when growth is measured in terms of working age population, about 15% and 8%.
The extensive literature on the causes and consequences of deflation in Japan includes Ahearne et al (2002), Ito and Mishkin (2004), Nishizaki et al (2012) and Shirakawa (2014). Our empirical methodology treats the Japanese deflation as two separate episodes because of a price peak in 2008 (in addition to the one in 1998). The results of the empirical analysis, however, would not be affected if we were to treat Japan as a single case.
The question we seek to address, however, is quite ambitious given the data characteristics. We are trying to establish the intensity of the link between post-peak output slowdowns and the debt outstanding at the outset of persistent deflation episodes. This is different from what we did before, when we simply measured whether output growth was significantly lower post-peak, without looking for a relationship between the intensity of, say, the price decline or its pre-peak increase and that of the slowdown. Data limitations also get in the way. For example, in the interwar period, we would have only five peaks in goods and services prices, 10 peaks in property prices and 12 peaks in equity prices in the regression sample at the five-year horizon due to the exclusion of the growth observations affected by the wars. So, in effect, we would be trying to fit a relationship between debt levels and changes in output growth on a very small number of observations. As a result, outliers can more easily distort the picture. For this reason, we focus on the full sample, which provides a larger set of observations to draw inferences.
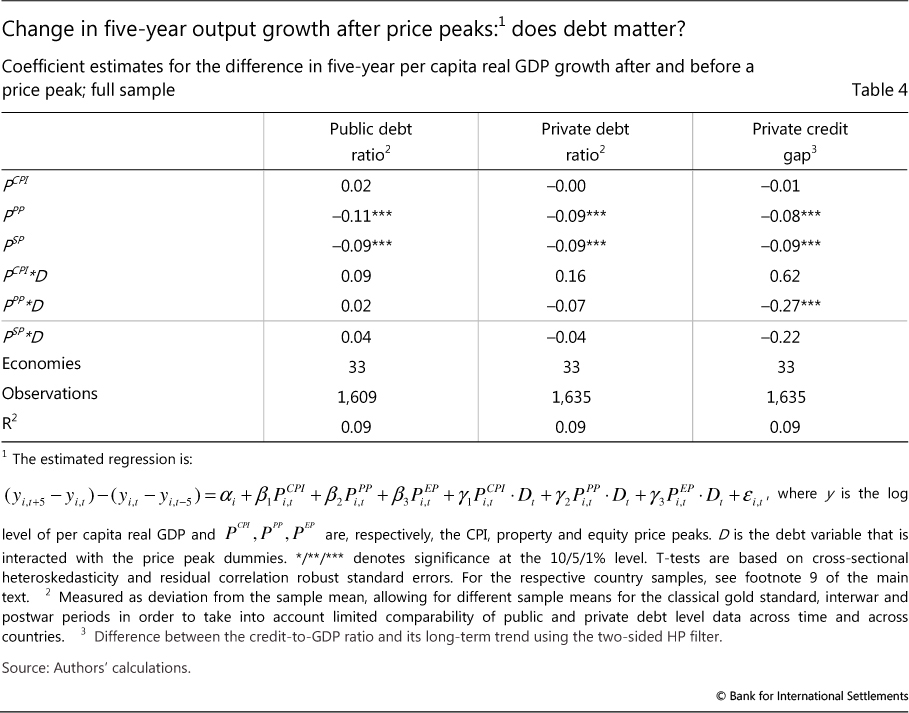
The results point to little evidence in support of the debt deflation hypothesis, and suggest a more damaging interaction of debt with asset prices, especially property prices (Table 4). Focusing on the cumulative growth performance over five-year horizons for simplicity,21 there is no case where the interaction between the goods and services price peaks and debt is significantly negative. By contrast, we find signs that debt makes property price deflations more costly, at least when interacted with the credit gap measure.22
Overall, these results suggest that high debt or a period of excessive debt growth has so far not increased in a visible way the costs of goods and services price deflations. Instead, it seems to have added to the strains that property price deflations in particular impose on balance sheets. Since other work has found that property price collapses tend to follow protracted surges in those prices alongside credit, this evidence is consistent with the view that such financial booms and busts - or financial cycles - deserve close attention (Drehmann et al (2011), Borio (2014a)).
Why could the interaction of debt with asset prices matter and that with goods and services prices not matter, or at least less so? A possible explanation has to do with the size and nature of the corresponding wealth effects. For realistic scenarios, the size of the net wealth losses from asset price deflations can be much larger. Consider, for instance, the 2008 crisis in the United States, a country for which good data exist. And use as a benchmark the peak-to-trough change in the value of the housing and equity stocks - based on the Case-Shiller house price index and the S&P 500. Then the corresponding losses amounted to roughly $9.1 trillion and $11.3 trillion, respectively. By contrast, a hypothetical deflation of, say, 1% per year over three years would imply an increase in the real value of public and private debt of roughly $1.1 trillion (about $0.4 trillion for households and roughly $0.35 trillion each for the non-financial corporate and public sector).23 Moreover, the nature of the losses is quite different in the two cases. Asset price deflations represent declines in (at least perceived) aggregate net wealth; by contrast, declines in goods and services prices are mainly redistributional. For instance, in the case of the public sector, the higher debt burden reflects the increase in the real purchasing power of debt holders.24
Conclusions
The evidence from our long historical data set sheds new light on the costs of deflations. It raises questions about the prevailing view that goods and services price deflations, even if persistent, are always pernicious. It suggests that asset price deflations, and particularly house price deflations in the postwar era, have been more damaging. And it cautions against presuming that the interaction between debt and goods and services price deflation, as opposed to debt's interaction with property price deflations, has played a significant role in past episodes of economic weakness.
Inevitably, our results come with significant caveats. The data set could be further improved. We have focused on only a few drivers of output costs. We have only a few episodes of persistent deflation in the postwar period. And present debt levels are at, or close to, historical highs in relation to GDP. This should caution against drawing sweeping conclusions or firm inferences about the future.
Even so, the analysis does suggest a number of considerations relevant for the current policy debate. First, it is misleading to draw inferences about the costs of deflation from the Great Depression, as if it was the archetypal example. The episode was an outlier in terms of output losses; in addition, the scale of those losses may have had less to do with the fall in the price level per se than with other factors, including the sharp fall in asset prices and associated banking distress. Second, and more generally, when calibrating a policy response to deflation, it is critical to understand the driving factors and, as always, the effectiveness of the tools at the authorities' disposal. This can help to better identify the benefits and risks involved. Finally, there is a case for policymakers to pay closer attention than hitherto to the financial cycle - that is, to booms and busts in asset prices, especially property prices, alongside private sector credit.
How best to address financial cycles is a broader policy question that the specific analysis in this article obviously cannot answer. As discussed in detail elsewhere (see eg Borio (2014a,b)), there is a case that policy should first and foremost constrain the build-up of financial booms - especially in the form of strong joint credit and property price increases - as these are the main cause of the subsequent bust. And once the financial bust occurs, after the financial system is stabilised, the priority should be to address the nexus of debt and poor asset quality head-on, rather than relying on overly aggressive and prolonged macroeconomic accommodation through traditional policies. This would pave the way for a sustainable recovery. The idea would be to have macroeconomic policies that are more symmetrical across financial booms and busts so as to avoid a persistent bias that could, over time, entrench instability and chronic economic weakness as well as exhaust the policy room for manoeuvre. This article simply presents one small piece of additional evidence in a much bigger jigsaw puzzle.
References
Ahearne, A, J Gagnon, J Haltmaier, S Kamin and others (2002): "Preventing deflation: lessons from Japan's experiences in the 1990s", Board of Governors of the Federal Reserve System, International Finance Discussion Papers, no 729, June.
Atkeson, A and P Kehoe (2004): "Deflation and depression: is there an empirical link?", American Economic Review, vol 94(2), May, pp 99-103.
Bernanke, B (1983): "Nonmonetary effects of the financial crisis in the propagation of the Great Depression", American Economic Review, vol 73(3), June, pp 257-76.
--- (1995): "The macroeconomics of the Great Depression", Journal of Money, Credit and Banking, vol 27(1), February, pp 1-28.
Bernanke, B and H James (1991): "The gold standard, deflation, and financial crisis in the Great Depression: an international comparison", in G Hubbard (ed), Financial markets and financial crises, University of Chicago Press.
Bordo, M and A Filardo (2005): "Deflation and monetary policy in a historical perspective: remembering the past or being condemned to repeat it?", Economic Policy, vol 20(44), October, pp 799-844.
Bordo, M and A Redish (2004): "Is deflation depressing: evidence from the Classical Gold Standard", in R Burdekin and P Siklos (eds), Deflation: current and historical perspectives, Cambridge University Press.
Borio, C (2014a): "The financial cycle and macroeconomics: what have we learnt?", Journal of Banking & Finance, vol 45, August, pp 182-98. Also available as BIS Working Papers, no 395, December 2012.
--- (2014b): "Monetary policy and financial stability: what role in prevention and recovery?", Capitalism and Society, vol 9(2), article 1, pp 1-27. Also available as BIS Working Papers, no 440, January 2014.
Borio, C and A Filardo (2004): "Looking back at the international deflation record", North American Journal of Economics and Finance, vol 15(3), December, pp 287-311. Also available, in extended form, as "Back to the future? Assessing the deflation record", BIS Working Papers, no 152, March 2004.
Borio, C and P Lowe (2002): "Asset prices, financial and monetary stability: exploring the nexus", BIS Working Papers, no 114, July.
Drehmann, M, C Borio and K Tsatsaronis (2011): "Anchoring countercyclical capital buffers: the role of credit aggregates", International Journal of Central Banking, vol 7(4), December, pp 189-239. Also available as BIS Working Papers, no 355, November 2011.
Eichengreen, B (1992): Golden fetters: the Gold Standard and the Great Depression, 1919-1939, Oxford University Press.
Eichengreen, B and K Mitchener (2003): "The Great Depression as a credit boom gone wrong", BIS Working Papers, no 137, September.
Fackler, J and R Parker (2005): "Was debt deflation operative during the Great Depression?", Economic Inquiry, vol 43(1), January, pp 67-78.
Fisher, I (1933): "The debt-deflation theory of great depressions", Econometrica, vol 1(4), October, pp 337-57.
Friedman, M and A Schwartz (1963): A monetary history of the United States, 1867-1960, Princeton University Press.
--- (1965): The Great Contraction, 1929-33, National Bureau of Economic Research, NBER Books, November.
Genberg, H and L Pauwels (2005): "Wage-price dynamics and deflation in Hong Kong", Pacific Economic Review, vol 10(2), June, pp 191-216.
Goodhart, C and B Hofmann (2006): "Goods and asset price deflations", in House prices and the macroeconomy, Oxford University Press, Chapter 5.
Ha, J, K Fan and C Shu (2003): "The causes of inflation and deflation in Mainland China", Hong Kong Monetary Authority, Quarterly Bulletin, September, pp 23-31.
Ito, T and F Mishkin (2004): "Two decades of Japanese monetary policy and the deflation problem", NBER Working Papers, no 10878, October.
Jordà, O, M Schularick and A Taylor (2013): "When credit bites back", Journal of Money, Credit and Banking, Supplement to vol 45(2), pp 3-28.
--- (2014): "The great mortgaging: housing finance, crises, and business cycles", NBER Working Papers, no 20501.
Knoll, K, M Schularick and T Steger (2014): "No price like home: global house prices, 1870-2012", CEPR Discussion Papers, no DP 10166.
Meltzer, A (2003): The history of the Federal Reserve, University of Chicago Press.
Nishizaki, K, T Sekine and Y Ueno (2012): "Chronic deflation in Japan", Bank of Japan Working Paper Series, no 12-E-6, July.
Rajan, R and R Ramcharan (2015): "The anatomy of a credit crisis: the boom and bust in farm land prices in the United States in the 1920s", American Economic Review, forthcoming.
Schellekens, P (2003): "Deflation in Hong Kong SAR", Pacific Economic Review, vol 10(2), June, pp 243-60.
Schularick, M and A Taylor (2012): "Credit booms gone bust: monetary policy, leverage cycles, and financial crises, 1870-2008", American Economic Review, vol 102(2), April, pp 1029-61.
Shirakawa, M (2014): "Is inflation (or deflation) 'always and everywhere' a monetary phenomenon?", BIS Papers, no 77, March.
Siklos, P and Y Zhang (2010): "Identifying the shocks driving inflation in China", Pacific Economic Review, vol 15(2), May, pp 204-23.
Smith, G (2006): "The spectre of deflation: a review of empirical evidence", Canadian Journal of Economics, vol 39(4), November, pp 1041-72.
Temin, P (1989): Lessons from the Great Depression, MIT Press.
Yam, J (2002): "Deflation: causes", Hong Kong Monetary Authority, Viewpoint, November.
Annex

Data sources
Consumer prices: Schularick and Taylor (2012); Global Financial Database; International Historical Statistics 1750-2010; national sources.
Equity prices: Schularick and Taylor (2012); Global Financial Database; national sources.
House prices: National sources based in large part on the information provided in Knoll et al (2013); BIS database.
Real GDP per capita: The Maddison Project, 2013 version, www.ggdc.net/maddison/maddison-project/home.htm; national sources.
Nominal GDP: Schularick and Taylor (2012); national sources.
Population: IMF, World Economic Outlook; The Maddison Project, 2013 version, www.ggdc.net/maddison/maddison-project/home.htm.
Private credit: Jordà et al (2014); Schularick and Taylor (2012); IMF, International Financial Statistics; national sources; BIS database.
Government debt: IMF, World Economic Outlook; OECD, Economic Outlook; central government debt-to-GDP ratios available on Carmen Reinhart's website, www.carmenreinhart.com/data/browse-by-topic/topics/9/.
All data start in 1870 at annual frequency and have been merged using the historical databases with recent national data applying appropriate statistical methods. Where possible, data prior to 1870 were used to assess price peaks in the early 1870s.
1 The authors would like to thank Ryan Banerjee, Michael Bordo, Mark Carlson, Michael Devereux, Dietrich Domanski, Leonardo Gambacorta, Charles Goodhart, Harold James, Jonathan Kearns, David Laidler, Marco Lombardi, Giovanni Lombardo, Hyun Song Shin, Pierre Siklos, Christian Upper and Haibin Zhu for helpful comments, as well as Michela Scatigna for help in collecting historical property price data and Angelika Donaubauer for assistance with the graphs. The views expressed are those of the authors and do not necessarily reflect those of the BIS.
2 See, for example, Smith (2006) for a review of the academic literature on deflation.
3 This requires price peaks to be identified. Here we follow a three-step procedure similar to that used by Borio and Filardo (2004): (i) identify candidate peaks using a five-year moving average; (ii) date the local peak using the underlying series; and (iii) eliminate transitory deflations by requiring the peak to be higher than the price index level of the preceding and subsequent five years. The symmetrical restriction around the peak ensures that persistent deflation episodes do not overlap. Annex Table A3 lists the corresponding price peaks.
4 The historical CPI data were taken from different sources (see data sources in the Annex). When data from multiple sources were available, the choice was based on series length and the absence of breaks and outliers.
5 For an analysis of the deflation in Japan, see Box 2; for that in China, Ha et al (2003) and Siklos and Zhang (2010); and for that in Hong Kong, Yam (2002), Schellekens (2003) and Genberg and Pauwels (2005).
6 The peak-dating procedure described in footnote 3 identifies most of the 1920s as a period of persistent deflation in many countries. A few countries experienced periods of stable prices and sometimes transitory mild price increases in the mid-1920s, but these were not long or strong enough to constitute a separate price peak in our procedure. In particular, in the United States there were mild price increases between 1923 and 1926 following the sharp deflation of the early 1920s.
7 Of course, the small number of observations (only four episodes) means that one should take this number with a grain of salt.
8 Land prices would have been an even better variable, especially since the sample spans a historical period in which the structure of production and spending has varied substantially. Land prices will matter regardless of the shifting weight of, say, agriculture and manufacturing, or household mortgage and commercial lending. (See, for instance, Rajan and Ramcharan (2015) on the key role played by farm land prices ahead of the Great Depression in the United States.) Such data, unfortunately, are even harder to obtain. Moreover, in considering the evidence, one should also take into account the deteriorating quality and availability of house price data as we go back in history. In all probability, therefore, our findings underestimate the relevance of property prices.
9 Of the 38 economies covered in the analysis, no house price data are available for three of them (Argentina, Uruguay and Venezuela), while for two the series are too short to be included in the regressions (the Philippines and Turkey). The country sample for the classical gold standard period comprises Australia, Belgium, Denmark, France, Germany, the Netherlands, Spain, Sweden, the United Kingdom and the United States. For this period, the main limiting factor is the lack of stock price data for a number of countries. For the interwar years, the country sample is the same as for the classical gold standard period plus Canada, Finland, Japan, Norway and Switzerland and excluding for Spain the observations from the Civil War (1936-39). Within each sample, the number of observations may not be the same for all countries, ie the panel is "unbalanced". And we allow for differences across countries through country-specific constants ("fixed effects").
10 We have only one case of hyperinflation in our sample: Germany in the years 1922 to 1924. These extreme observations are excluded from the regressions.
11 These findings are consistent with Goodhart and Hofmann (2006), who compare the impact of goods and services prices and equity prices on output growth for a subsample of our historical episodes.
12 The growing importance of property prices in the postwar period probably reflects in part that of mortgage credit, as documented by Jordà et al (2014). With a larger part of credit tied to the value of houses, fluctuations in house prices would be expected to have a bigger influence on economic activity.
13 This approach is similar to the analysis in Jordà et al (2013) of the growth impact of normal recessions and financial recessions.
14 Observations from the war years 1914-18 and 1939-45 and in the case of Spain observations from the Civil War 1936-39 are excluded from the calculation of the difference in h-period growth rates.
15 This is the result of the inclusion of the country fixed effects in equation (2).
16 His envisaged mechanism, however, operates fundamentally through the impact of the liquidation and repayment of debt on the money supply (deposit money) and, from there, on prices. Empirical evidence for the relevance of debt deflation more generally is scant and anecdotal. In their econometric analysis of the Great Depression, Bernanke and James (1991) do not include debt deflation explicitly; they simply suggest that the (large) unexplained component in the output contraction in a sample of countries may reflect its operation. Fackler and Parker (2005) infer the relevance of debt deflation in the United States from the observation that debt grew rapidly in the 1920s against the backdrop of largely stable prices. That same observation, alongside the strong increase in asset prices, led Eichengreen and Mitchener (2003), drawing on Borio and Lowe (2002), to argue that the Great Depression was a credit boom gone wrong - a point subsequently confirmed by Schularick and Taylor (2012). Meltzer (2003), in turn, argues against the debt deflation view on the grounds that the fall in goods and services prices should have boosted real balances and stimulated spending. He sees tight monetary policy as the main cause, as had already been highlighted by Friedman and Schwartz (1963).
17 For public debt, wherever possible, we use general government debt and, where not, central government debt. For the classical gold standard and interwar periods, only data for central government debt are available. For private debt, if available, we use total credit to the private sector, and bank credit or bank loans otherwise. For the classical gold standard and interwar periods, only data for bank loans are available. See Annex Table A2 and the data sources for more details.
18 In order to take into account the limited comparability of the raw debt series across countries and over time, the debt ratios are measured for each economy as deviations from the respective sample mean allowing for different means in each of the three historical periods (ie classical gold standard, interwar and postwar periods).
19 Demeaned in the same way as the public debt-to-GDP ratio.
20 The credit-to-GDP gap is calculated using a two-sided Hodrick-Prescott filter with a smoothing parameter of 1,600. The rationale behind the choice of a very high smoothing parameter is discussed in detail in Drehmann et al (2011). We use a two-sided instead of a one-sided filter mainly because the one-sided filter is more data-hungry, which would make the filter very unreliable over the shorter samples, taking advantage of the fact that here we are not interested in ex ante, real-time predictions.
21 Results for the remaining time horizons one to four are available upon request; they do not change the picture.
22 Results for subperiods are available on request. While confirming the role of property prices across periods and their growing significance in the postwar era, as expected they are somewhat more erratic for the other variables in particular.
23 The picture would not be very different if one estimated the loss based on unexpected disinflation more generally. For instance, assuming inflation expectations at 2% and that all existing debt was taken on at fixed interest rates which embedded those expectations - an extreme assumption - this would triple the size of the loss, which would still be comparatively small.
24 Moreover, the evidence pointing to a more visible effect of property, rather than equity, price deflation may have to do with the nature of the contracts, as property is more extensively used as collateral, and with its interaction with defaults. It may also reflect the greater persistence of property price losses (see eg Borio (2014a)).