Bank business models
We identify three business models using balance sheet characteristics of 222 international banks and a data-driven procedure. We find that institutions engaging mainly in commercial banking activities have lower costs and more stable profits than those more heavily involved in capital market activities, mainly trading. We also find that retail banking has gained ground post-crisis, reversing a pre-crisis trend.1
JEL classification: D20, G21, L21, L25.
Banks choose to be different from one another. They engage strategically in different intermediation activities and select their balance sheet structure to fit their business objectives. In a competitive pursuit of growth opportunities, banks choose a business model to leverage the strengths of their organisation.
This article has three objectives. The first is to define and characterise banks' business models. We identify a small set of key ratios that differentiate banks' business profiles and use a broader set of variables to provide a more complete characterisation of these profiles. The second objective is to analyse the performance of these business models in terms of profitability and operating costs. The final objective is to track how banks changed their business models before and after the recent crisis.
We identify three business models: a retail-funded commercial bank, a wholesale-funded commercial bank and a capital markets-oriented bank. The first two models differ mainly in terms of banks' funding mix, while the third category stands out primarily because of banks' greater engagement in trading activities. On average, retail-focused commercial banks exhibit the least volatile earnings, while wholesale funded commercial banks are the most efficient. On the other hand, trading banks struggle to consistently outperform the other two business types.
Banks' profiles evolve over time in response to changes in the economic environment and to new rules and regulations. We find that transition patterns changed around the recent financial crisis. While several banks increased their reliance on wholesale funding prior to the crisis, in its wake more banks have adopted more traditional business profiles geared towards commercial banking.
The rest of this article is organised in four sections. In the first section, we lay out the methodology we employ to classify banks into distinct business models. In the second section, we characterise the three business models in terms of banks' balance sheet composition, while in the third we highlight systematic differences in the performance of banks in different business model groups. In the last section, we look into the transitions of banks across the three groups.
Classifying banks: the methodology
The procedure we use to classify banks into distinct business models is primarily driven by data but incorporates judgmental elements. It shares many technical aspects with the procedure employed by Ayadi and de Groen (2014), but differs in terms of the judgmental elements and the data used. In contrast to their analysis, which focuses exclusively on European banks, we use annual data for 222 individual banks from 34 countries, covering the period between 2005 and 2013. The unit of our analysis (ie a data point) is a bank in a given year (bank/year pair). Given that the available data do not cover the entire period for each bank, we work with 1,299 bank/year observations. By focusing on bank/year pairs our approach allows institutions to switch between business models at any point in the period of analysis (an aspect that we explore in the last section). In this section we provide a description of the classification methodology, leaving the more technical details for the box.
The inputs to the classification are bank characteristics. These are balance sheet ratios, which we interpret as reflecting strategic management choices. We use eight ratios expressed in terms of balance sheet size and evenly split between the asset and liability sides of the ledger. They relate to the share of loans, traded securities, deposits and wholesale debt, as well as the interbank activity of the firm.2 We distinguish this set of variables from other variables that we use in the third section to characterise the performance of different business models. We view these other variables, which capture profitability, income composition, leverage and cost efficiency, as reflecting the interaction between banks' strategic choices and the market environment. We thus treat them as variables that relate to outcomes as opposed to choices.
The core of the methodology is a statistical clustering algorithm. Based on a pre-specified set of input variables, the algorithm partitions the 1,299 bank/year observations into distinct groups. We select inputs from the set of choice variables. The idea is that banks with similar business model strategies have made similar choices regarding the composition of their assets and liabilities. We make no a priori decisions as to which choice variables are more important in defining business models or as to the general profile of these models. In that sense, the methodology is data-driven. We rely on the repeated use of the clustering algorithm and a goodness-of-fit metric (the F-index, which is described in the box) to guide the selection of the most appropriate partitioning of the observations universe into a small number of distinct business model groups.
Using statistical clustering to identify business models
This box more precisely defines the variables used as inputs and discusses the more technical aspects of the statistical classification (clustering) procedure.
The eight input variables from which we selected the key characteristics of the business models are evenly split between the asset and liability sides of the balance sheet. All ratios are expressed as a share of total assets net of derivatives positions. The reason for this is to avoid distortions of the metrics related by differences in the applicable accounting standards in different jurisdictions. The asset side ratios relate to: (i) total loans; (ii) securities (measured as the sum of trading assets and liabilities net of derivatives); (iii) the size of the trading book (measured as the sum of trading securities and fair value through income book); and (iv) interbank lending (measured as the sum of loans and advances to banks, reverse repos and cash collateral). The liability side ratios relate to: (i) customer deposits; (ii) wholesale debt (measured as the sum of other deposits, short-term borrowing and long-term funding); (iii) stable funding (measured as the sum of total customer deposits and long-term funding); and (iv) interbank borrowing (measured as deposits from banks plus repos and cash collateral).
We employ the statistical classification algorithm proposed by Ward (1963). The algorithm is a hierarchical classification method that can be applied to a universe of individual observations (in our case, these are the bank/year pairs). Each observation is described by a set of scores (in our case, the balance sheet ratios). This is an agglomerative algorithm, which starts from individual observations and successively builds up groups (clusters) by joining observations that are closest to each other. It proceeds by forming progressively larger groups (ie partitioning the universe of observations more coarsely), maximising the similarities of any two observations within each group and maximising the differences across groups. The algorithm measures the distance between two observations by the sum of squared differences of their scores. One could present the results of the hierarchical classification in the form of the roots of a tree. The single observations would be automatically the most homogeneous groups at the bottom of the hierarchy. The algorithm first groups individual observations on the basis of the closeness of their scores. These small groups are successively merged with each other, forming fewer and larger groups at higher levels of the hierarchy, with the universe being a single group at the very top.
Which partition (ie step in the hierarchy) represents a good compromise between the homogeneity within each group and the number of groups? There are no hard rules for determining this. We use the pseudo F-index proposed by Calinśki and Harabasz (1974) to help us decide. The index balances parsimony (ie a small number of groups) with the ability to discriminate (ie the groups have sufficiently distinct characteristics from each other). It increases when observations are more alike within a group (ie their scores are closer together) but more distinct across groups, and decreases as the number of groups gets larger. The closeness of observations is measured by the ratio of the average distance between bank/years that belong to different groups to the corresponding average of observations that belong to the same group. The number of groups is penalised based on the ratio of the total number of observations to that of groups in the particular partition. The criterion is similar in spirit to the Akaike and Schwarz information criteria that are often used to select the appropriate number of lags in time series regressions.
The clustering algorithm is run for all combinations of at least three choice variables from the set of eight. If we had considered all their combinations, there would have been 325 runs. We reduce this number by ignoring subsets that include two choice variables that are highly correlated because the simultaneous presence of these variables provides little additional information. We impose a threshold for the correlation coefficient of 60% (in absolute value), which means that we do not examine sets of input variables that include simultaneously the securities and trading book variables, or the wholesale debt and stable funding variables.
At various stages, our approach incorporates judgmental elements in order to help narrow down the search for a robust, intuitive and parsimonious classification of banks into distinct business models. The general strategy is as follows. We run the clustering algorithm for each subset of at least three choice variables, ignoring all subsets that include simultaneously pairs of variables that are very highly correlated with each other, hence providing little independent information. The clustering algorithm produces a hierarchy of partitions ranging from the very coarse (ie few groups) to the very fine (ie many small groups). We select the partition in this hierarchy with the highest F-index. This becomes the candidate partition for this run (ie this subset of choice variables).
We use judgmental criteria to eliminate candidates that do not represent clear and easily interpretable groups (ie distinct bank business models). One such criterion is to eliminate candidates that produce fewer than three or more than five groups as fewer than three do not allow for a meaningful differentiation of banks and more than five are difficult to interpret. The other criterion is to focus only on partitions that are "clear winners" among all other partitions based on the same set of choice variables. To this effect we require that the top scoring partition has an associated F-index score at least 15% higher than that of the partition with the second highest score within the same hierarchy (ie the same set of input variables). We dropped candidates that failed this test. This elimination procedure leaves us with five partitions (ie five different sets of groups) based on five different subsets of the choice variables.
To these five groups we apply a final judgmental criterion that seeks to capture the stability of outcomes over time. For each of the five combinations of choice variables we create two partitions of the banks in the universe. We first partition banks using only data up to 2012, and then using all available data. We then calculate the share of observations that are classified in the same group in both partitions over the overlapping period. We select the partition with the highest overlap ratio, which is 85%. This partition classifies the 1,299 bank/year observations into three groups, which we refer to as bank business models. We next characterise these models in terms of the whole set of eight choice variables.
Three distinct business models: the characteristics that matter
The classification process identifies three distinct business models and selects three ratios as the key differentiating choice variables: the share of loans, the share of non-deposit debt and the share of interbank liabilities to total assets (net of derivatives exposures). This partition satisfies our criteria of robustness, parsimony and stability. The share of gross loans is the only variable relating to the composition of the banks' assets. The other two ratios differentiate banks in terms of their funding structure.
Table 1 characterises the three business model profiles in terms of all eight choice variables (rows). The cells report the average ratio for all banks that were classified in the corresponding business model (columns). For comparison, the last column provides the average value of the corresponding ratio for the universe of observations.
The first business model group we label commercial "retail-funded", and it is characterised by a high share of loans on the balance sheet and high reliance on stable funding sources including deposits. In fact, customer deposits are about two thirds of the overall liabilities of the average bank in this group. This is the largest group in our universe with 737 bank/year observations over the entire period.
The second business model group we label commercial "wholesale-funded". The average bank in this group has an asset profile that is remarkably similar to the profile of the retail funded banks in the first group. The main differences between the two relate to the funding mix. Wholesale-funded banks have a higher share of interbank liabilities (13.8% versus 7.8%) and a much higher share of wholesale debt (36.7% versus 10.8%), with the balance being a lower reliance on customer deposits (35.6% versus 66.7%). There are half as many observations in the wholesale-funded group compared to the retail-funded group.
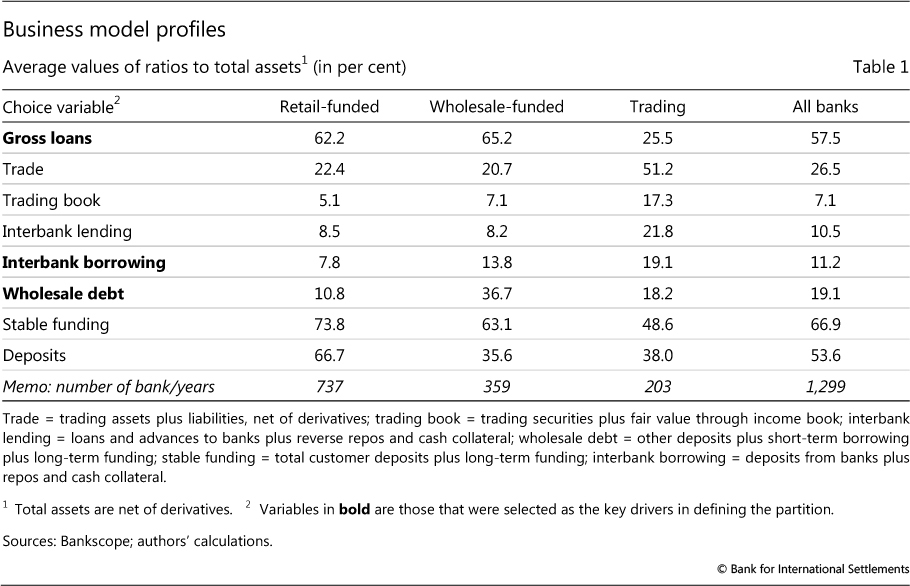
The third group is more capital markets-oriented. Banks in this category hold half of their assets in the form of tradable securities and are predominately funded in wholesale markets. In fact, the average bank in this group is most active in the interbank market, with related assets and liabilities accounting for about one fifth of the balance sheet. We label this business model "trading bank". It is the smallest group in terms of observations (203 bank/years) in our sample.
By comparison, Ayadi and de Groen (2014) classify European banks into four business models, which they label as investment banks, wholesale banks, diversified retail and focused retail. Drawing rough parallels with the classification in this paper, which involves a more global universe of banks, their investment bank model corresponds to our trading model, the two wholesale models correspond to each other, and the diversified and focused retail models together correspond to our retail-funded model. That said, an exact comparison would require comparing individual banks in the two universes.
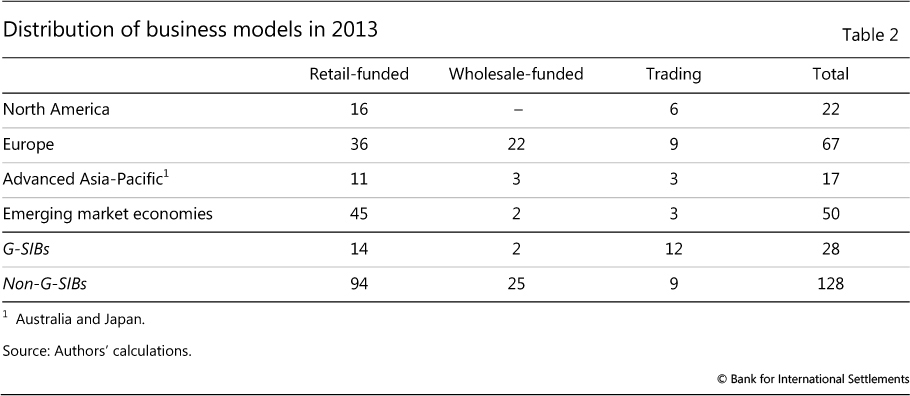
We find that the popularity of business models differs with banks' nationality (Table 2). Looking only at the last year of our data (2013), the North American banks in our universe had either a retail-funded or trading profile; none belonged to the wholesale-funded group. At the same time, one third of the European banks had a wholesale-funded model. In turn, banks domiciled in emerging market economies (EMEs) clearly preferred the retail-funded model (90%).
We also look at the distribution of global systemically important banks (G-SIBs) across business models (Table 2). Our data for 2013 cover 28 firms that were part of the banking organisations designated as G-SIBs by international policymakers (Financial Stability Board (2014)).3 The list - which includes institutions from both advanced and emerging market economies - was roughly equally split between the retail-funded and trading models.
Business models and bank performance
Are there systematic differences in the performance of banks with different business models? The question is pertinent for understanding the impact of banks' choices on shareholder value but also on financial stability, which depends on sustainable performance by financial intermediaries. In this section we examine the performance of banks in the different business model categories both in a cross section and over time.
In analysing the performance of different bank models, we use what we label "outcome" variables. In contrast to the choice variables that we used to define the business models, we interpret outcome variables as the result of the interaction between the strategic choices made by the bank in terms of business area focus and the market environment. Examples of such variables are indicators of profitability, (for example, banks' return-on-equity (RoE)), the composition of bank earnings (for instance, the share of interest income in total income) and indicators of efficiency (for example, the cost-to-income ratio).
Profitability and efficiency have varied markedly across models as well as over time (Graph 1). The outbreak of the recent crisis marked a steep drop in advanced economy banks' RoE across all business models (Graph 1, left-hand panel). But while RoE stabilised for retail banks after 2009, it remained volatile for trading and wholesale-funded banks. In fact, trading banks as a group show the highest volatility of RoE across the three groups, swinging repeatedly between the top and bottom of the relative ranking. The story is qualitatively similar in terms of return-on-assets (RoA, not reported here), an alternative metric of profitability that is insensitive to leverage (see also Table 3).
All three business models show relatively stable costs in relation to income (Graph 1, centre panel). A spike in the cost-to-income ratio around 2008 is readily explained by the drop in earnings in the midst of the crisis. Compared to the other two business models, trading banks had a persistently high cost base throughout the period of analysis, despite their more mixed record in terms of profitability. Interestingly, high costs relative to income have persisted post-crisis despite the decline in these banks' profitability. A possible explanation can be found in staff remuneration rates, although this would be difficult to decipher from our data.
Post-crisis markets appear rather sceptical about the prospects of all three business models, judging from the price-to-book ratio of banks in advanced economies (Graph 1, right-hand panel). This ratio relates the banks' stock market capitalisation to the equity they report in their financial accounts. A value higher than unity suggests that the equity market has a more positive view on the franchise value of the bank than what is recorded on the basis of accounting rules. A value below unity suggests the opposite. The ratio declined dramatically around the crisis for banks in all three business models. In fact, it has been persistently below unity since 2009 for most advanced economy banks, reflecting market scepticism about their prospects.
Banks domiciled in EMEs (dashed lines in Graph 1) remained largely unscathed by the 2007-09 crisis. These lenders are almost exclusively classified in the retail-funded model. But even compared to their advanced economy peers with a similar business model, they achieved a more stable performance. And while a more favourable macroeconomic environment has certainly contributed to their higher profitability in recent years, the overall stability of their performance is underpinned by greater cost efficiency, ie a lower cost-to-income ratio. In line with these results, market valuations are quite generous for EME banks with price-to-book ratios persistently higher than unity, although they are on a declining trend.
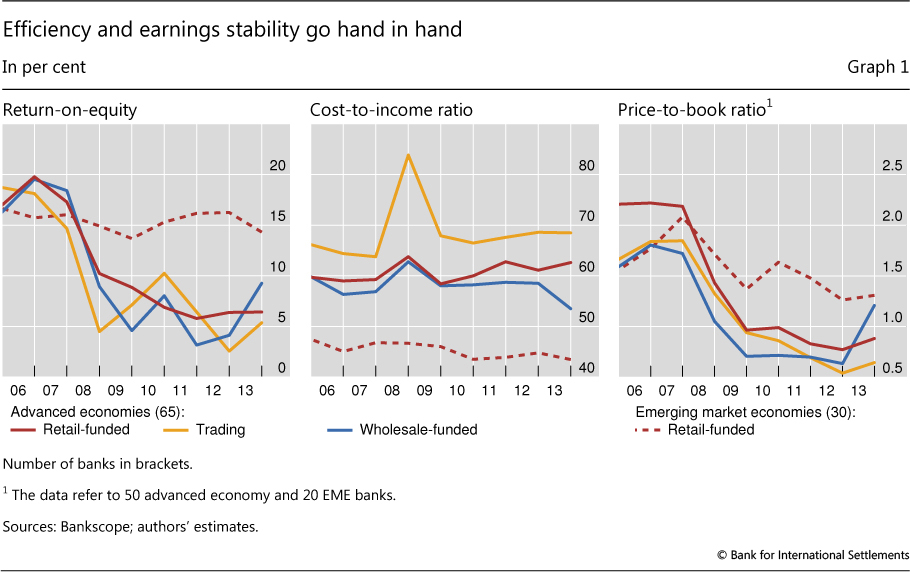
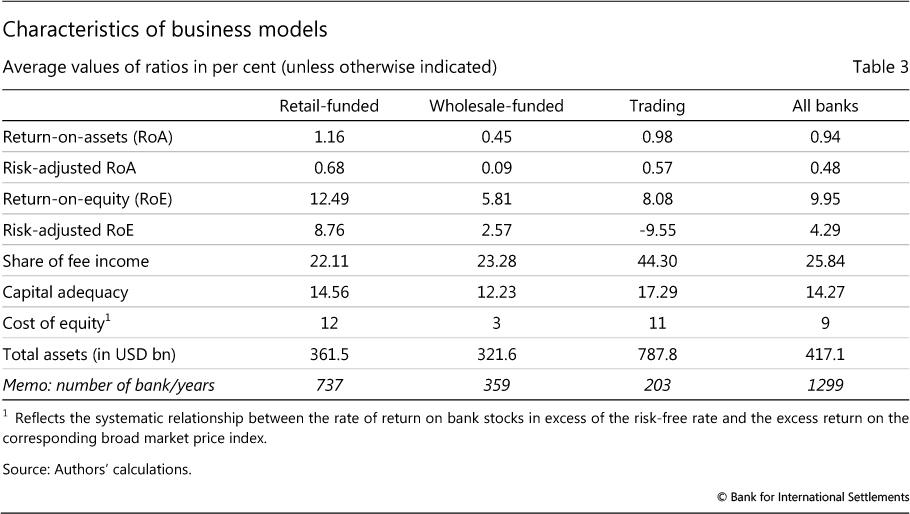
Table 3 compares the three business models in terms of a number of other outcome variables across the entire sample period. Besides RoA and RoE, which confirm the ranking from Graph 1, we also calculate risk-adjusted versions of these profitability statistics, which subtract from the earnings variable (the numerator of the ratio) the cost of capital that is necessary to cover for the risk inherent to the activity of the bank. The approach follows closely the rationale of standard industry approaches to calculate the risk-adjusted return on capital (or RAROC).4 More specifically, we subtract from the bank's gross earnings the associated operational expenses and losses (including credit losses and provisions) as well as the cost of capital set aside to cover possible future losses. This last component is the product of the quantity of capital held by the bank (proxied by the regulatory capital requirement linked to risk-weighted assets) multiplied by the cost of equity capital (estimated by a standard capital asset pricing model).5
Regardless of the profitability metric, the retail-funded model is the top performer. This is true in almost every year in our sample (not reported here).6 Trading banks come in second place, with the exception of the risk-adjusted RoE, which penalises the volatility of their earnings base. Trading banks differ very significantly from their commercial bank peers in terms of the source of revenue. They collect about 44% of their total profit through fees, a share that is almost double that of the average other bank.
Wholesale-funded banks have the thinnest capital buffers among the three business models, while they also have the lowest cost of equity. Somewhat surprisingly, trading banks do not seem to be too different from retail-funded banks in terms of these yardsticks. However, they do stand out in terms of total asset size. The average trading bank is more than twice as large as the average commercial bank, even those that are primarily funded in the wholesale markets.
Shifting popularity of bank business models
The crisis-driven reshaping of the banking sector has affected its concentration and business model mix. A number of institutions failed or were absorbed by others, thus increasing the concentration in the sector despite tighter regulatory constraints on banks with a large systemic footprint. And many of the surviving banks adjusted their strategies in line with the business models' relative performance.
Table 4 presents a summary of banks' shifts across different business models before and after the crisis. Each cell reports the number of banks that started the period in the model identified by the row heading and finished it in the model named in the column heading. The large numbers along the diagonal indicate that there is considerable persistence in the classification of banks, as the majority of institutions remain in the same business model group over time.
In recent years, most of the transitions have been between the retail- and wholesale-funded models of commercial banks. The group of trading-oriented banks is fairly constant throughout the period. The direction of change in bank business models, however, is very different post-crisis from that prevailing prior to 2007. During the boom period, market forces favoured wholesale funding, as bankers tapped debt and interbank market sources of finance. About one in six retail banks in our 2005 universe increased their capital market funding share to the point that they could be reclassified as wholesale-funded by 2007 (first row of Table 4).

The opposite trend characterises the post-crisis period. About two fifths of the banks that entered the crisis in 2007 as wholesale-funded or trading banks (ie 19 out of 50 institutions) ended up with a retail-funded business model in 2013. Meanwhile, only one bank switched from retail-funded to another business model post-crisis, confirming the relative appeal of stable income and funding sources.
While we observe transformations of banks in ways that result in their reclassification under a different business model, we cannot pinpoint the underlying economic drivers. We can, however, look at performance statistics to examine whether bank shifts correlate with a turnaround of the firm. We find that a change in bank business model actually hurts profitability, but improves efficiency relative to the firm's peer group.
To do this, we select all the banks in our sample that switched models and for which we have data for at least two years before and two years after the switch. We focus on two performance ratios: RoE and cost-to-income. We benchmark the performance of the bank against a comparator group that comprises all banks that belonged to the same business model as the switching bank prior to the switch and remained in that model. We determine that the switching bank outperformed its old peers if the difference between its average post-switch and average pre-switch RoE is greater than the difference between the corresponding averages in the comparator group. On the basis of this criterion, we find that only a third of the banks that switched their business model outperformed their old peers in terms of profitability. The remaining two thirds underperformed. However, applying the same criterion to the cost-to-income ratio reveals that, among the banks that switched business model, two thirds registered post-switch efficiency gains relative to their peers.
Conclusions
We identified bank business models that have had different experiences over the past decade. Given the consistently stable performance of retail-funded banks engaging in traditional activities, it comes as little surprise that their model has recently gained in popularity. More surprising is the stability of the group of trading banks, which exhibited sub-par return-on-equity over most of the sample, both in absolute and risk-adjusted terms. While further analysis is needed to uncover the clear benefits to these banks' shareholders, high cost-to-income ratios suggest outsize benefits to their managers.
References
Altunbas, Y, S Manganelli and D Marques-Ibanez (2011): "Bank risk during the financial crisis: do business models matter?", ECB Working Paper Series, no 1394, November.
Ayadi, R and W de Groen (2014): Banking business models monitor 2014 - Europe, Centre for European Policy Studies and International Observatory on Financial Services Cooperatives.
Calinśki, T and J Harabasz (1974): "A dendrite method for cluster analysis", Communications in Statistics, no 3, pp 1-27.
Financial Stability Board (2014): "2014 update of list of global systemically important banks (G-SIBs)", www.fsb.org/2014/11/2014-update-of-list-of-global-systemically-important-banks.
Ward, J H Jr (1963): "Hierarchical grouping to optimise an objective function" Journal of the American Statistical Association, no 58, pp 236-44.
Zaik, E, J Walter, G Kelling and C James (1996): "RAROC at the Bank of America: from theory to practice", Journal of Applied Corporate Finance, vol 9, no 2, pp 83-93.
1 The views expressed in this article are those of the authors and do not necessarily reflect those of the Bank of Thailand or the Bank for International Settlements. We would like to thank Michela Scatigna for outstanding work and valuable advice in the construction of the data on banks. We also acknowledge, without implication, very helpful comments by Claudio Borio, Christian Upper and Hyun Song Shin. All errors remain our responsibility.
2 This is another aspect where our approach differs from that of Ayadi and de Groen (2014). They classify banks using interbank loans, trading assets, interbank liabilities, customer deposits, debt liabilities and derivative exposures.
3 The list of G-SIBs refers to consolidated entities. In our data we have at times more than one firm that belongs to a consolidated group. The reason for this is that in order to use bank/year observations with relatively pure business profiles in some cases we avoided using conglomerate firms. When possible for the largest institutions we opted instead to use individual subsidiaries (banks and securities firms) and not the holding company.
4 RAROC is a commonly used approach for measuring investment performance and comparing the profitability of different business lines. See, for instance, Zaik et al (1996).
5 The cost of equity here is measured in terms of the systematic relationship between the rate of return on the stock of the bank in excess of the risk-free rate and the excess return on the corresponding broad market price index. The parameter was estimated using monthly data.
6 The top performance of retail-funded banks is consistent with the findings in Altunbas et al (2011), who document that banks with a greater share of deposits in their funding mix fared significantly better in the crisis than their peers.