Foreign exchange turnover versus international trade and financial flows
(Extract from page 30 of BIS Quarterly Review, December 2010)
The FX market is the largest financial market in the world, but how does turnover in this market compare with real activity? This box compares turnover in the seven countries that have the most active FX markets with the level of GDP and the volume of trade. It also benchmarks FX activity to trading volumes on major stock exchanges. The seven countries with the most active FX markets are (in decreasing order): the United Kingdom, the United States, Japan, Singapore, Switzerland, Hong Kong SAR and Australia.
The motives for trading a currency may be divided into transactions linked to cross-border trade in goods and services, and transactions related to cross-border financial flows. The left-hand panel of Graph A shows the ratio of global FX turnover for a country, compared to the country's GDP.1 FX turnover is several times larger than the total output of the economy. The FX turnover/GDP ratio is smallest for the largest economies, the United States and Japan. In these two countries, FX turnover is more than 14 times GDP. In most cases, FX turnover has grown faster than GDP, as indicated by the upward-sloping lines.
Graph A also looks at the FX trading activity of different customer types. The centre panel compares FX turnover by other financial institutions with activity on a country's stock exchanges. "Other financial institutions" is a broad category that includes asset managers and institutional investors, who are most likely to be active in cross-border financial markets. (While it would be more appropriate to compare FX turnover with trading volumes in bond markets, where FX hedging activity is more prevalent, data on bond turnover are not available.) FX market turnover is many times larger than equity trading volumes. Again, the ratio of FX turnover to equity turnover is smallest for the United States and Japan, but still sizeable. The growth in FX turnover since 2007 is much stronger than that of equity trading for several countries, as seen in the sharp increase in the slopes.
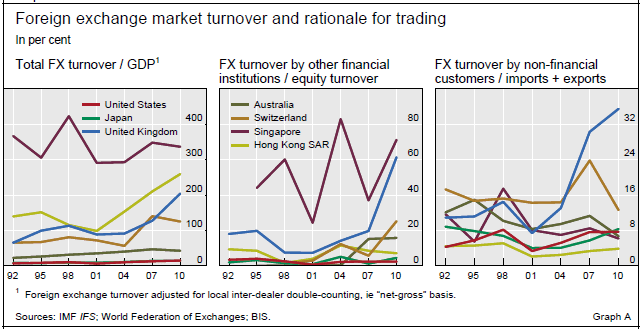
Finally, the right-hand panel of Graph A shows the ratio of FX activity by non-financial customers to gross trade flows. Gross trade flows are defined as the sum of imports and exports of goods and services. FX turnover is much higher than underlying trade flows, although the ratios are an order of magnitude smaller than in the other two panels. A closer look at growth since 2007 shows the decrease in activity by non-financial customers is matched by a drop in trade volumes, at least for the United States and the United Kingdom.
Overall, looking at developments since 1992, it is clear that FX turnover has increased more than underlying economic activity, whether measured by GDP, equity turnover or gross trade flows.
1 All comparisons are based on monthly figures, where daily average FX turnover is multiplied by 20 trading days, and measures of economic activity are yearly figures divided by 12.