OTC derivatives statistics at end-June 2017
- The notional amount of outstanding OTC derivatives contracts rebounded to $542 trillion at end-June 2017.
- The gross market value of outstanding OTC derivatives contracts fell below $13 trillion at end-June 2017, its lowest level since 2007.
- The share of centrally cleared credit default swaps (CDS) jumped to 51% at end-June, as central clearing made further inroads.
Market value of OTC derivatives falls to its lowest level since 2007
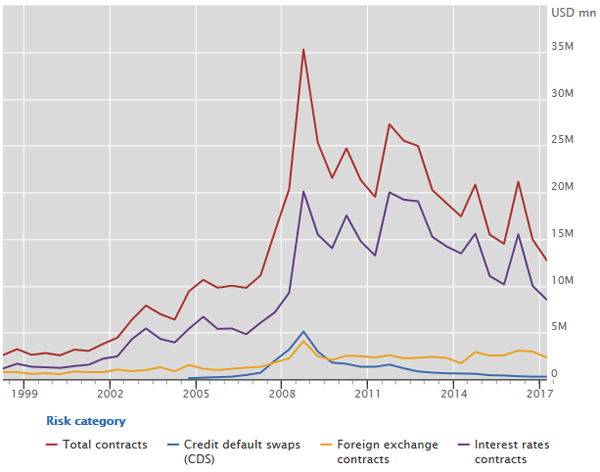
Graph 1: Outstanding gross market value, in trillions (ie in million millions, eg 20M equals 20 million millions,
or 20 trillion) of US dollars (interactive graph).
Source: BIS OTC derivatives statistics (Table D5.1).
In the first half of 2017, the notional amount of outstanding OTC derivatives contracts retraced its earlier decline. Notional amounts rose from $482 trillion at end-December 2016 to $542 trillion at end-June 2017, close to their level of a year earlier. In contrast, their gross market value, which provides a more meaningful measure of market and counterparty credit risk, declined further in the first half of 2017, from $15 trillion to less than $13 trillion (Graph 1). The last time the gross market value of all OTC derivatives had been below $13 trillion was end-June 2007.
Gross credit exposures, which adjust gross market values for legally enforceable bilateral netting agreements (but not for collateral), also fell to their lowest level since 2007. They declined from $3.3 trillion at end-December 2016 to $2.8 trillion at end-June 2017.
Short-term interest rate contracts drive the rise in notional amounts
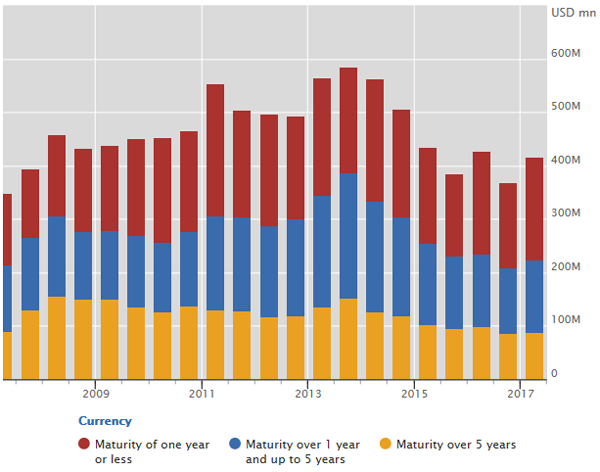
Graph 2: Outstanding notional amount of OTC interest rate derivatives, in trillions (ie in million millions,
eg 400M equals 400 million millions, or 400 trillion) of US dollars (interactive graph).
Source: BIS OTC derivatives statistics (Table D9).
In notional terms, interest rate contracts dominate OTC derivatives markets, and consequently activity in this segment drives overall activity. The notional amount of outstanding OTC interest rate derivatives rose from $368 trillion to $416 trillion in the first half of 2017. Contracts denominated in all major currencies except the yen rose. The appreciation of major currencies against the US dollar over this period boosted the US dollar value of contracts denominated in these currencies, yet even after adjusting for exchange rate movements notional amounts were up.
The rise in notional amounts was concentrated in interest rate contracts with a maturity of one year or less, which climbed from $160 trillion at end-December 2016 to $193 trillion at end-June 2017 (Graph 2). This suggests that the rise was driven by increased positioning and hedging at the short end of the yield curve, possibly in response to changing expectations about the outlook for monetary policy.
Even as notional amounts rose, the gross market value of OTC interest rate derivatives fell further, to $8.5 trillion at end-June 2017. This was its lowest level since 2007. The gross market value of contracts denominated in US dollars fell by 22% in the first half on 2017 to $1.8 trillion. During the same period, there were similar falls for contracts denominated in yen (down by 16% to $0.6 trillion) and in euros (down by 14% to $4 trillion). These declines likely reflected increases in long-term yields, which reduced the gap between market interest rates on the reporting date and rates prevailing at contract inception.
Concentration among FX dealers edges higher
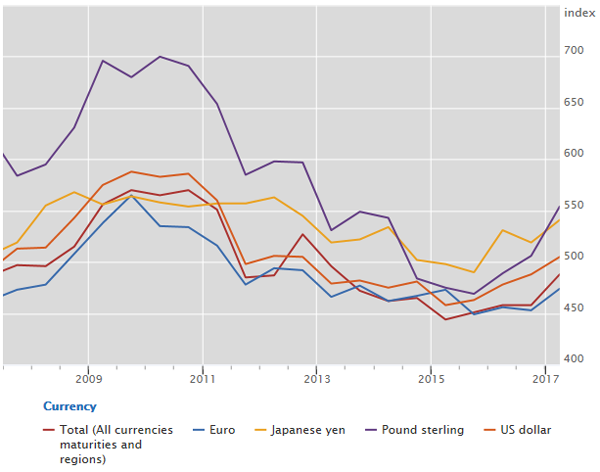
Graph 3: Herfindahl index for FX forwards, FX swaps and currency swaps (interactive graph).
Source: BIS semiannual OTC derivatives statistics (Table D6).
In OTC foreign exchange (FX) derivatives markets, notional amounts rose to a record high of $77 trillion at end-June 2017, up from $69 trillion at end-December 2016. Activity in short-term instruments, in particular FX forwards and swaps, drove the increase. In contrast to other OTC derivatives, most FX derivatives require counterparties to repay the notional amount at maturity and thus can be viewed as a form of collateralised borrowing, with the associated foreign currency repayment and liquidity risks.
Concentration among FX dealers edged higher in the first half of 2017. The concentration of reporting dealers' outstanding positions - as measured by the Herfindahl index, where a higher number indicates that the market is dominated by a few dealers - had fallen steadily in the years after the 2007-09 Great Financial Crisis (Graph 3). This trend stopped in 2015. The Herfindahl index for FX forwards, FX swaps and currency swaps subsequently rose from 444 at end-June 2015 to 488 at end-June 2017, indicating that larger dealers gained market share over this period. Concentration increased across all major currencies. While these statistics refer to notional amounts outstanding, data on trading activity from the 2016 Triennial Survey also showed greater concentration in FX markets.
Cleared segment rises to 51% of CDS market
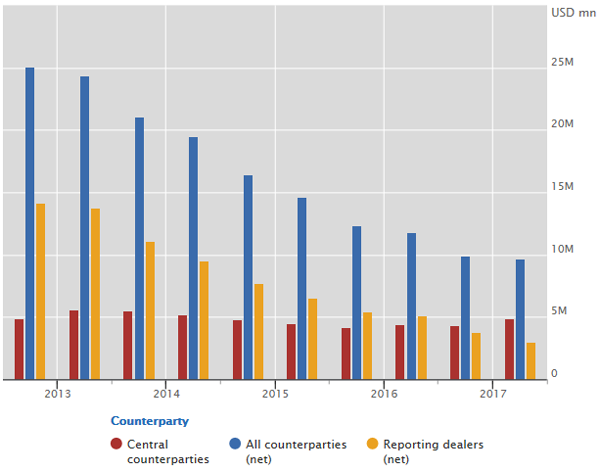
Graph 4: Outstanding notional amount of CDS, in trillions (ie in million millions, eg 10M equals
10 million millions, or 10 trillion) of US dollars (interactive graph).
Source: BIS OTC derivatives statistics (Table D10.1).
Central clearing continued to make inroads in OTC derivatives markets. As regards CDS markets, the cleared segment (red bars in Graph 4) rose from $4.3 trillion to $4.9 trillion in the first half of 2017, even as the total notional amount of outstanding CDS declined slightly. Consequently, the share of outstanding CDS cleared through central counterparties (CCPs) jumped from 44% at end-December 2016 to 51% at end-June 2017. Bilateral contracts between reporting dealers declined further in the first half of 2017, to $2.9 trillion. These shifts are consistent with the novation of contracts between dealers to CCPs.
Turning to OTC interest rate derivatives markets, the share of central clearing was little changed in the first half of 2017. Reporting dealers' positions booked against CCPs rose in parallel with the rise in notional amounts, to $320 trillion at end-June 2017. This left the share of cleared positions at 77%, similar to the share a year earlier.