I. No clear skies yet
![]() Watch the video (00:02:04)
Watch the video (00:02:04)
with Agustín Carstens, General Manager of the BIS
Listen to the podcast (00:15:25)
with Agustín Carstens
Key takeaways
- Although global growth appears to have hit a soft patch late last year, the resilience of services and buoyant labour markets bode well for the near term.
- Risks remain on the horizon. Trade and manufacturing may slow further, especially if trade tensions escalate. Deleveraging in some major emerging market economies, weak bank profits in advanced economies and high corporate debt may all act as a drag on growth.
- Normalising policy against this backdrop involves potential trade-offs: what is good for today need not necessarily be good for tomorrow. More fundamentally, monetary policy cannot be the engine of growth. A greater role for fiscal, structural and prudential policy would contribute more effectively to sustainable growth.
Over the past 12 months, the global economy slowed down. After a robust upturn that pushed global growth well above potential in 2017, growth was set to moderate somewhat. As the year progressed, however, the slowdown exceeded expectations. In late 2018, world trade growth weakened substantially and financial markets dived. In response, the Federal Reserve and other major central banks put the very gradual and anticipated tightening of monetary policy on pause. Financial markets quickly rebounded and were supported by subsequent signs that economic activity had firmed. The outlook, though, remained uncertain as a further escalation of trade tensions unnerved financial markets in May.
The signs of resilience augur well for the near-term outlook. Services have held up better than manufacturing and trade, while employment growth and solid wage increases have underpinned consumption. Moreover, except in some, relatively small economies, credit and financial conditions are still acting as tailwinds for economic activity. Yet significant near-term risks remain. Notably, the trade and political uncertainty that contributed to the global slowdown over the past year can flare up again. And China's much needed deleveraging could resume, again causing its economy to slow with global implications. Looking further ahead, high levels of private and public debt in many economies represent a macroeconomic vulnerability.
The room for policy manoeuvre to address these risks has narrowed since the Great Financial Crisis (GFC) of 2007-09, and regaining it has proved harder than originally thought. One example is monetary policy. After shoring up the economy during the GFC, with other policies taking a back seat, central banks were instrumental in supporting the subsequent recovery. While central banks succeeded, an inflation rate stubbornly below objectives even with economies seemingly operating close to potential has made it harder to proceed along the normalisation path. In addition, after the prolonged period of plentiful accommodation, financial markets have proved very sensitive to signs of policy tightening while some financial vulnerabilities have emerged. As a result, intertemporal trade-offs have come to the fore. The continuation of easy monetary conditions can support the economy, but make normalisation more difficult, in particular through the impact on debt and the financial system. The narrow normalisation path has become narrower.
To ensure sustainable growth, a more balanced policy mix is in order. Hard as it is politically, the only way to promote sustainable growth is to redouble efforts to implement structural reforms. These have been lagging in the last few years except for the financial system, where prudential regulation and supervision have been strengthened. Within sensible fiscal frameworks, using resources to boost sagging public investment and making spending and taxation more efficient should also help. And, needless to say, in a global economy tightly knitted together through both the production (global value chains) and financial channels, the reduction of trade tensions would provide a widespread and sustained boost to growth and jobs.
The chapter first describes the key economic and financial developments over the past year. It then discusses the main drivers of growth and financial vulnerabilities. Finally, it elaborates on the difficult challenges monetary policy is facing.
The year under review
The global economy loses momentum
Overall, the past year was a good one for the world economy. Global growth (in purchasing power parity terms) is estimated to have edged down to 3.7% in 2018, from a cyclical high of 3.9% in 2017, slightly below expectations at the start of the review period (Graph I.1, first panel).
Some slowdown was to be expected. Amid continuing very easy financial conditions globally, growth in 2017 had been surprisingly strong and above potential in an unusually large number of countries. Using conventional measures of slack, several economies appeared to carry far more momentum into the future than had been the case in previous business cycle expansions (see Box I.A in last year's Annual Economic Report). Indeed, unemployment rates in several advanced economies had reached multi-decade lows, helping to cement a recovery in private consumption. Fiscal policy had turned expansionary in many countries. And, boosted by above-average business confidence, fixed capital investment had finally accelerated, especially in advanced economies. As a result, global trade and manufacturing output had rebounded sharply from the lows reached in 2016 (Graph I.1, second panel).1
As 2018 progressed, however, indications emerged that the slowdown was deeper than private and official forecasters had projected. New export orders continued to decline, and world trade growth came to a sudden stop towards year-end. Capital goods investment disappointed, especially in Europe, China and other Asian emerging market economies (EMEs). Purchasing managers' indices (PMIs) for manufacturing moved lower - even pointing to a contraction in several economies in early 2019 (Graph I.1, third panel). Consumption also slowed, but generally proved considerably more resilient, helping to support services. In the second quarter, there were some signs that activity had firmed somewhat in advanced economies and that fiscal easing and other measures put in place by China's authorities had started to bear fruit. Unfortunately, at the time of writing (end of May), sentiment was again hit by renewed trade tensions.
The timing and extent of the slowdown differed across major economies and regions. In the United States, growth actually rose for 2018 as a whole, to an estimated 2.9%, from 2.2% in 2017, not least owing to a strong tax-driven procyclical fiscal expansion. It then weakened slightly towards year-end, broadly in line with projections. In China, growth is estimated to have edged down from 6.7% in 2017 to 6.6% in 2018. This outturn went hand in hand with a large unexpected drop in fixed investment and a sizeable contraction in import growth. Given the size of Chinese imports, these developments made a noticeable contribution to the drop in world trade and growth.
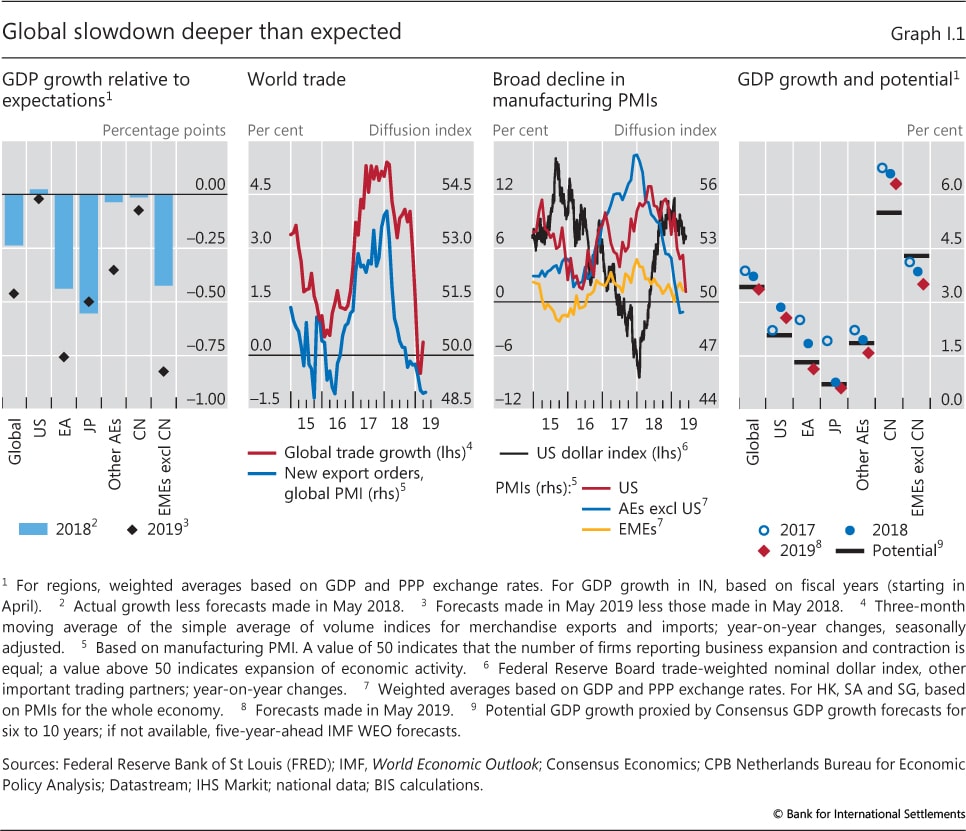
The slowdown was deeper in the euro area, Japan and most EMEs than elsewhere (Graph I.1, first and fourth panels). In the euro area, growth is estimated to have fallen to 1.8% in 2018, around half a percentage point below the forecast at the start of the review period, but still above potential. While the drops in world trade and exports were a major force, a variety of country-specific factors weighed on domestic demand. In Japan, declining exports and natural disasters pushed growth down to 0.8%, despite the partial offset of stronger than expected investment.
Driven by slumping exports and lower investment, growth in EMEs outside China also disappointed (Graph I.1, first panel). As the dollar reversed course and started appreciating in early 2018, financial conditions tightened somewhat in EMEs - a development that may have further weakened manufacturing activity and trade (third panel). The sharpest tightening occurred in the most vulnerable EMEs, typically those with larger current account deficits and greater reliance on foreign funding. Turkey and Argentina suffered a currency crisis and sharp output contractions. Yet contagion to other EMEs remained limited.
As the outlook deteriorated and uncertainty rose, growth projections were marked down significantly, pushing them closer to or slightly below estimates of potential (Graph I.1, fourth panel). Global growth was expected to slow to 3.4% in 2019, half a percentage point lower than forecast at the start of the review period. The largest revision concerned EMEs excluding China. Elsewhere, including the United States and China, revisions were smaller (first panel). Most revisions, even small ones, were accompanied by statements highlighting an unusual concentration of downside risks.
Financial markets go through large swings
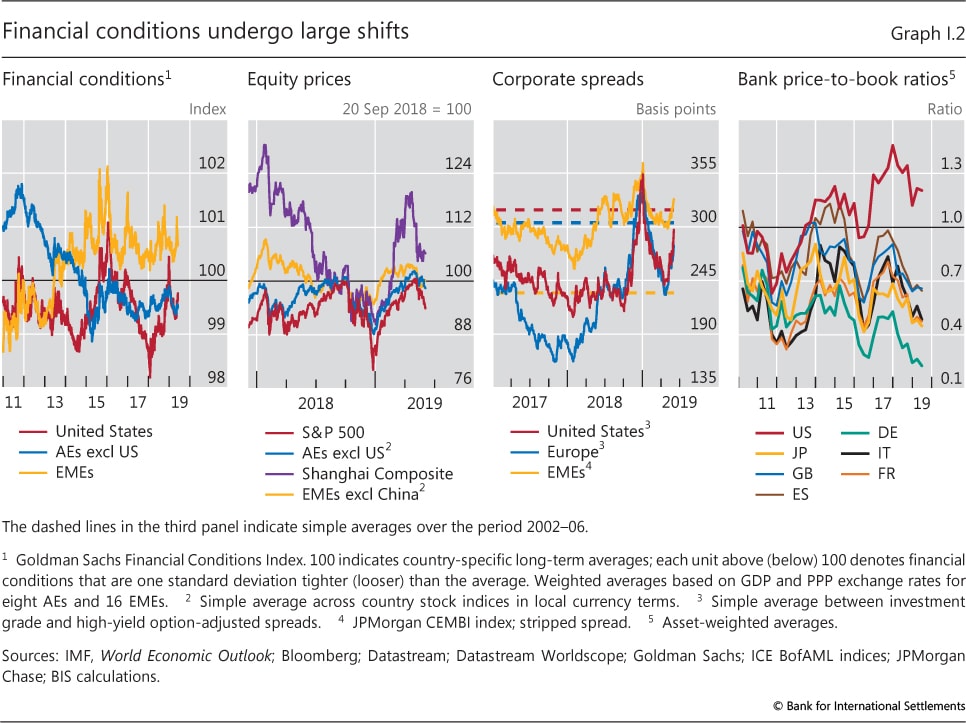
As global trade growth slowed and downside risks grew, equity and corporate bond markets experienced sharp losses, initially in October and then again in December. Until then, financial conditions in the United States had remained easy by historical standards, notably as reflected in a long rally in the stock market and narrowing risk spreads against the backdrop of unusually low interest rates (Graph I.2). This had occurred despite the continued tightening by the Federal Reserve. By contrast, in the first half of 2018, financial conditions had actually tightened in EMEs (first panel).
The causes of the market slump, while not entirely clear, can be traced to a number of factors. Evidence based on stock returns indicates that earnings expectations fell while uncertainty surrounding them rose substantially; and that the future course of monetary policy and high corporate debt may also have played a role (see Box I.A for further details). In the euro area, the deterioration of the growth outlook was more evident, and so was its adverse impact on an already fragile banking sector. Price-to-book ratios fell further from already depressed levels, reflecting increasing concerns about banks' health (Graph I.2, fourth panel).
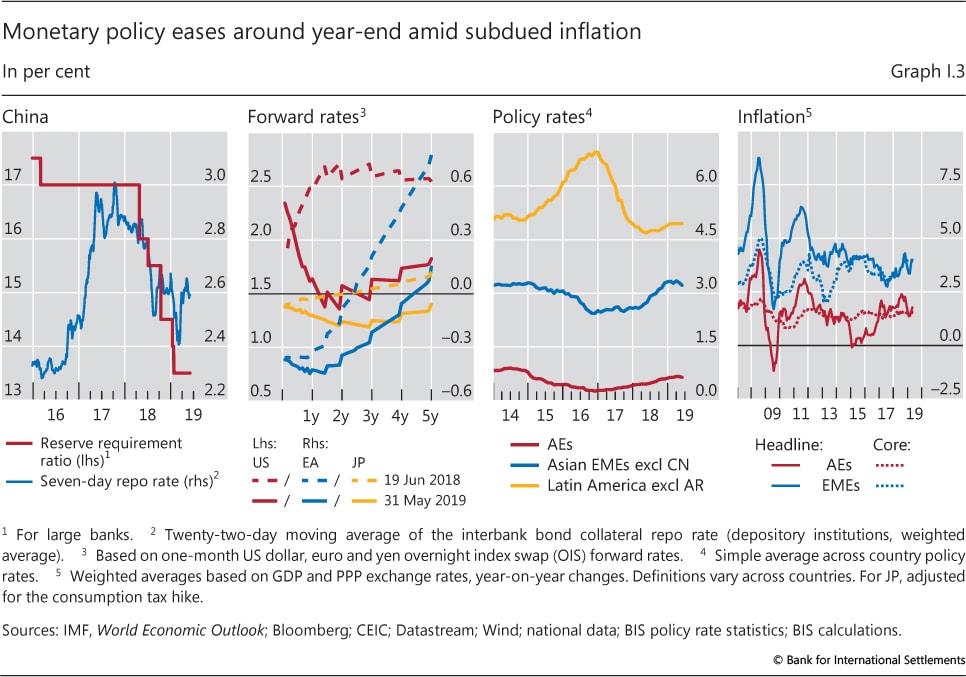
Major central banks reacted to a deteriorating outlook and tighter financial conditions by easing their stance. The People's Bank of China moved first by cutting reserve requirements several times as of mid-2018 (Graph I.3, first panel) and introducing measures to help banks refinance and support small and medium- sized enterprises (SMEs). After hiking the policy rate three times from March and having its balance sheet run off at a predetermined pace, the Federal Reserve eventually moved late in the year, signalling that its tightening cycle was nearer the end than previously expected. Initially, in December, it gave indications about the policy rate and, following the sharp tightening of financial conditions, about its balance sheet in January and finally March. The ECB announced in March 2019 that it would keep reference rates unchanged at least until the end of the year - a six-month extension - and that it would renew its long-term refinancing operations (LTROs) for banks, albeit on potentially less generous terms than previously. The Bank of Japan further eased its very accommodative stance. In response to these shifts in monetary policy, forward interest rates in major economies moved down (Graph I.3, second panel).
Several other economies also adopted a more accommodative stance. As external conditions weakened, central banks in advanced small open economies and EMEs put planned policy rate increases on hold or even cut rates (Graph I.3, third panel).
Monetary policy easing was facilitated by the rather surprising continued absence of significant inflationary pressures in most economies. As oil prices fell from mid-2018 to early 2019, headline inflation in both advanced and emerging market economies declined towards core inflation. In advanced economies, core inflation continued to hover at or below inflation targets (Graph I.3, fourth panel). Its stability partly reflected the persistent lack of strong unit labour cost pressures: tighter labour markets did boost real wage growth, but this hardly exceeded productivity growth. Moreover, firms appear to have absorbed increases in unit labour costs by accepting smaller profit margins or by cutting other costs (see Box I.B for further details).
Box I.A
What drove US financial market volatility in late 2018?
In October and, after a brief respite, again in December 2018, US equity prices fell sharply and corporate bond spreads decompressed. Moreover, corporate issuance declined and bond and loan funds experienced outflows, unusually large ones in December. What were the causes of market volatility? Were external developments more important than domestic ones? How important were expectations of monetary policy? To answer these questions, the analysis in this box follows three distinct approaches: it compares the dynamics of US equity valuations with those of its possible drivers; it examines differences in stock returns on firms with high exposures to major countries to illustrate the importance of global connections; and it evaluates whether the co-movement between stock returns and either growth expectations or funding costs was unusually high in January, especially for riskier and more leveraged firms.
The decline in the US stock market in October and December can be traced primarily to a downgrade in growth expectations and a rise in earnings uncertainty (Graph I.A, left-hand panel). The fall in US growth expectations was particularly large by historical standards in October. The rise in earnings uncertainty was also sizeable, especially in December. Expectations of further monetary policy tightening played a key role late in the year, but had a more limited impact on stocks in October, as suggested by the muted response of equity prices to policy announcements. For example, on 3 October when, in addition to positive macroeconomic data releases, the Fed signalled that policy rates were still some distance away from a neutral level, 10-year sovereign yields rose by 10 basis points on the day but equity prices did not budge.
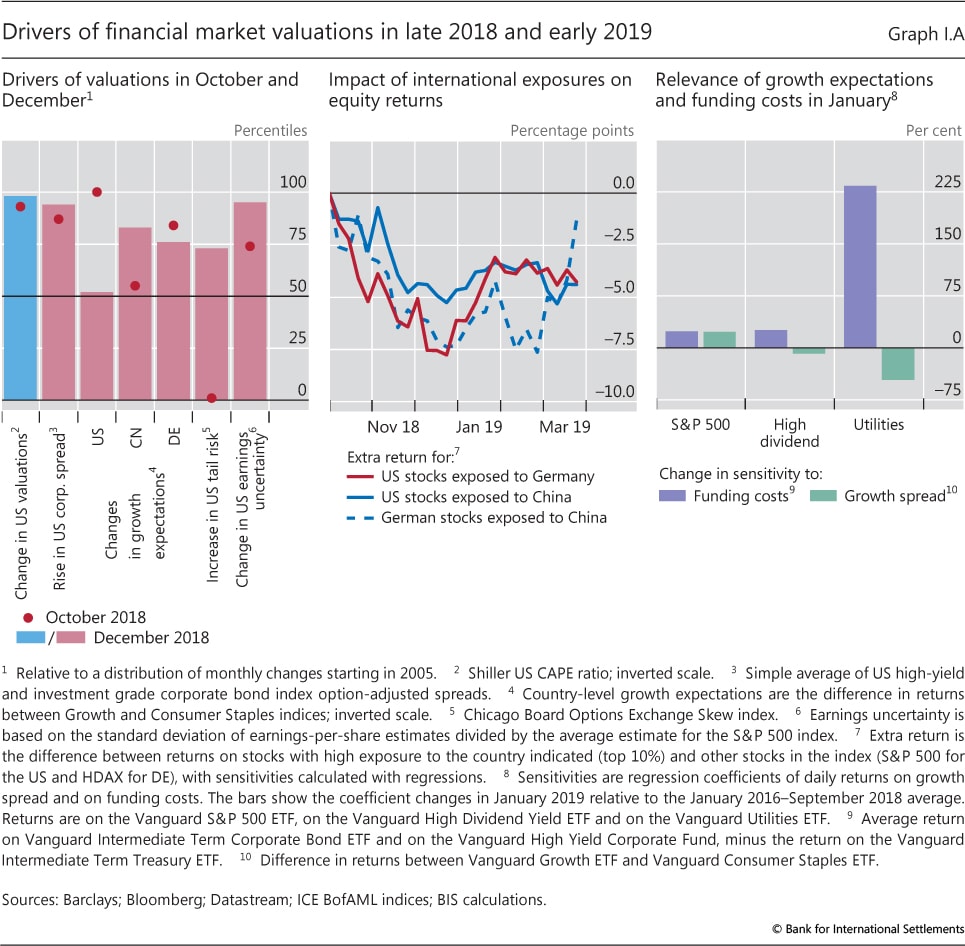
The weakening global economy and its potential impact on US growth seem to have been a key factor behind declining growth expectations and rising earnings uncertainty. Indeed, firms with large direct and indirect exposures to China lost more than their peers (Graph I.A, centre panel). Indirect links appear to have been particularly important: US firms exposed to Germany lost about the same as German firms exposed to China. Concerns about Germany were, in turn, likely to have been amplified by weakness in other German export markets, including Turkey. Coinciding with persistent growth risks overseas, the rise in US earnings uncertainty in December was quite large relative to historical patterns (left-hand panel).
In addition, concerns intensified that monetary policy might be insufficiently flexible in responding to the deteriorating corporate and growth outlook. Bond spreads for US high-yield companies rose much more in December than in October (roughly 100 versus 60 basis points), with outflows from bond and loan funds and a sizeable rise in overall spreads by historical standards (Graph I.A, bars in left-hand panel). Moreover, a measure of tail risk for US equities advanced quickly in the week leading to the December Federal Open Market Committee meeting, before retreating shortly afterwards. This contrasts with muted equity tail risks in October, when actual volatility rose (dots in left-hand panel). At the same time, unease about the economic outlook rose in December, as reflected in the elevated volatility of growth-sensitive equities prior to important macroeconomic data announcements.
The rally in risky assets in early 2019, after the shift in US monetary policy outlook, seems to have owed to both improved growth expectations and lower funding costs. The response of the broader stock market to these factors was roughly in line with historical patterns (Graph I.A, right-hand panel). However, for utilities firms, which tend to be highly leveraged, lower funding costs proved the key driver of returns. By the end of May, the S&P was 6% short of its mid-September 2018 peak, and corporate spreads had retraced about one third of their increase between early October and end-2018.
Growth expectations are measured as the difference between returns on stocks whose value responds more strongly to the economic outlook (growth stocks), eg electronics, and returns on stocks that remain more stable through the business cycle (consumer staple stocks), eg household goods. Similarly, country-specific growth expectations are measured with the return difference between growth and consumer staple stock indices that include local companies. The two measures quantify risk in different ways. The Chicago Board Options Exchange Skew index uses prices of options on the S&P 500 that insure against tail risk. Preannouncement volatility reflects uncertainty about the economic data that are about to be released. When economic uncertainty is high, stocks more sensitive to the economic outlook (growth stocks) tend to be relatively more volatile before macroeconomic announcements.
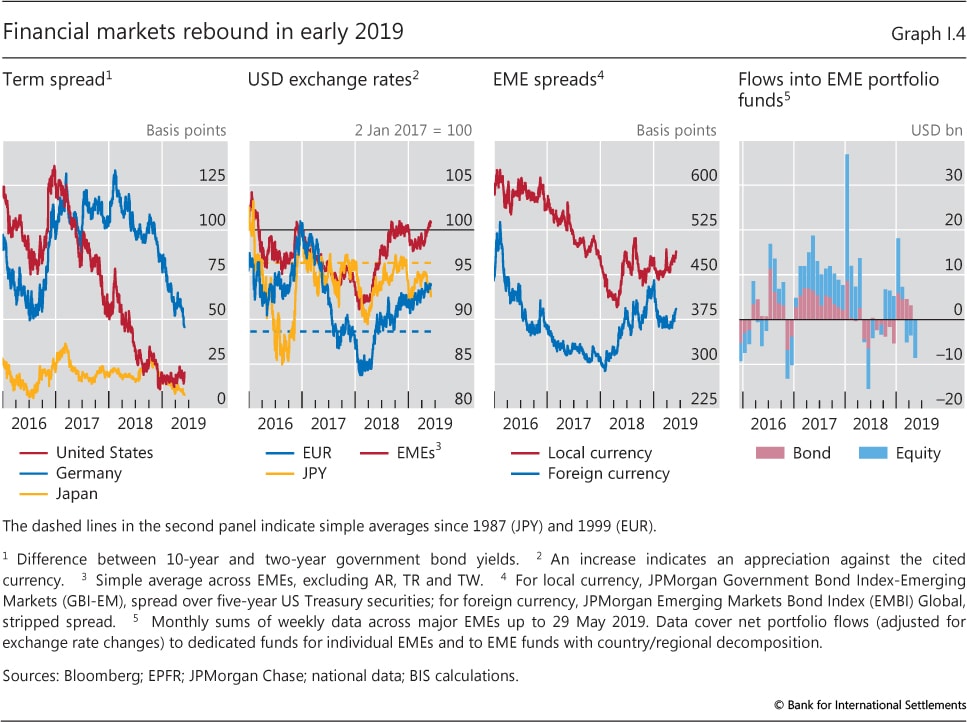
Following the easier policy stance, financial markets rebounded in early 2019. Stock markets initially recouped most of their previous losses, but retreated somewhat in May as trade tensions again intensified (Graph I.2). On the back of lower expected policy rates, yield curves continued to flatten in major economies (Graph I.4, first panel). Investment grade corporate spreads, especially in the United States, narrowed closer to pre-crisis benchmarks. And after end-2018, high-yield spreads dropped again below pre-crisis averages. Following an initial depreciation around the turn of the year, the US dollar strengthened, approaching levels prevailing in early 2017 (second panel). In EMEs, foreign currency spreads fell to levels seen in mid-2018 (third panel) and capital flows briefly resumed (fourth panel).
At the time of writing (end of May), financial markets were jittery about escalating trade and geopolitical tensions. With investors' risk appetite diminishing, yield curves in advanced economies flattened further at the end of May and portfolio flows into EMEs again showed signs of weakening. That said, looking through short-term market volatility, financial conditions remained easy by historical standards, especially in the United States and other advanced economies.
Drivers of growth
Recent developments raise several important questions. Why did growth slow more than expected? What forces were at work? How likely is it that growth could slow further? Answering these questions is inevitably hard.2 Even so, it is possible to identify a number of factors that have been at play in the past year and some vulnerabilities that could at some point contribute to a future slowdown.
Outcomes in the year under review appear to have reflected the interaction of contrasting forces. Some forces - which obviously prevailed - slowed the expansion. One such force was growing economic and political uncertainty and downside risks linked primarily to trade tensions and country-specific developments. Another, temporary force was the weakness in the global demand for electronics. Yet, a more important one was Chinese authorities' much needed efforts to contain leverage and to pursue a structural rebalancing of the economy towards consumption-driven growth - efforts whose near-term effects on economic activity were compounded by rising trade-related concerns. Given China's size and tight links with the rest of the world, weakness in that country quickly spread around the globe. Global value chains played a key role, possibly also through a tightening of financial conditions associated with the further appreciation of the dollar - a tightening that no doubt weighed on EMEs more generally. Besides China, some smaller economies that had been less affected by the GFC began to feel the drag of turning financial cycles, but given their size the impact should have had contained global repercussions.
Other forces helped buttress global demand. In particular, the relative resilience of consumption drew strength from buoyant labour markets as employment increased further and wage growth picked up. Moreover, in some of the larger economies that had been hard hit by the GFC, the subsequent deleveraging of the household sector meant that, in aggregate, financial cycle expansions remained a source of strength.
Why has inflation remained low despite rising wages?
Over the past year, wage growth has finally gained some strength, especially in the United States, Japan and Germany where the cycle is now mature and official unemployment rates close to record lows. Albeit timidly, wage inflation is responding to tighter slack in the economy, suggesting that conventional wage Phillips curves are still a valid benchmark. That said, current wage inflation has yet to translate into higher consumer price inflation. Why has the transmission been so muted thus far?
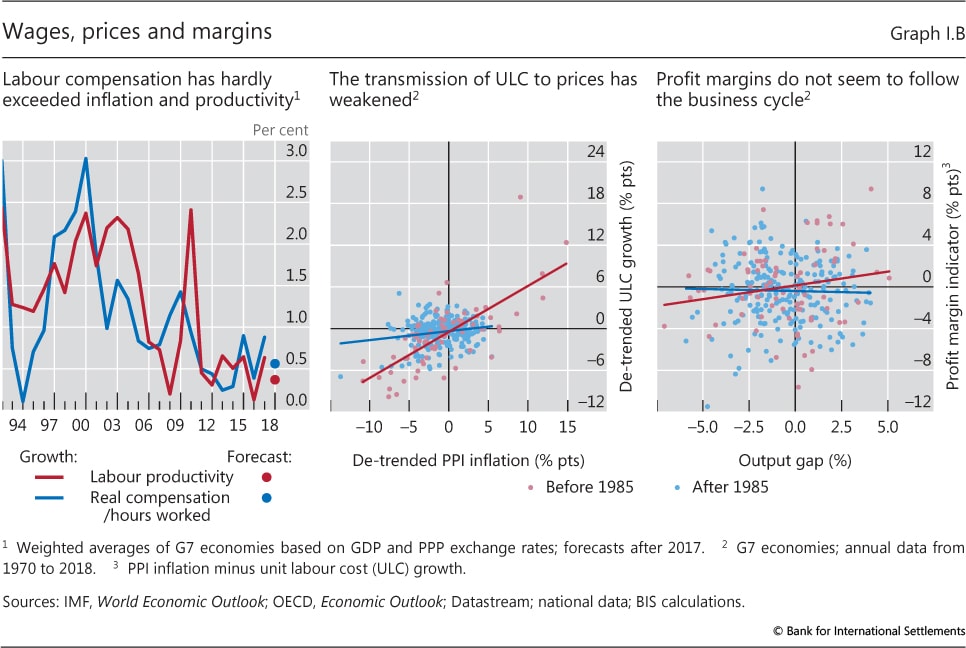
The evolution of real wage growth relative to productivity gains holds part of the answer. In the recent years, growth in labour compensation came mostly on the back of productivity gains (Graph I.B, left-hand panel); once these are accounted for, real (inflation- adjusted) compensation per unit of product has hardly increased. Recent developments seem unlikely to reverse this trend. The share of income that accrues to labour has been on a declining path in many countries, reflecting to a large extent a continued erosion of workers' bargaining power. This phenomenon, which may have contributed to the flattening of the wage Phillips curve, owes to structural factors that are unlikely to change in the near term. First, globalisation and the integration in the global economy of China, India and the former Soviet bloc have increased the effective supply of labour and made labour markets contestable, exposing workers to the threat of production relocation. Second, unionisation has steadily declined, making it more difficult for workers to capture a larger share of productivity gains. Third, technological change continues to shape the demand for labour. Automation of manufacturing processes has enabled firms to substitute labour with capital and may now threaten even "high- quality" blue-collar jobs. Going forward, progress in the application of artificial intelligence, advanced data analytics, cloud computing and other technological advances is likely to also weaken the bargaining power of white-collar workers who have been spared so far. Fourth, a large share of recent job creation has occurred in certain low productivity growth services sectors. This trend may continue in the near term as economies become increasingly service-oriented. Finally, a higher retirement age has led in recent years to an increase in the participation rate of older workers, whose wages are generally less sensitive to slack than those of younger workers.
Another part of the answer reflects how firms adjust their profit margins or other costs. While strong in the 1970s and 1980s, the correlation between the growth in unit labour costs (ULCs) and contemporaneous and subsequent price inflation has weakened considerably in the most recent period (Graph I.B, centre panel). This disconnect is also visible in another well documented finding - the flattening of the price Phillips curve - and mirrors the increase in the profit share (the counterpart of a lower labour share).
 With larger margins, firms should have more room than in the past to absorb fluctuations in ULCs.
However, from a theoretical perspective it is unclear whether profit margins should necessarily decrease in response to demand pressures, hence making the price Phillips curve flatter than its wage counterpart. Indeed, if wages are "stickier" than prices - as it is normally the case - profit margins should increase when demand grows. Yet firms may also decide to reduce their margins in an upswing to gain market share. For highly indebted firms or firms with difficult access to credit, financial factors may also play a role: in a downturn, such firms may be reluctant to lower prices to avoid losing the cash needed to meet their financial obligations or new spending. This may explain, for example, why inflation fell less than forecast during the GFC.
 Similarly in an upswing, firms may take advantage of easy credit conditions to moderate price increases and hence strengthen their customer base. Empirical evidence on the cyclicality of profit margins tends to be inconclusive (Graph I.B, right-hand panel).
Accepting a reduction in margins is not the only way firms may respond to rising ULCs. Firms can alternatively change the quality and composition of their products or cut other costs. For example, in certain sectors such as the retail fashion industry, firms are increasingly using "quantum pricing". They design their products to match a small number of prices. And when production costs change, they may choose to redesign their product lines (eg adjust the quality or composition of their products) rather than changing their quantum prices. This illustrates how the pricing (and marketing) policies of part of the corporate sector may have become far more complex than what is assumed by mainstream macroeconomic models.
All in all, there remains considerable uncertainty as to when and how far current labour market tightness will translate into price inflation. But it is clear that muted inflation pressures from increasingly tight labour markets are no boon for monetary policy. Weaker cyclical pressures can enable idiosyncratic factors to drag inflation rates below target, which may eventually lead long-term expectations to drift down. Counteracting this would require the continuation or even a further strengthening of the accommodative stance. But this would put a stop to normalisation, preventing the rebuilding of policy space to face the next downturn and potentially raising significant intertemporal trade-offs (see below).
See eg BIS, 87th Annual Report, June 2017, Box IV.A. For an overview, see eg BIS, 87th Annual Report, June 2017, Chapter IV; A Stansbury and L Summers, "Productivity and pay: is the link broken?", PIIE Working Papers, no 18-5, June 2018, document that compensation and productivity growth are still connected, although the strength of the relationship may have diminished since the 2000s. See B Mojon and X Ragot, "Can an ageing workforce explain low inflation?", BIS Working Papers, no 776, March 2019. This result has been well documented in the literature, especially in the United States; see eg E Peneva and J Rudd, "The passthrough of labor costs to price inflation", Journal of Money, Credit and Banking, vol 49, no 8, November 2017, pp 1777-1802, and references therein; however, recent results based on euro area data in E Bobieca, M Ciccarelli and I Vansteenkiste, "The link between labor cost and price inflation in the euro area", ECB Working Papers, no 2235, February 2019, point in the opposite direction. See eg L Ellis and K Smith, "The global upward trend in the profit share", BIS Working Papers, no 231, July 2007; S Barkai, "Declining labor and capital shares", London Business School Working Papers, 2017; and S Calligaris, C Criscuolo and L Marcolin, "Mark-ups in the digital era", OECD Science, Technology and Industry Working Papers, no 2018/10. This is the "customer market" model described in E Phelps, Structural slumps: a modern equilibrium theory of unemployment, interest and assets, Harvard University Press, 1994. See eg S Gilchrist, R Schoenle, J Sim and E Zakrajšek, "Inflation dynamics during the financial crisis", American Economic Review, vol 107, no 3, March 2017, pp 785-823. J Rotemberg and M Woodford, "The cyclical behaviour of prices and costs", Handbook of Macroeconomics, Chapter 16, 1999, hint at countercyclical markups; by contrast, C Nekarda and V Ramey, "The cyclical behaviour of the price-cost markup", NBER Working Papers, no 19099, November 2013, find either procyclical or acyclical markups; C Macallan, S Millard and M Parker, "The cyclicality of mark-ups and profit margins for the United Kingdom: some new evidence", Bank of England, Working Papers, no 351, August 2008, also find that the profit margin moves procyclically in the United Kingdom. Not only do quantum prices make prices stickier, but they also have important implications for the computation of consumer price indices and may lead to the mismeasurement of inflation. See D Aparicio and R Rigobon, "Quantum prices", MIT Working Papers, forthcoming; and R Rigobon, "What can online prices teach us about exchange rate pass-through and the law of one price?", keynote lecture at the final conference of the BIS Consultative Council for the Americas Research Network on "Exchange rates: key drivers and effects on inflation and trade", August 2018.
These contrasting forces go a long way towards explaining the patterns that characterised the slowdown. The trade-intensive manufacturing sector weakened more than services, investment suffered more than consumption, and the United States held up better than China, the euro area and a number of EMEs.
Looking ahead, the balance of these forces could help sustain the expansion further. Still, some risks remain. The factors that slowed growth have not gone away and might intensify. And a number of financial vulnerabilities could act as a drag if the economy weakened. These relate primarily to corporate balance sheets, household balance sheets in some of the smaller economies, and weak bank profitability in a number of advanced economies. Underlying several of these vulnerabilities is the continued overdependence of the economic expansion on very accommodative monetary conditions and higher debt, globally, compared with pre-crisis.
Confidence and uncertainty
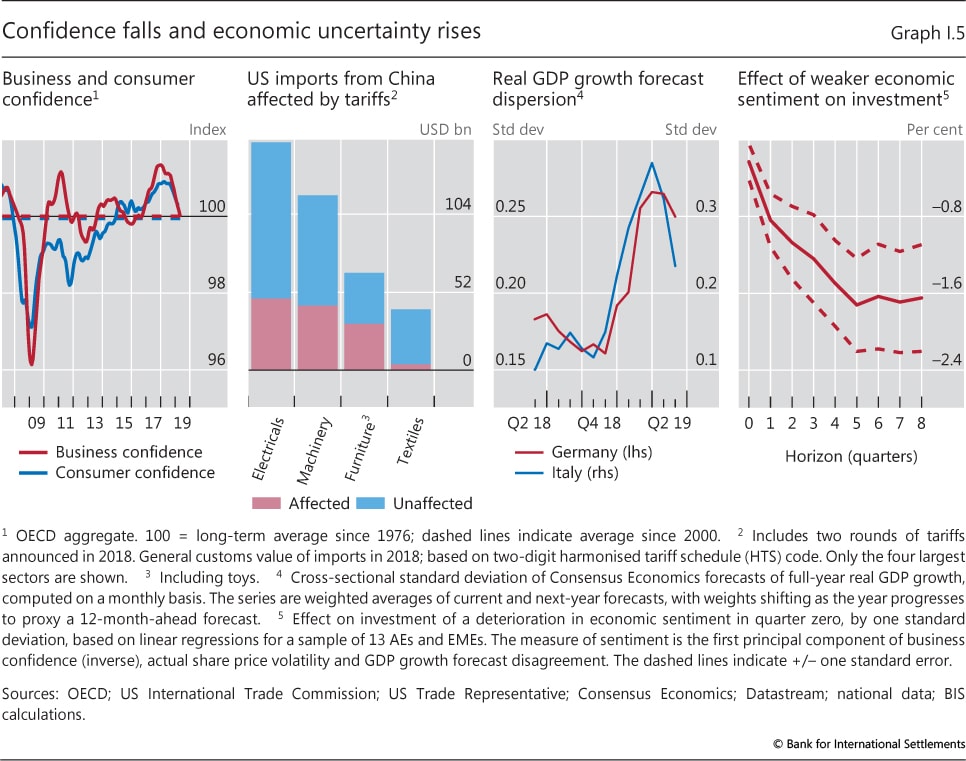
Over the past year, business and consumer confidence retreated steadily from their cyclical highs (Graph I.5, first panel). Lingering trade tensions, especially between China and the United States, dampened business sentiment, in part due to concerns about a possible escalation of tariff hikes (second panel). In addition to clouding future demand and fixed investment prospects, the trade tensions raised questions about the viability of existing supply chain structures and, more generally, about the future of the global trading system.
But trade tensions were not the only factor sapping confidence. In Europe, fiscal stress in Italy, problems with auto emission testing in Germany, street protests in France and the possibility of a disruptive Brexit also contributed. These factors are likely to have dampened growth expectations and made future growth more uncertain - hence, for instance, the increased dispersion of growth forecasts around the turn of the year (Graph I.5, third panel). A more vulnerable global economy, in turn, increased corporate earnings uncertainty in the United States and other major economies (Box I.A). Existing measures suggest that higher uncertainty and lower business confidence have historically coincided with reduced investment activity (Graph I.5, fourth panel).
China's deleveraging
As the review period confirmed, China continues to face a deleveraging challenge. The authorities are engaged in a delicate, in fact unprecedented, balancing act. They are seeking to ensure a smooth transition to a service-based economy and to reduce the serious macroeconomic risks linked to an outsize financial boom while maintaining overall economic growth on a satisfactory path.
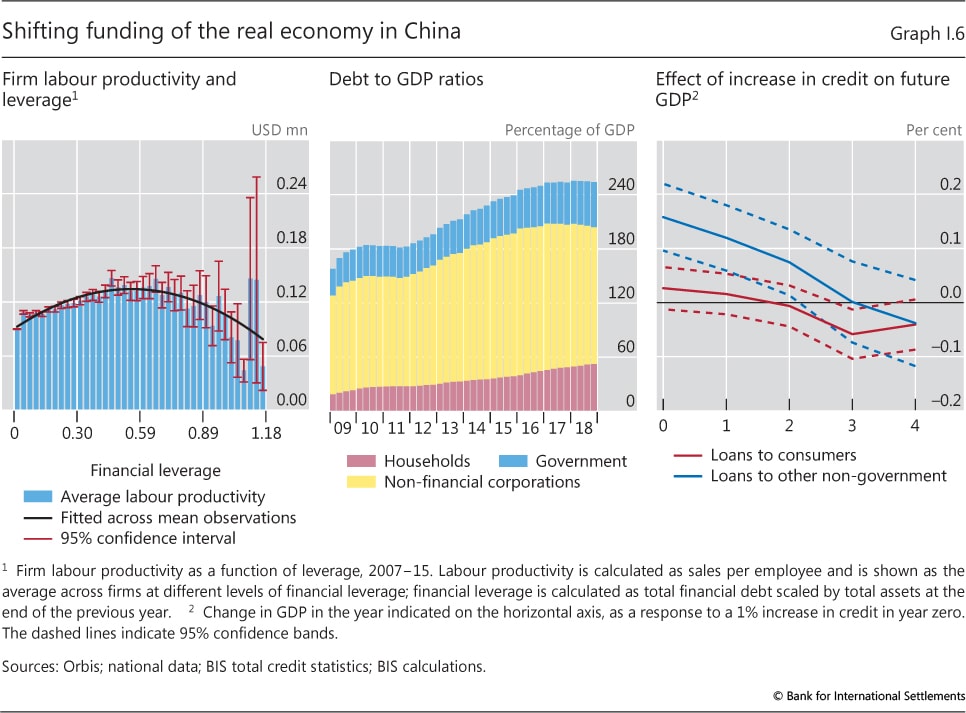
Over the past year, the authorities took further measures designed to restrict shadow banking and, more generally, to deleverage the economy. These measures constrained, in particular, local government spending and the activity of SMEs, which over the past decade had largely relied on shadow banking finance. Partly as a result, SMEs saw their working capital and profitability decline sharply (Box I.C). Policymakers also took further measures to restrict bank lending to highly polluting and excess capacity industries. These decisions, while much needed from a longer-term perspective, no doubt depressed investment and economic activity in the near term, adding to the woes from large debt overhangs. Firm-level data suggest that, beyond a certain threshold, firms that have accumulated more debt tend to be relatively less productive, reflecting past credit misallocation (Graph I.6, left-hand panel). Naturally, trade tensions exacerbated these problems, especially for the export-oriented sectors.
The decline in credit growth to non-financial businesses was offset by a further increase in household and on-budget government debt. As a result, the non-financial sector debt-to-GDP ratio - a measure of leverage - was broadly unchanged (Graph I.6, centre panel). That said, the shift in the composition of debt may, on balance, have slowed growth. Estimates using provincial-level data suggest that, unlike business loans, consumer loans do not have a discernible impact on GDP in the first year, and reduce it after three years (right-hand panel). This is probably because consumers use credit mainly to purchase residential property, whereas firms use it for fixed investment.
Deleveraging and SME financing in China
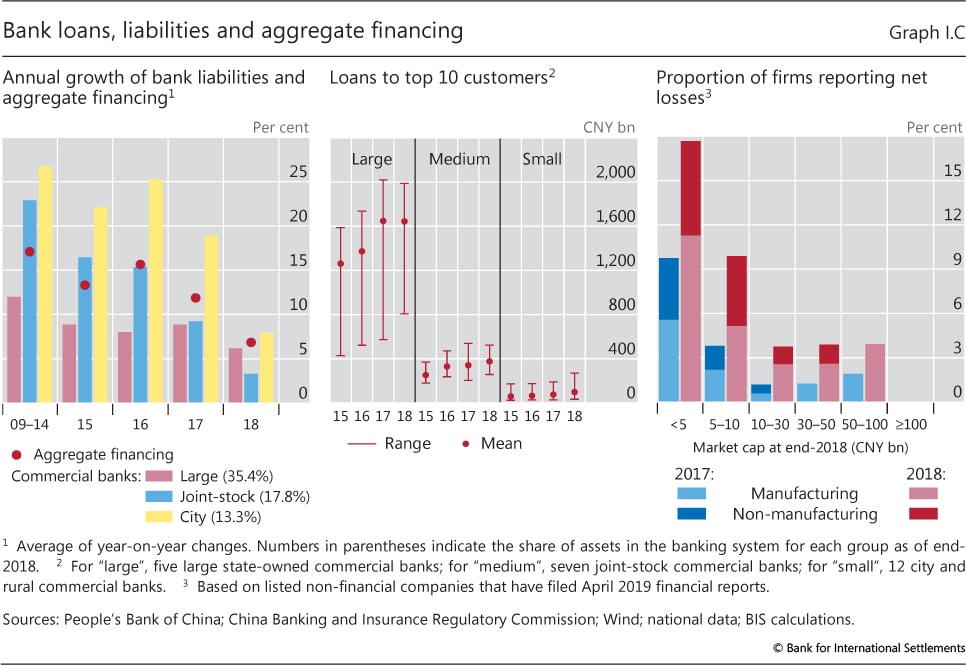
A key objective of Chinese regulatory authorities has been to reduce corporate leverage and, by extension, the size of the shadow banking sector. This sector's rapid expansion between 2009 and 2016 was mainly bank-funded. Small and medium-sized banks such as joint-stock and city commercial banks played a key role, as they tried to circumvent regulations and extend credit through special off-balance sheet vehicles, trust funds and brokers. During this period, growth in the liabilities of these banks, which account for around one third of total banking system assets, consistently outpaced that of aggregate financing for the real economy (Graph I.C, left-hand panel).
Measures taken by authorities have stabilised growth in the shadow banking sector, but at the cost of tightening financial conditions. Privately owned small and medium-sized enterprises (SMEs) were particularly affected. The reduction in shadow bank lending has stretched smaller banks' lending capacity, as many previously off-balance sheet risky assets have been brought back onto balance sheets. These banks primarily serve SMEs, while the larger ones provide credit to large state-owned firms (Graph I.C, centre panel).
The economic slowdown and rising trade tensions exacerbated the plight of SMEs, including a large number of manufacturing firms. Detailed data on SME performance are not available. However, the latest financial data for listed firms show that while the proportion of non-financial firms reporting losses in 2018 increased across the board, it was small-cap companies and manufacturers that suffered most (Graph I.C, right-hand panel). The effect is macroeconomically significant: the fall in profits for the smallest category of firms erased 0.2 percentage points of GDP growth. Further, this group saw close to a 40% fall in market cap in 2018, one and a half times that of the market as a whole. This reflected growing concerns about future profitability and, by extension, firms' financial health, given high debt.
Chinese authorities have responded to these developments by encouraging banks to increase their lending to SMEs. Measures adopted by the People's Bank of China since June 2018 include increasing the central bank's quota of refinancing and rediscounted loans to smaller banks. Moreover, the authorities have incentivised lending to SMEs by using the level of such lending as the basis for lowering reserve requirements and providing access to a new central bank facility for loans of up to three years. In April 2019, the government also cut the value added tax rate that applies to sales of goods in the manufacturing sector from 16% to 13%. The effects of these measures started to show in Q1 2019, as total outstanding bank loans to small and micro enterprises rose by 19% year on year, more than 5 percentage points above the growth rate of other loans.
Trade and global value chains
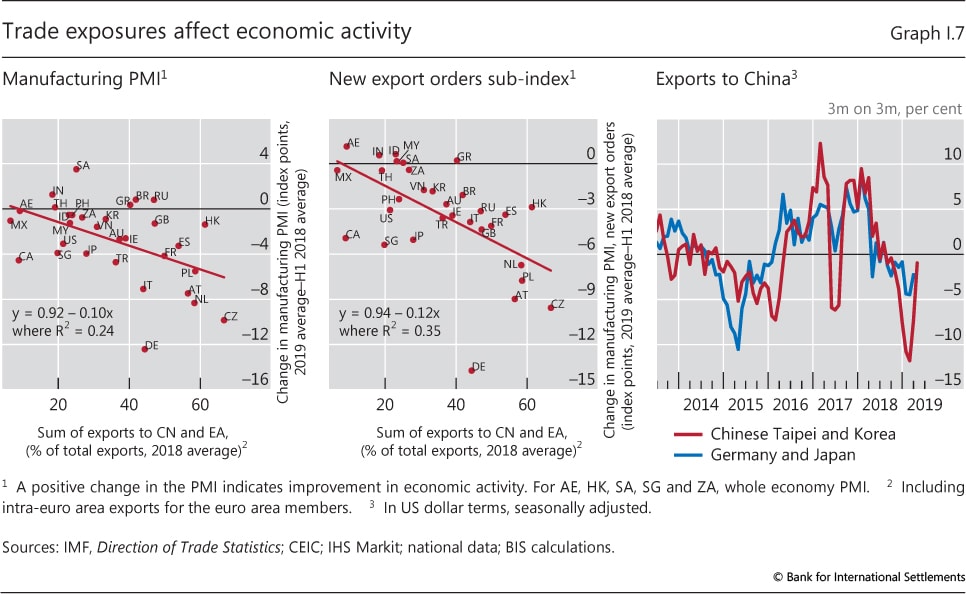
As China slowed, partly contributing to the slowdown in the euro area - another major trading powerhouse - global trade took a hit. Countries that trade more intensively with both economies tended to experience a larger drop in manufacturing activity and new export orders (Graph I.7, left-hand and centre panels). To some extent, the fall reflected a decline in intermediate goods transacted within global value chains (right-hand panel). For example, for Chinese Taipei and Korea, intermediate goods account for 76-81% of all exports to China.
The effects of the slowdown on trade were probably amplified by tighter financial conditions in EMEs, in part owing to the US dollar's tendency to appreciate in 2018. Around 80% of global bank trade financing is denominated in dollars. In several countries, not only are firms highly indebted (see below), but a large share of their debt is denominated in dollars (Chapter II). Furthermore, long value chains are highly dependent on external finance for working capital. For all these reasons, activity in the value chains and trade is likely to be sensitive to a dollar appreciation.3 Such sensitivity is one factor that can help explain why the dollar and global trade in manufacturing moved in sync during the review period (Graph I.1, second and third panels).
Consumption and the services sector
Even as trade and manufacturing activity decelerated, global consumption remained relatively robust on the back of sustained employment and wage growth (Graph I.8, left-hand panel). The resilience of consumption may also partly explain why the services sector outperformed manufacturing. But structural factors have probably also contributed: the composition of consumption has generally been shifting towards services, albeit not uniformly across countries (centre panel).
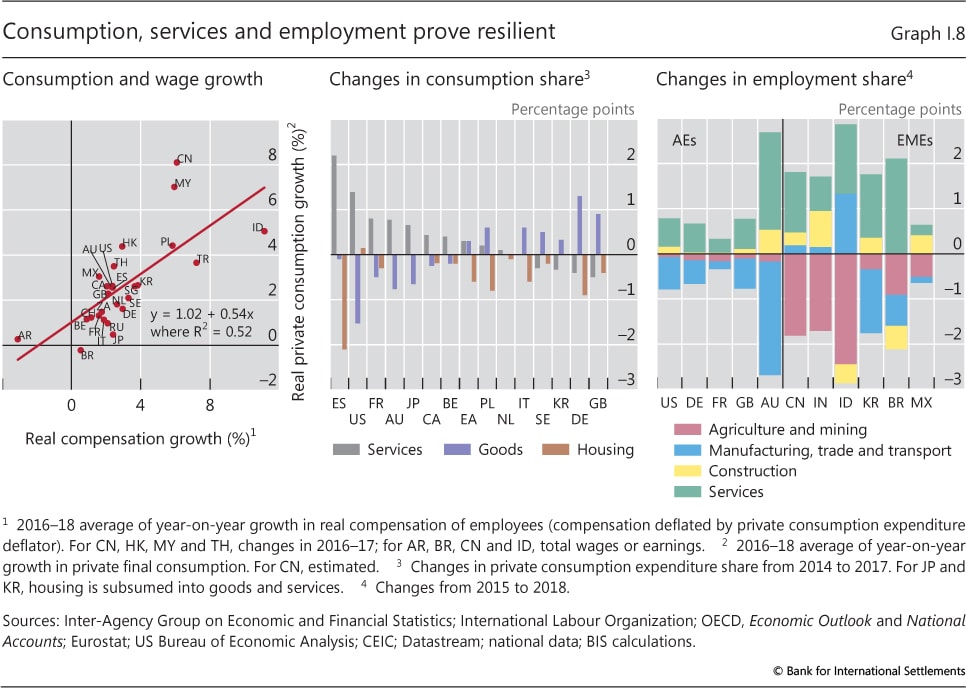
In turn, these trends have supported job creation, given that the services sector is labour-intensive. At the same time, digital technology has increasingly enabled the provision of more services across borders. As a result, over the past four years, employment shares in services have risen in both advanced and emerging market economies (Graph I.8, right-hand panel). By contrast, the employment shares in manufacturing have generally declined.
Financial cycles
The dilemma Chinese policymakers have been facing is just an instance of a broader phenomenon. Since the mid-1980s, medium-term fluctuations in credit and property prices - in short, financial cycles - have grown in duration and amplitude and have become a more important determinant of business fluctuations (see Box I.B in last year's Annual Economic Report). To be sure, such cycles differ in intensity across countries and over time. And they depend fundamentally on policy. For instance, the post-crisis financial reforms, by strengthening financial systems, have no doubt muted their costs. But they all share some key dynamics. New credit and rising asset prices tend to support aggregate demand and economic activity. But, over time, the accumulation of debt raises debt service commitments, which can weigh down persistently on the expenditures of indebted households and firms. Hence, once the financial cycle turns, the positive effects of new credit give way to the negative effects of debt servicing and declining asset prices on spending. As a result, measures of financial cycle expansions have proved useful leading indicators of subsequent economic downturns (Graph I.9, left-hand panel). Indeed, such measures have been found to outperform yield curve variables as indicators of recession risk.4
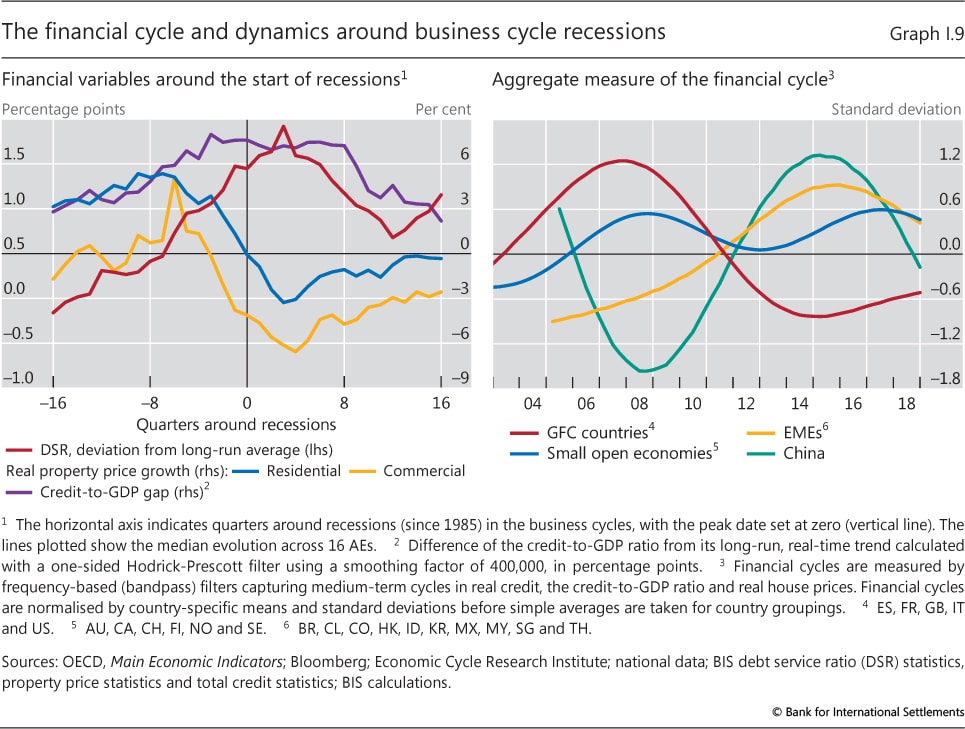
Financial cycles need not be synchronised around the world. In fact, countries currently find themselves in different phases. This can be illustrated with a simple composite measure that combines the behaviour of credit and property prices. In countries less affected by the GFC, where recessions had largely been imported via trade, financial cycles continued to expand and now appear to have turned. This is true not only of China but also of many EMEs and advanced small open economies (Graph I.9, right-hand panel). All else equal, this suggests weaker demand in these economies going forward and may already have been a factor behind their slowdown over the past year. As a group, including China, these economies account for around one third of global GDP. By contrast, in crisis-hit countries such as the United States and some European countries, which had already seen a financial bust at the time, the financial expansion is less mature, suggesting some support to global growth.
At the same time, sectoral differences are also apparent, in line with the features of the pre-crisis financial expansion. In countries that were not at the heart of the GFC, both household and corporate debt have continued to rise. In the others, the household sector has deleveraged and resumed building up debt only recently. But the corporate sector has generally leveraged further, in some cases to the point of generating vulnerabilities.
Household debt and house prices
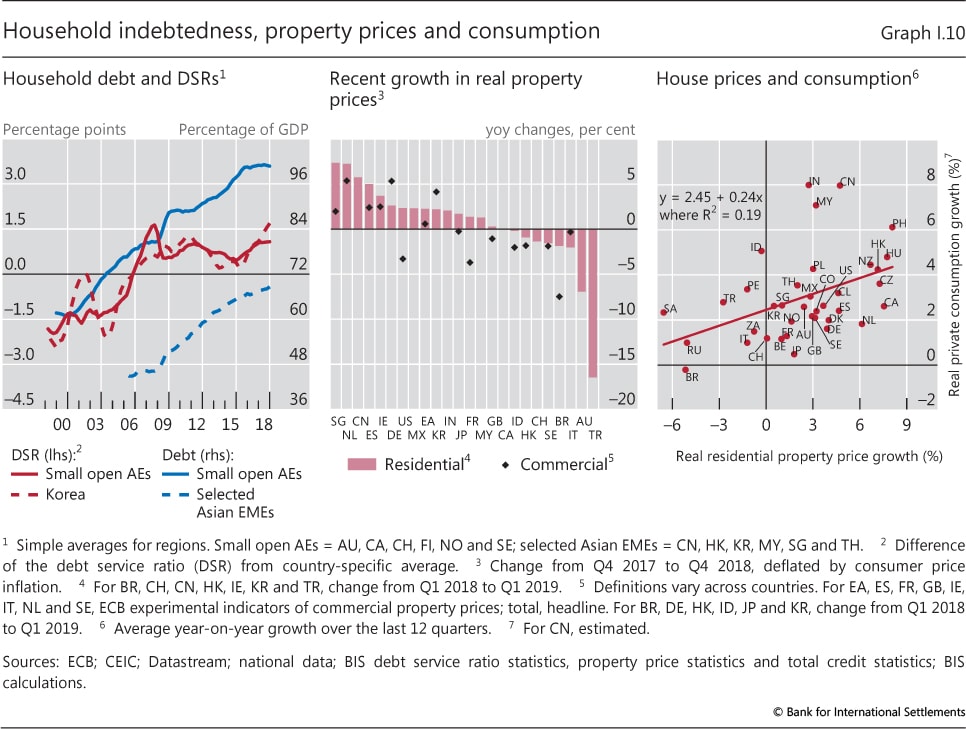
Household debt has reached new historical peaks in a number of economies that were not at the heart of the GFC, and house price growth has in many cases stalled. For a group of advanced small open economies, average household debt amounted to 101% of GDP in late 2018, over 20 percentage points above the pre-crisis level (Graph I.10, left-hand panel). Moreover, household debt service ratios (DSRs), capturing households' principal and interest payments in relation to income, remained above historical averages despite very low interest rates. In selected Asian EMEs, household debt climbed to 69% of GDP, compared with 46% pre-crisis. Some advanced economies, in particular Australia and to a lesser extent Sweden, have already seen downward corrections in residential property prices (centre panel).
High household debt and anaemic or negative house price growth may already have begun to weigh on private consumption in some of these countries. For example, for the advanced small open economies that began to see a decline in house prices, private consumption growth slowed on average by around half a percentage point in 2018, including by over 1 percentage point in Canada and Sweden. This is consistent with experience in recent years, which have seen a relatively close correlation between growth in private consumption and residential property prices in a broad sample of AEs and EMEs (Graph I.10, right-hand panel).
While in Asian EMEs private consumption has so far mostly proved resilient, debt dynamics raise concerns about future debt servicing burdens and, by extension, consumption. In Korea, where data on household debt servicing costs are available, the household DSR has evolved similarly to that in advanced small open economies (Graph I.10, red lines in the left-hand panel).
By contrast, following the post-crisis deleveraging, household balance sheets proved to be a source of strength in the economies that had been at the core of the crisis. Household debt-to-GDP ratios there generally remained below pre-crisis levels. Thus, rising house prices combined with strong labour markets supported consumption and growth (Graph I.10, centre panel). Given the size of these economies, developments there go a long way in explaining why global consumption growth held up relatively well. That said, private consumption did show signs of slowing towards late 2018 even in some core economies in the euro area.
Vulnerabilities from high corporate debt
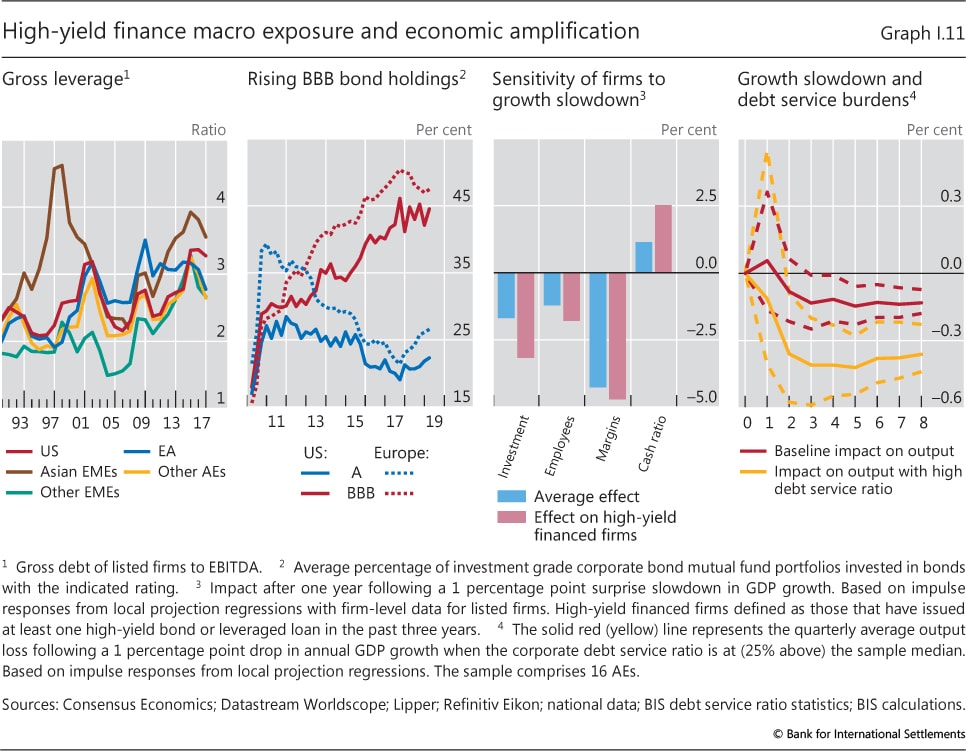
Even after retreating somewhat, corporate leverage remained close to historical highs in many regions. In the United States in particular, the ratio of debt to earnings in listed firms was above the previous peak in the early 2000s (Graph I.11, first panel). Leverage in emerging Asia was still higher, albeit below the level immediately preceding the 1990s crisis. Moreover, lending to leveraged firms - ie those borrowing in either high-yield bond or leveraged loan markets - has become sizeable. In 2018, leveraged loan issuance amounted to more than half of global publicly disclosed loan issuance (loans excluding credit lines).
High indebtedness makes firms more vulnerable to a possible tightening of financial conditions, regardless of the source. Even in an environment of continuing very low interest rates, financial conditions could tighten substantially if earnings faltered. The strong outflows from bonds and loan funds and the sharp widening of AE and EME spreads in late 2018 illustrate how fast markets can shift (Box I.A).
Market characteristics can influence the extent to which financial conditions respond to a deteriorating business environment. In particular, following a long-term decline in credit quality since 2000, the share of issuers with the lowest investment grade rating (including financial firms) has risen from around 14% to 45% in Europe and from 29% to 36% in the United States.5 Given widespread investment grade mandates, a further drop in ratings during an economic slowdown could lead investors to shed large amounts of bonds quickly. As mutual funds and other institutional investors have increased their holdings of lower-rated debt, mark-to-market losses could result in fire sales and reduce credit availability. The share of bonds with the lowest investment grade rating in investment grade corporate bond mutual fund portfolios has risen, from 22% in Europe and 25% in the United States in 2010 to around 45% in each region (Graph I.11, second panel).
How financial conditions might respond depends also on how exposed banks are to collateralised loan obligations (CLOs). Banks originate more than half of leveraged loans and hold a significant share of the least risky tranches of CLOs. Of these holdings, US, Japanese and European banks account for around 60%, 30% and 10%, respectively. In general, banks are likely to face lower losses from direct securitisation exposures and should be in a better position to manage them than in the 2006-07 subprime crisis, given the reform-induced stronger capital and liquidity cushions. That said, the concentration of exposures in a small number of banks may result in pockets of vulnerability. CLO-related losses could reveal that the search-for-yield environment has led to an underpricing and mismanagement of risks. In turn, this could generate dynamics that would bring banks' direct and indirect exposures to the fore. All else equal, more vulnerable would be banks that have extended credit lines to leveraged borrowers, have links with asset managers active in the CLO market, find it hard to accumulate loss-absorbing capital (eg because of profitability issues), and/or depend on short-term (eg FX swap) funding markets.
Tighter financial conditions could dampen investment, amplifying any slowdown. The effect would tend to be larger in countries where firms are more leveraged, play a larger role in investment, are more exposed to commercial property price (and hence collateral-value) declines, and borrow in foreign currency. Econometric evidence suggests that, following a slowdown, investment by high-yield financed firms drops by twice as much as that of other firms (Graph I.11, third panel). In the United States, during 2015-17, as much as 40% of capital expenditures took place in high-yield financed firms.6 Among economies with relatively high corporate debt, commercial property prices have declined over the past year in France, Sweden and the United States (Graph I.10, centre panel). And after years of strong issuance in international markets, outstanding FX-denominated debt securities issued by non-financial corporates amounted to $4 trillion at end-March 2019; of that total, around $850 billion is set to mature in the next two years.
Firms would be more vulnerable if inflation eventually rose and monetary policy tightened substantially in response. While debt service ratios have been kept at bay by low interest rates, rising debt has raised their sensitivity to policy rates. Estimates for a panel of advanced economies suggest that high corporate debt service ratios amplify any slowdown in output growth (Graph I.11, yellow line in fourth panel).
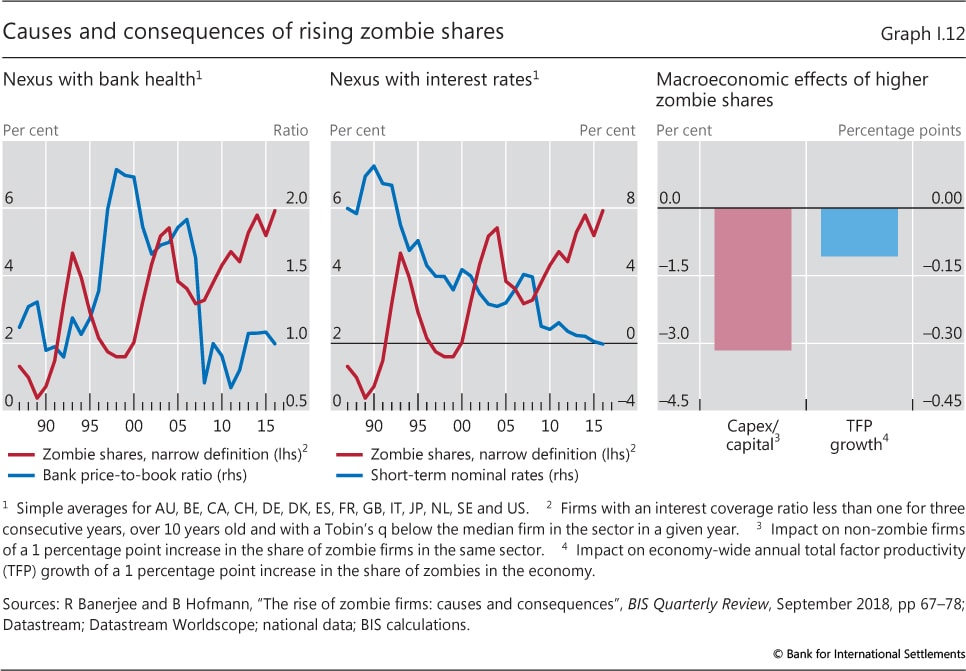
The continued increase in corporate debt has consequences also for the aggregate productive potential of the economy. Firms that are unable to cover debt servicing costs from operating profits over an extended period and that have muted growth prospects - so-called zombie firms - have been on average 40% more leveraged than their profitable counterparts.7 Since the 1980s their share has risen, alongside the deterioration in banks' perceived health, as reflected in price-to-book ratios (Graph I.12, left-hand panel), and with declining interest rates (centre panel).8 Zombie firms currently make up around 6% of non-financial listed firms and account for 2.5% of their capital stock.9 They sap economy-wide productivity growth not only by being less productive themselves, but also because they crowd out resources available to more productive firms. Evidence suggests that their increase over time has had an economically significant macroeconomic impact (right-hand panel).10
Banks' condition
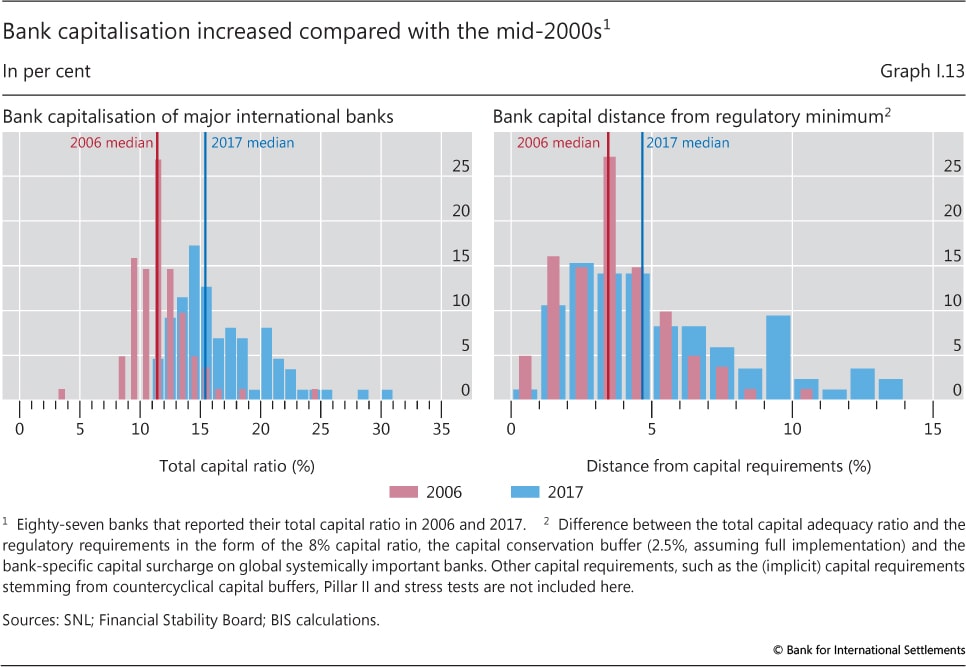
Banks' ability to support the economy, especially in a downturn, depends on how well capitalised and profitable they are. Thanks to the Basel III reforms, bank capitalisation has increased substantially (Graph I.13, left-hand panel).11 As a large body of evidence indicates, not only does a stronger capital base improve bank stability,12 it also supports more lending.13 Moreover, as capital is significantly above regulatory requirements, banks are also less likely to curtail lending to avoid breaching them. Estimates suggest that capital buffers increased significantly from the mid-2000s (right-hand panel). For the median large bank, the buffer rose from some 3 to 5 percentage points between 2006 and 2017 (vertical lines).14
However, in order to support the economy, banks also need to be profitable. In general, profits are the main source of capital increases, help raise external funding at lower cost, and represent the first line of defence against losses. Hence, sustainable profitability underpins resilient lending. Moreover, low profitability may also lead to credit misallocation. Less profitable banks are more likely to evergreen loans or lend to zombie firms, thereby crowding out funding for new, more productive ones. In turn, over time, credit misallocation may depress bank profits further, thus setting in motion a vicious cycle.
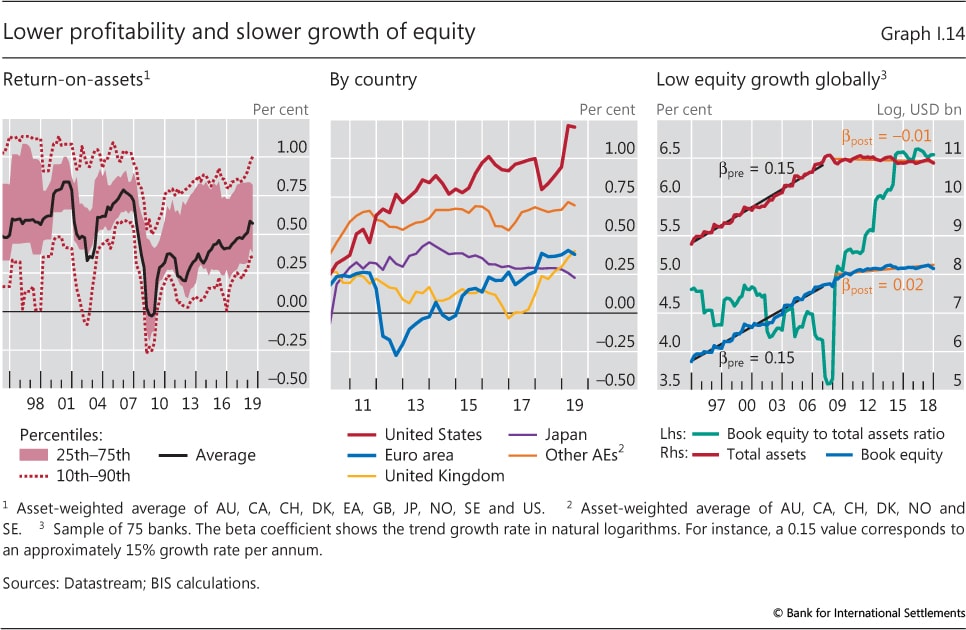
Unfortunately, bank profitability has been lacklustre. In fact, as measured, for instance, by return-on-assets, average profitability across banks in a number of advanced economies is substantially lower than in the early 2000s (Graph I.14, left-hand panel). Within this group, US banks have performed considerably better than those in the euro area, the United Kingdom and Japan (centre panel). Looking ahead, depressed market valuations, as reflected for instance in lower price-to-book ratios, suggest lingering concerns about long-term profitability. Furthermore, the increase in capitalisation has occurred to a large degree owing to slower asset growth (right-hand panel). Hence, going forward, weak profitability could potentially constrain credit growth through slower equity accumulation.
Both macroeconomic and banking-specific factors have sapped bank profitability. On the macro side, persistently low interest rates and low growth reduce profits. Compressed term premia depress banks' interest rate margins from maturity transformation.15 Low growth curtails new loans and increases the share of non-performing ones. Therefore, should growth decline and interest rates continue to remain low following the pause in monetary policy normalisation, banks' profitability could come under further pressure.16
To improve profitability, banks face challenges. Costs remain stubbornly high relative to income. Business models have yet to be restructured on a sustainable basis - in particular, adapting to a lower and flatter yield curve. Banks are also facing increasing competition from non-traditional players, such as big techs, which are taking advantage of digital innovation (Chapter III). Those banks saddled with antiquated legacy IT systems are more vulnerable. Furthermore, overcapacity lingers, as bank exit is much harder than in other sectors.
The public sector can play a useful role in boosting bank profitability. Authorities can demand tighter provisioning policies (eg via asset quality reviews). Such policies may facilitate the task of addressing enduring non-performing loans,17 which weigh on bank valuations, especially in some euro area jurisdictions.18 The authorities can also improve the resolution mechanism to facilitate orderly exit. Removing obstacles from cross-border mergers could similarly help consolidation. Finally, the public sector could implement much needed growth-boosting structural reforms and, in economies with limited fiscal space, could maintain fiscal discipline so as to avoid putting the banking system at risk.
Similar questions about the resilience of bank lending arise in the context of FX funding. International banks intermediate substantial foreign currency funds. Most of these are denominated in US dollars, and a sizeable portion in euros. In addition, a large share of FX funding takes place through FX swaps and is not captured on balance sheets.19 Given the dominant role of the US dollar in the international banking system, as the GFC showed, dollar funding can easily come under pressure at times of stress.20 This puts a premium on appropriate backstop mechanisms.
Monetary policy challenges
The challenges monetary policy is facing today are best understood against the backdrop of the GFC's long shadow. Not only did central banks prevent the economy from falling into a tailspin as the crisis broke out, they also took the lead in establishing the basis for the subsequent recovery, as other policies did not provide sufficient support. And they did so successfully, supporting the economy's return to potential. In the process, inflation rates have for years remained below target for the main advanced economies, even when economies have been operating with limited spare capacity. Faced with these conditions and the puzzling behaviour of inflation, central banks could keep policy accommodative for some time, both in terms of interest rates and in terms of the size and composition of their balance sheets. Policy rates had previously never been negative in nominal terms in major economies, and they have now been negative in real (inflation-adjusted) terms for even longer than during the Great Inflation era. And balance sheets have seen an unprecedented expansion.
Central banks have been responsive in the rapidly evolving context. In the year under review, the uncertainties in the global economy, notably related to the trade tensions, and the sensitivity of financial markets have induced a pause in the monetary policy normalisation process in advanced economies. Nevertheless, central banks find themselves in a predicament, as the path ahead has narrowed. On the one hand, the room for policy manoeuvre has shrunk substantially since the GFC. Tackling a downturn or a further downward slide in inflation would stretch monetary policy further. This puts a premium on regaining policy space by proceeding along a tightening path. On the other hand, with subdued inflation, signs of weakening economic activity have made it hard for central banks to continue along that path, not least as it may risk de-anchoring inflation expectations. While ideally inflation convergence on the back of sustained growth would open the way to tightening policy gradually and steadily, in practice persistently low inflation and doubts about the resilience of economic growth have delayed it. And, as the GFC has receded in time, financial vulnerabilities have built up.
Potential intertemporal trade-offs
All this has brought to prominence some delicate potential intertemporal policy trade-offs. These would arise in those situations where policy actions have welcome effects in the short run but raise the risk of unwelcome ones in the longer run. Under normal conditions, this is not an issue. Reducing interest rates when inflation is below target and output is depressed pushes them towards desirable levels. But if inflation remains unresponsive and interest rates have to be kept low for long, then financial vulnerabilities can build up and the room for policy manoeuvre can be consumed. This takes policymakers outside their comfort zone and requires extra care. Deciding the extent and pace of policy normalisation today exemplifies these potential challenges. Central banks are fully aware of such trade-offs. Inevitably, a good degree of judgment is needed. That is why decisions may differ across countries and circumstances.
In such conditions, adopting a more gradual approach is justified on several grounds.
First, the price stability mandate sets the stage. This naturally induces central banks to maintain policy accommodation, or to ease further, when inflation is below target, even when the economy appears to be close to estimates of potential. And it constrains the policy options when such a policy could have unwelcome effects on the financial side of the economy longer-term, such as by encouraging excessive risk-taking.
Second, and closely related, such an approach can help bring inflation and inflation expectations back towards target. This is especially relevant if the central bank's credibility is at stake. Succeeding in raising inflation would boost that credibility and help preserve future policy space if it prevents expectations from drifting downwards. Stabilising inflation around the target is seen as especially important when policymakers consider that the equilibrium, or so-called "natural", interest rate has fallen for reasons that have little to do with their decisions.21
Finally, such an approach is quite compelling if financial markets or segments of the financial system appear fragile. As suggested by the year under review, markets can sometimes be quite sensitive to signs of higher rates or smaller central bank balance sheets. Even in the context of benign market conditions, there is evidence that changes in balance sheet policy can have non-negligible effects on term premia (Box I.D). A sharp market reaction, and consequent outsize tightening of financial conditions, could impact the economy adversely. Furthermore, in economies with a relatively weak banking sector, the approach may reduce the risk of banks running into funding problems and curtailing credit. And if it succeeds in boosting output without raising debt burdens, it can support financial stability. The higher the uncertainty about conditions in the financial system, and the macro economy, the stronger the case for such a strategy.
At the same time, the gains from such a strategy could be associated with costs in terms of risks to longer-term macroeconomic resilience and stability and the erosion of the future room for policy manoeuvre operating mainly through financial channels.
Box I.D
The run-off of the Federal Reserve's balance sheet
In late 2017, almost two years after the first post-crisis hike in the federal funds rate, the Federal Reserve began to reduce its balance sheet, which had grown to $4.5 trillion or 23% of GDP. To minimise the risk of disruptions to bond markets and facilitate communication on the use of multiple instruments, the reduction has been carried out in a gradual and preannounced manner.
A key question concerns its impact on interest rates and real activity. One view, shared by some economists and policymakers, is that the impact should be small, unlike the documented sizeable effects of large-scale asset purchase programmes (referred to as quantitative easing or QE). This conclusion relies on some key hypotheses. First, changes in central bank reserves have no effect when financial markets are functioning properly and banks have easy access to funding - that is, under these circumstances, portfolio rebalancing effects are small or negligible. Second, the signalling effects of changes in the balance sheet also fade away once the policy rate is above its zero lower bound and rising. The signalling channel works when the policy rate is at its zero lower bound by strengthening the central bank's commitment to keeping policy rates at the lower bound for longer than otherwise expected. An opposite view is that portfolio balance effects remain economically significant even in the context of benign financial market conditions. Indeed, several studies find support for this view based on data from the pre-crisis period, when the maturity structure of public debt and hence the amount of duration risk absorbed by the market were influenced by the fiscal authority's debt management decisions. According to this view, long-term interest rates should be affected post-crisis not only by the central bank's balance sheet policies but also by the US Treasury's issuance.
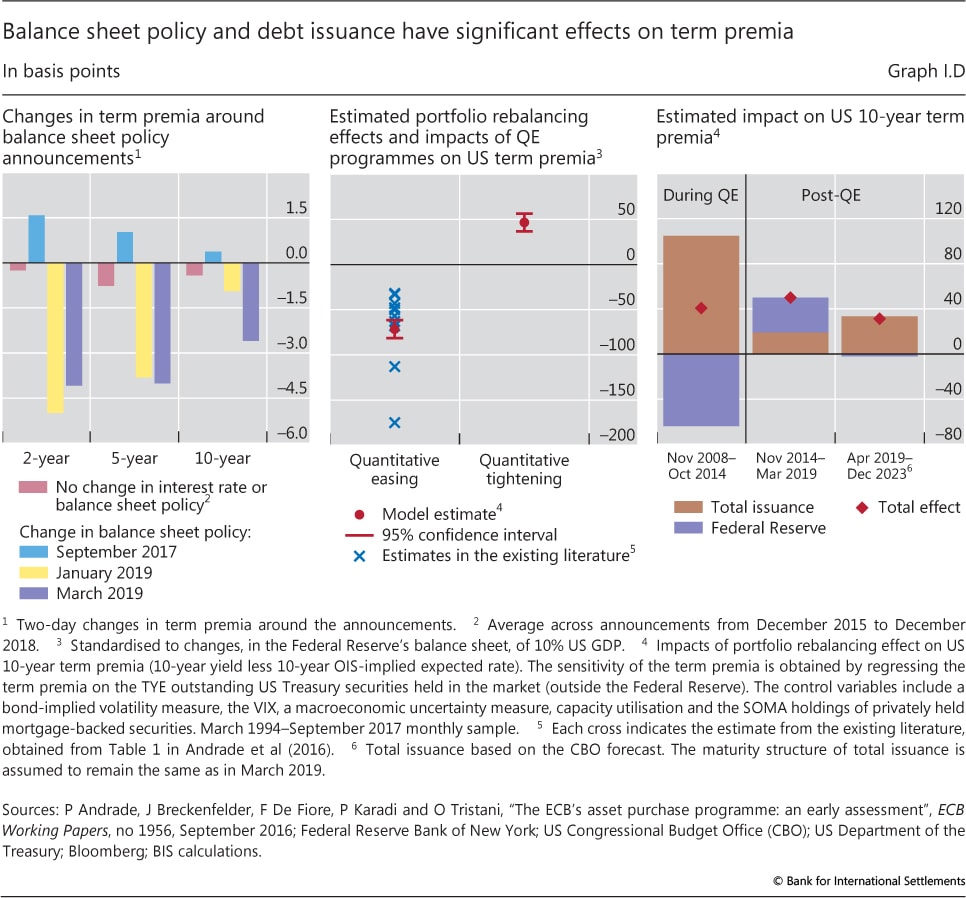
Against this backdrop, the analysis here examines the effects of changes in the balance sheet policy on term premia using both event-study and regression analysis. The focus of the event study is on the period of quantitative tightening (QT; defined here as December 2015 to March 2019). The exercise measures the impact of Federal Open Market Committee (FOMC) announcements regarding its balance sheet policy on term premia within a two-day window. The announcements are limited to windows in which there was no change in the fed funds rate. The impact is then compared with the average effect observed over FOMC announcements when neither changes in interest rate nor those in balance sheet policies were communicated. The differential impact can therefore be attributed to balance sheet policy. The first event is September 2017, when the FOMC announced that the run-off would start in October (Graph I.D, left-hand panel). The reaction of the term premia (blue bar) was mildly positive, as a fraction of market participants were expecting a later start of the run-off. Afterwards, the FOMC communicated changes in balance sheet policy in January (yellow bar) and March (purple bar) 2019. Both announcements positively surprised the market in terms of the larger size of System Open Market Account (SOMA) holdings or earlier end of the run-off, decreasing the term premia. In absolute value, these last two announcements induced statistically significant, larger changes in the term premia relative to the average impact of announcements of no change in either policy rates or the balance sheet (red bars). These results suggest that balance sheet policy can move financial markets also in periods of QT.
A regression analysis offers additional evidence pointing to sizeable effects of changes in balance sheet policy (alongside changes in debt management policy). It first converts the maturity structure of outstanding US Treasury securities held in the market (outside the Federal Reserve) into a figure labelled the ten-year equivalent (TYE) - a summary measure of the exposure of market participants to interest rate risk. The US 10-year term premium is regressed on the TYE supply measure over the period March 1994-September 2017, using a number of controls. The supply variable is interacted with a dummy indicator, which distinguishes QT periods from QE periods (the latter defined here as November 2008-November 2015) and also pre-crisis periods. As shown in the centre panel, the estimated impact of a reduction in the TYE supply of 10 percentage points of GDP is about 70 basis points during periods of QE and 50 basis points in periods of QT. The difference between the effects is statistically significant. This indicates an asymmetry in the impact of QT relative to QE, although a quantitatively small one.
Going forward, Treasury issuance should be expected to have a significant impact on long-term yields alongside the reduction of the central bank's balance sheet. During QT, the Federal Reserve's reinvestment policy tended to raise the amount of Treasuries the market had to absorb, thereby actually adding to the effect of the planned increase in US Treasury issuance. Over the period from April 2019 to December 2023, the expected increase in total issuance and a relatively stable Federal Reserve balance sheet are expected to lead to a 30 basis point increase in term premia (Graph I.D, right-hand panel). The future composition of the Federal Reserve's portfolio is under discussion. The Fed plans to invest most of the principal payments from agency mortgage-backed securities in Treasury securities with a maturity structure consistent with that of the outstanding stock. The regression result shows that the choice of reinvestment maturities is of second-order importance. Full reinvestment in two-year Treasuries would add only 6 basis points to term premia.
See eg J Bullard, "When quantitative tightening is not quantitative tightening", speech at the US Monetary Policy Forum, 22 February 2019. See V Cúrdia and M Woodford, "Conventional and unconventional monetary policy", Federal Reserve Bank of St Louis, Review, July/August 2010, pp 229-64. One argument for its effectiveness is that large holdings of long-duration assets expose the central bank to the risk of capital losses if short-term rates rise rapidly. See eg S Bhattarai, G Eggertsson and B Gafarov, "Time consistency and the duration of government debt: a signalling theory of quantitative easing", NBER Working Papers, no 21336, July 2015. For empirical evidence on the signalling channel, see eg M Bauer and G Rudebusch, "The signaling channel for Federal Reserve bond purchases", International Journal of Central Banking, vol 10, September 2014, pp 233-89. See eg R Greenwood and D Vayanos, "Price pressure in the government bond market", American Economic Review, vol 100, no 2, May 2010, pp 585-90. For a survey, see J Gagnon, "Quantitative easing: an underappreciated success", Peterson Institute for International Economics, Policy Brief 16-4, April 2016. Some studies even suggest that public debt and its maturity composition matter for financial stability. By issuing more short-term debt, the government can lower the premium on short-term money-like debt, reducing the private sector's incentives to issue it and curbing the amount of liquidity transformation in the financial system. See eg R Greenwood, S Hanson and J Stein, "A comparative-advantage approach to government debt maturity", Journal of Finance, vol 70, issue 4, August 2015, pp 1683-722. An analysis based on high-frequency data with a window of 20 minutes around the FOMC announcement shows similar effects on two- and 10-year Treasury yields. Source: Federal Reserve Bank of New York Primary Dealers Survey. The pre-crisis dummy indicators distinguish the months in which the Federal Reserve cut (increased) the policy rates and then possibly kept them constant, which correspond to an easing (tightening) period.
As regards macroeconomic resilience, one such possibility is through the negative impact that historically low-for-long interest rates may have on financial intermediation and credit supply. As discussed above, and to an extent that depends on country characteristics, over the longer term low rates tend to sap interest margins, profits and hence banks' ability to build up capital, which is essential for their lending to the productive economy.
A second possibility works through the impact of very easy and prolonged financial conditions on economic activity. There is increasing evidence that such conditions may boost growth in the near term but, depending on circumstances, could do so at the cost of higher downside risks in the longer term. For instance, they can become a drag in the future, as they raise debt service burdens and generate financial vulnerabilities, typically in the form of weaker balance sheets.22
A third possibility is that, over a longer horizon, persistently low rates may undermine efficient resource allocation and productivity. The effects can be present in the upswing, when low rates may induce resources to shift into lower productivity growth sectors during credit booms, and may also work in the downswing, when very low interest rates for prolonged periods, possibly combined with weak bank balance sheets, may delay the release of resources from less productive sectors into more productive ones.23 As noted above, the rise of zombie firms is one such example.
As regards the room for policy manoeuvre, the potential intertemporal trade-offs may materialise in two ways. First, and most directly, unless normalisation weakens growth or inflation beyond what is desirable or acceptable, it creates room to cut interest rates when needed to cushion future adverse developments. Second, and more subtly, the side effects of very accommodative policies may themselves reduce the future room for manoeuvre. They may do so by weakening the economy's ability to withstand higher rates, making any normalisation harder; and by generating financial headwinds that potentially limit policy effectiveness.24 In particular, raising rates becomes harder if debt burdens have increased and financial markets are more sensitive to monetary policy tightening after prolonged support is withdrawn.
Not only do these considerations underline how difficult a balancing act central banks face, they also raise a broader question concerning the role of monetary policy. As the GFC broke out, central banks prevented it from spiralling out of control and then successfully supported the recovery. At the same time, as discussed in last year's Annual Economic Report, following serious financially induced downturns and given stubbornly subdued inflation, there are diminishing returns and costs in relying too much on monetary policy. Such an overburdening can contribute to the re-emergence of financial vulnerabilities and reduce the room for policy manoeuvre. It becomes natural to ask where the limits to this approach are. Ostensibly, monetary policy cannot be the engine of higher sustainable economic growth. More realistically, it may be better regarded as a backstop.
Towards a more balanced policy mix
Looking ahead, these considerations suggest that a more balanced policy mix can contribute more effectively to sustainable growth and financial stability. It can also help steer the economy towards the clearer skies that can be discerned after such a prolonged and at times uncertain recovery. And it would facilitate a shift away from the debt-fuelled growth model on which the global economy appears to have relied for so long.
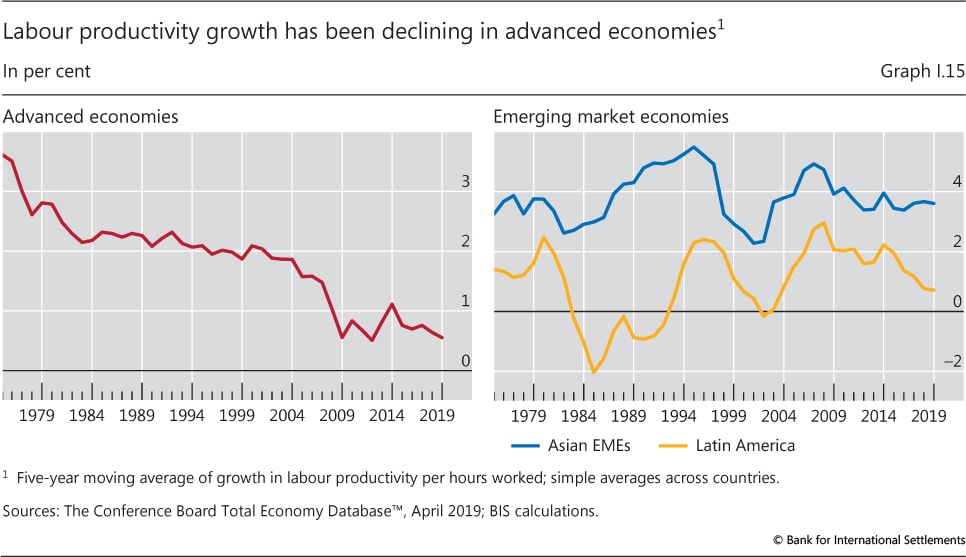
The only way to raise long-term growth on a sustainable basis is to implement structural reforms. Indeed, productivity growth has been on a long-term downward trend in advanced economies (Graph I.15).25 Rather disappointing growth at a time when economies are hovering around estimates of potential and experiencing unemployment at multi-decade lows underlines this point.
Unfortunately, over the past decade, the momentum in structural reforms has been lost, as the sense of urgency associated with the GFC has faded. Most ominously, the emergence of trade tensions has cast a dark cloud over the multilateral trading system that has underpinned global growth and productivity for decades. The important area in which structural efforts have proceeded apace is in the financial sector, where (micro) prudential regulation and supervision have been upgraded, not least through the implementation of Basel III. But beyond that, is there a role for macroprudential measures and fiscal policy at more cyclical frequencies?
Macroprudential measures can help alleviate trade-offs.26 Post-crisis, most countries have made considerable progress in implementing macroprudential frameworks, with tools ranging from system-wide stress tests and countercyclical capital requirements to maximum loan-to-value and debt-to-income ratios. The measures can be usefully activated to limit the build-up of financial vulnerabilities or cushion the blow when financial cycles turn. Thus, in current circumstances, and more generally, they provide an extra degree of freedom to monetary policy. They have the advantage that they can be more targeted, addressing specific risks and vulnerabilities, such as those arising in the corporate or mortgage sector. Of course, they are no panacea. Their activation is typically subject to significant political economy constraints and, given the limited regulatory perimeter - in most countries mainly confined to banks - they are vulnerable to regulatory arbitrage. Moreover, they cannot be expected, on their own, to tame financial cycles, especially where they work at cross purposes with monetary policy.
Fiscal authorities, too, can help in various dimensions. Provided sufficient fiscal space is available, targeted fiscal expansions may usefully support the economy if the need arises. The desirability of policy action will also depend on other country-specific circumstances, including their external balance position. In general, the most effective fiscal measures are of a structural nature, such as making the tax system and - where productive opportunities exist - the composition of spending more growth-friendly, especially by boosting well chosen infrastructure investments. In the process, it is important to avoid the risk of once more behaving asymmetrically - easing during downturns, or even pre-emptively, while not consolidating during expansions. This is one reason why the room for fiscal policy manoeuvre has been diminishing over time.
Endnotes
1 World trade grew by 4.7% in 2017, well above its post-GFC average of around 3%. According to the World Trade Organization (WTO), three factors account for this outcome: (i) the low base from which trade increased; (ii) the acceleration of fixed capital investment, which is trade-intensive; and (iii) an unexpected large pickup in consumption in Japan. See WTO, World Trade Statistical Review 2018.
2 Data are generally patchy, and analytical models that could help disentangle the relevant mechanisms are generally too abstract or incomplete, especially in describing the financial side of the economy, to reach precise conclusions. In particular, they generally do not incorporate the intertemporal trade-offs implied by macro-financial links and may therefore underestimate the negative medium-term effects of short-run easier financial conditions. See eg T Adrian, F Grinberg, N Liang and S Malik, "The term structure of growth-at-risk", IMF Working Papers, no WP/18/180, July 2018.
3 See V Bruno, S-J Kim and H S Shin, "Exchange rates and the working capital channel of trade fluctuations", AEA Papers and Proceedings, vol 108, May 2018, pp 531-36; and V Bruno and H S Shin, "Dollar exchange rate as a credit supply factor: evidence from firm-level exports", 2019, mimeo.
4 See C Borio, M Drehmann and D Xia, "The financial cycle and recession risk", BIS Quarterly Review, December 2018, pp 59-71.
5 Excluding financial firms, the shares have increased from 21% to 48% in Europe and from 30% to 34% in the United States.
6 The shares are lower elsewhere, at around 20% in Latin America and smaller advanced economies, and 16% in the euro area.
7 This figure is based on net leverage ratios, which take into account firms' cash holdings. To account for the limited expected profitability of zombie firms, the definition of zombie firms considers only firms whose Tobin's q is lower than the median within their sector in any given year. For an analysis of zombie firms, see also M Adalet McGowan, D Andrews and V Millot, "The walking dead? Zombie firms and productivity performance in OECD countries", Economic Policy, vol 33, issue 96, October 2018, pp 685-736; and R Banerjee and B Hofmann, "The rise of zombie firms: causes and consequences", BIS Quarterly Review, September 2018, pp 67-78.
8 See also F Schivardi, E Sette and G Tabellini, "Credit misallocation during the European financial crisis", BIS Working Papers, no 669, December, 2017; M Storz, M Koetter, R Setzer and A Westphal, "Do we want these two to tango? On zombie firms and stressed banks in Europe", ECB Working Papers, no 2104, October 2017; C Borio and B Hofmann, "Is monetary policy less effective when interest rates are persistently low?", BIS Working Papers, no 628, April 2017; and D Andrews and F Petroulakis, "Breaking the shackles: zombie firms, weak banks and depressed restructuring in Europe", ECB Working Papers, no 2240, February 2019.
9 Using data for both listed and non-listed firms, Adalet McGowan et al (2018), op cit, report higher capital-weighted zombie shares.
10 The macroeconomic effects of zombie firms are found to be economically large in some euro area countries. See V Acharya, T Eisert, C Eufinger and C Hirsch, "Whatever it takes: the real effects of unconventional monetary policy", The Review of Financial Studies, forthcoming.
11 See also BIS, "The financial sector: post-crisis adjustment and pressure points", Annual Economic Report, June 2018, Chapter III.
12 See eg I Fender and U Lewrick, "Adding it all up: the macroeconomic impact of Basel III and outstanding reform issues", BIS Working Papers, no 591, November 2016.
13 See eg L Gambacorta and H S Shin, "Why bank capital matters for monetary policy", BIS Working Papers, no 558, April 2016.
14 The countercyclical capital buffer was omitted from the capital requirements because regulators can release it in downturns. The release after the Brexit vote in the United Kingdom is an example. Furthermore, banks face additional capital requirements (through Pillar 2 in Europe and stress tests in the United States) which might impose higher effective capital adequacy standards than Pillar 1 requirements. These additional requirements could lower the observed distance from Pillar 1 regulatory minima.
15 See C Borio, L Gambacorta and B Hofmann, "The influence of monetary policy on bank profitability", BIS Working Papers, no 514, October 2015; also published in International Finance, vol 20, issue 1, spring 2017.
16 To the extent that monetary easing can boost economic activity, it also supports bank profitability. But, unlike structural reforms, monetary policy cannot lift output on a sustainable basis.
17 See eg C Borio, B Vale and G von Peter, "Resolving the financial crisis: are we heeding the lessons from the Nordics?", BIS Working Papers, no 311, June 2010.
18 See eg B Bogdanova, I Fender and E Takáts, "The ABCs of bank PBRs", BIS Quarterly Review, March 2018, pp 81-95.
19 See C Borio, R McCauley and P McGuire, "FX swaps and forwards: missing global debt?", BIS Quarterly Review, September 2017, pp 37-54.
20 See eg P McGuire and G von Peter, "The US dollar shortage in global banking and the international policy response", BIS Working Papers, no 291, October 2009.
21 This is the predominant view; see eg R Caballero, E Farhi and P Gourinchas, "The safe assets shortage conundrum", Journal of Economic Perspectives, vol 31, no 3, Summer 2017, pp 29-46; C Carvalho, A Ferrero and F Nechio, "Demographics and real interest rates: inspecting the mechanism", European Economic Review, vol 88, September 2016, pp 208-26; L Rachel and T Smith, "Are low real interest rates here to stay?", International Journal of Central Banking, vol 13, September 2017, pp 1-42; and L Summers, "Low real rates, secular stagnation & the future of stabilization policy", speech at the Bank of Chile Research Conference, 20 November 2015. In contrast to the predominant view, a number of studies find a tenuous or no relationship with real variables, suggesting a role for monetary policy in the determination of long-run real interest rates. See eg J Hamilton, E Harris, J Hatzius and K West, "The equilibrium real funds rate: past, present, and future," IMF Economic Review, vol 64, November 2016, pp 660-707; K Lunsford and K West, "Some evidence on secular drivers of safe real rates", 2017, mimeo; and C Borio, P Disyatat, M Juselius and P Rungcharoenkitkul, "Why so low for so long? A long-term view of real interest rates", BIS Working Papers, no 685, December 2017.
22 See eg T Adrian, N Boyarchenko and D Giannone, "Vulnerable growth", American Economic Review, vol 109, no 4, April 2019, pp 1263-89; Borio, Drehmann and Xia (2018), op cit; M Juselius, C Borio, P Disyatat and M Drehmann, "Monetary policy, the financial cycle, and ultra-low interest rates", International Journal of Central Banking, vol 13, September 2017, pp 55-89; and M Drehmann, M Juselius and A Korinek, "Accounting for debt service: the painful legacy of credit booms", BIS Working Papers, no 645, June 2017.
23 For the evidence on credit booms and their aftermath, see eg G Gopinath, S Kalemli-Ozcan, L Karabarbounis and C Villegas-Sanchez, "Capital allocation and productivity in South Europe", Quarterly Journal of Economics, vol 132, no 4, November 2017, pp 1915-67; G Gorton and G Ordoñez, "Good booms, bad booms", Journal of European Economic Association, January 2019; B Richter, M Schularick and P Wachtel, "When to lean against the wind", CEPR Discussion Papers, no 12188, July 2017; V Asriyan, L Laeven and A Martin, "Collateral booms and information depletion", ECB Working Papers, no 2266, April 2019; S Doerr, "Collateral, reallocation and aggregate productivity: evidence from the US housing boom", University of Zurich Open Repository and Archive, June 2018; and C Borio, E Kharroubi, C Upper and F Zampolli, "Labour reallocation and productivity dynamics: financial causes, real consequences", BIS Working Papers, no 534, January 2016. For the impact of low rates on reallocations, especially during phases of needed balance sheet repair, see above.
24 There is increasing evidence that the effectiveness of policy depends on the state of the financial cycle. Persistently low rates, for example, can reduce the amount of remaining mortgages for which there would be an incentive to refinance when rates are cut again down the road; see D Berger, K Milbradt, F Tourre and J Vavra, "Mortgage prepayment and path-dependent effects of monetary policy," NBER Working Papers, no 25157, December 2018. The authors illustrate this mechanism in the case of the United States, showing that monetary policy stimulus depends on both current and past rates, with easing being less effective if previous rates were low. D Aikman, A Lehnert, N Liang and M Modugno, "Credit, financial conditions and monetary policy transmission", Hutchins Center Working Papers, no 39, November 2017, also show that the impact of policy easing is muted when the debt-to-GDP ratio is above trend. For a review of the empirical evidence, see Borio and Hofmann (2017), op cit.
25 The decline in productivity growth is a long-term phenomenon that predates the GFC. Due to structural impediments and slower innovation diffusion, productivity has declined faster and remained stagnant in a number of countries. See eg G Cette, J Fernald and B Mojon, "The pre-Great Recession slowdown in productivity", European Economic Review, vol 88, September 2016, pp 3-20.
26 See BIS, "Moving forward with macroprudential frameworks", Annual Economic Report, June 2018, Chapter IV.