The OTC interest rate derivatives market in 2013
This feature analyses the market for OTC interest rate derivatives using data from the Triennial Central Bank Survey. Low and stable interest rates after the financial crisis went hand in hand with low but still positive turnover growth in most currencies. The increase was entirely driven by a larger volume of contracts with financial institutions other than dealers. The share of inter-dealer trades has shrunk to 35%, the lowest since the survey's inception. Despite rapid growth in emerging market currencies, trading remains concentrated in major currencies and financial centres. Changes in regulation have led to more contracts being centrally cleared.1
JEL classification: E43, G15, G23.
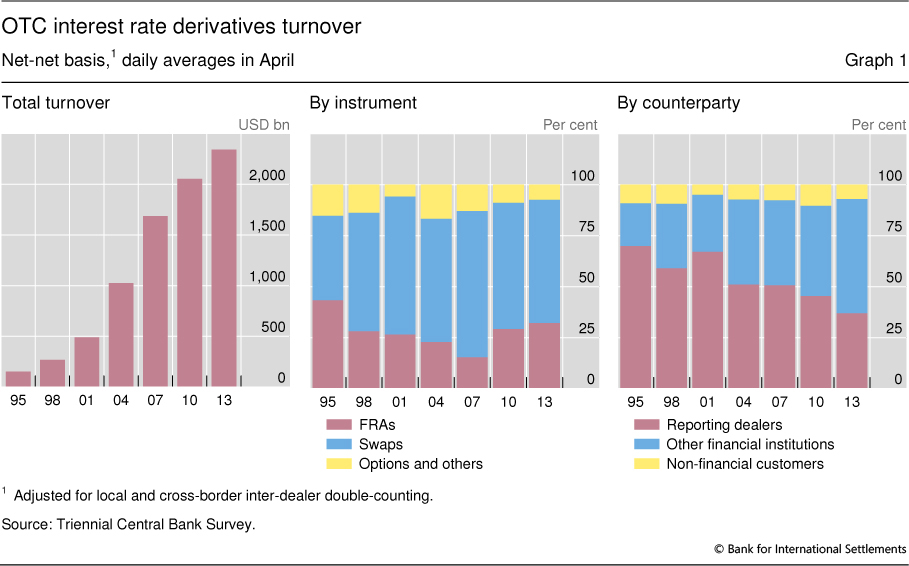
After growing rapidly prior to the financial crisis, activity in the market for over-the-counter (OTC) interest rate derivatives, such as swaps and forward rate agreements (FRAs), has since expanded at a more moderate pace. Even so, daily turnover averaged $2.3 trillion in April 2013, 14% higher than three years before (Graph 1, left-hand panel).
Activity in this market remains opaque. Admittedly, transparency has improved from the mid-1990s, when central banks expanded their regular survey of activity in foreign exchange markets to also cover turnover and amounts outstanding in OTC interest rate derivatives. And data warehouses and clearing houses provide some data on the transactions they process. Even so, the Triennial Survey remains to date the most comprehensive source of information.
This special feature uses data from the latest Triennial Survey, covering April 2013, to shed light on the structure of the OTC interest rate derivatives market and to analyse the main drivers for activity. We find that low and stable interest rates after the financial crisis have gone hand in hand with low but still positive turnover growth in most currencies. A larger volume of contracts with financial institutions other than dealers coincided with declining inter-dealer activity, causing the share of inter-dealer trades to shrink to 35%, the lowest since the inception of the Survey. The volume of transactions with non-financial firms also declined. Despite rapid growth in emerging market currency activity, trading remained concentrated in major currencies and financial centres. Changes in regulation have resulted in more contracts being centrally cleared.
The first section briefly reviews the main instruments, currencies, trading locations and players in this market. In the second section, we look at some of the potential reasons for the slowdown in turnover growth. The final section concludes.
The OTC interest rate derivatives market in April 2013
As interest rates deeply influence the performance of both financial and non-financial firms, the enormous size of markets for derivatives that facilitate their hedging and reallocation should come as no surprise. With an average of $7.4 trillion per trading day in April 2013, total turnover in interest rate derivatives, including both exchanges and OTC markets, was well above the $5.5 trillion traded in the FX segment.2
OTC contracts account for only one third of turnover in the interest rate segment but make up the bulk of the open positions. Notional amounts outstanding of OTC interest rate derivatives stood at $561 trillion in mid-2013, far above the $62 trillion of open interest on the international derivatives exchanges. This discrepancy reflects differences in the structure of the two markets and in the maturity of the contracts. Exchange-traded futures and options tend to have much shorter maturities than OTC derivatives. Shorter maturity increases turnover relative to outstanding amounts. Furthermore, on an exchange, offsetting positions are routinely netted out. In contrast, OTC market contracts tend to "pile up". As a result, OTC market participants end up with a large number of offsetting or partially offsetting contracts, resulting in a high total notional amount relative to both turnover and net exposure. That said, this difference between exchange-traded and OTC markets has diminished as market participants make increased use of multilateral termination services to trim the size of their derivatives book (Ledrut and Upper (2007)).
While turnover in OTC interest rate derivatives expanded rapidly up to 2007, growth slowed noticeably after the financial crisis. The annual compound rate of turnover growth fell from well over 20% between 1995 and 2007 to 6% in the subsequent six years (Graph 1, left-hand panel). Turnover growth has varied across instruments. Turnover growth in FRAs (26%) across all currencies outstripped that in swaps (11%). The trading volumes of options contracted slightly, by 4%.
Interest rate swaps remain the most heavily traded contract in the OTC interest rate segment, followed by forward rate agreements (FRAs) and interest rate options (Graph 1, centre panel). The share of interest rate swaps in total turnover stood at 60% in the 2013 survey. This is well below its share on the eve of the crisis, in 2007 (72%), but is in line with the values recorded in previous surveys. The share of FRAs expanded from 15% in 2007 and 29% in 2010 to 32% in 2013, while that of options and other products fell to 7%.
Declining role of inter-dealer trading
A relatively small number of major derivatives dealers have dominated the OTC derivatives market since its inception in the 1980s. These dealers continue to be important as counterparties for other market participants, but the share of inter-dealer trading is falling. In April 2013, transactions between dealers accounted for only 35% of turnover, down from 44% in 2010 and a peak of 66% in 2001 (Graph 1, right-hand panel). It is an open question whether this reflects a reduction in proprietary trading in response to regulatory changes, or increasing market concentration, or changes in how dealers offset the risk from their client positions.
The declining share of inter-dealer trading has coincided with a surge in transactions with other financial institutions. This rather diverse group accounted for 58% of total turnover in April 2013, up from 46% in the previous survey. In addition to smaller banks outside the survey's reporting population, it includes institutional investors such as mutual and pension funds as well as insurance companies, hedge funds and special purpose vehicles.
Non-financial customers continue to play a relatively minor role in this market. This group, which includes non-financial corporations and governments, was on one side of a mere 7% of all trades, roughly in line with the average of past surveys. Non-financial entities trade predominantly interest rate swaps ($139 billion), followed by FRAs ($16 billion) and interest rate options and other products ($13 billion).
High currency concentration despite rapid growth in EME currencies
Trading in OTC interest rate derivatives is still highly concentrated in a small number of currencies. Turnover in euros went up by 37%, lifting the share of this currency to just under one half of global interest rate turnover (Table 1). Turnover in contracts on US dollar interest rates remained stable. As a consequence, the share of the dollar in global turnover fell to 28%. The markets for listed futures and options are approximately the same size: $1.8 trillion for the euro and $2.1 trillion for the dollar. Sterling kept its place as the third most important currency, with a market share of 8% despite a 13% fall in activity.
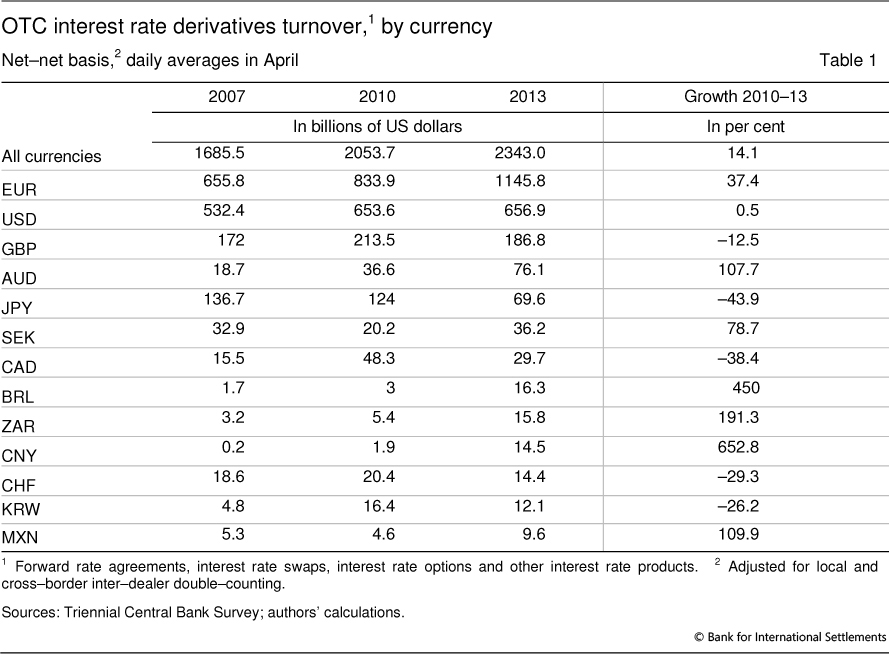
The importance of the other advanced economy currencies has gradually changed over the years. Rapid growth in contracts on Australian and Swedish rates contrasted with lower activity in most other advanced economy currencies. Turnover in Australian dollar-based contracts even overtook trading in yen-denominated derivatives.
Another notable development of the last few years has been the surge in turnover in emerging market currency contracts - albeit from a comparatively low base (see Ehlers and Packer (2013)). The surge in turnover was most notable for the Brazilian real, the South African rand and the Chinese renminbi. The turnover levels are, however, still much lower than those for the top three currencies.
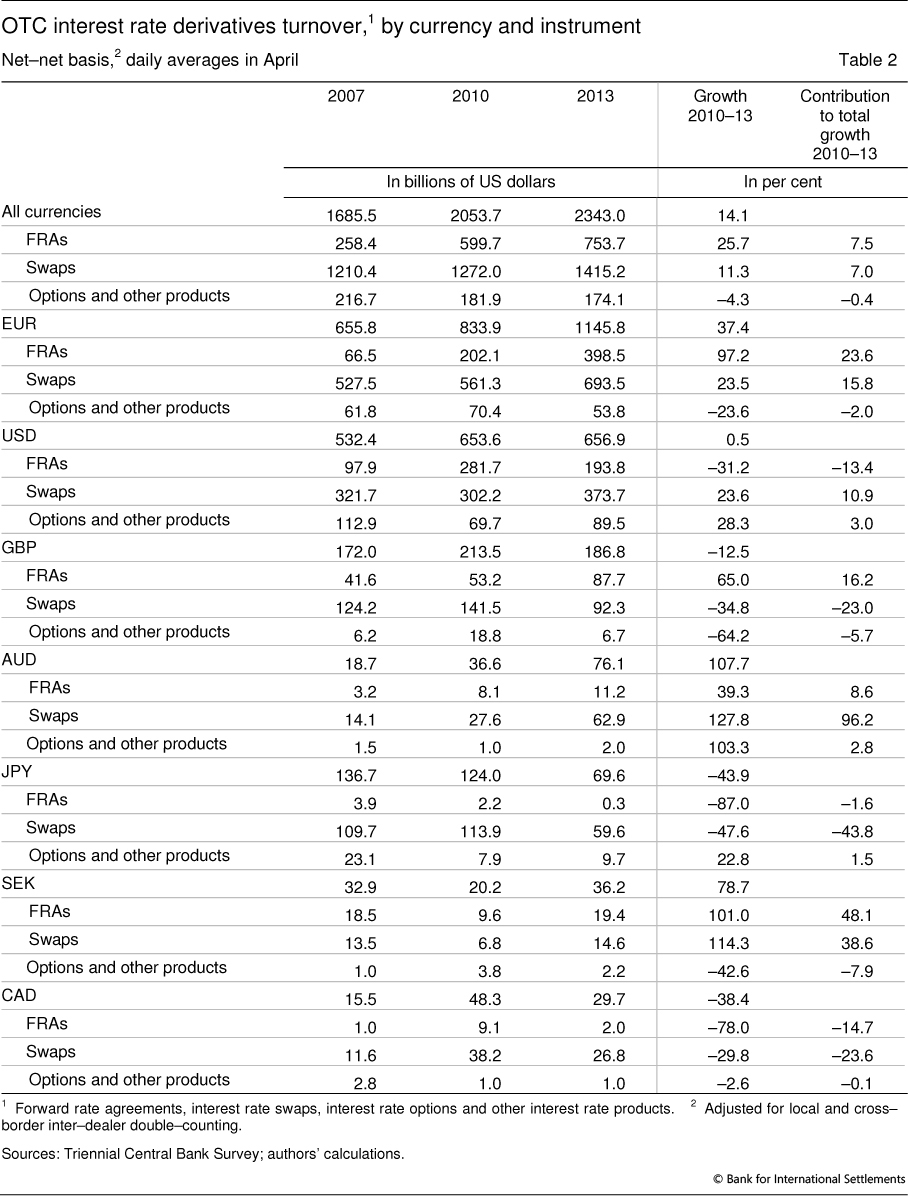
Turnover growth also varied greatly across currencies by instrument. In the FRA market, rapid turnover increases in contracts on euro and sterling interest rates contrasted with lower volumes in US dollar contracts (Table 2). In the swap market, turnover increased by just under one quarter in both the euro and dollar segments, whereas activity in sterling and yen-denominated contracts declined sharply.
A globalised market
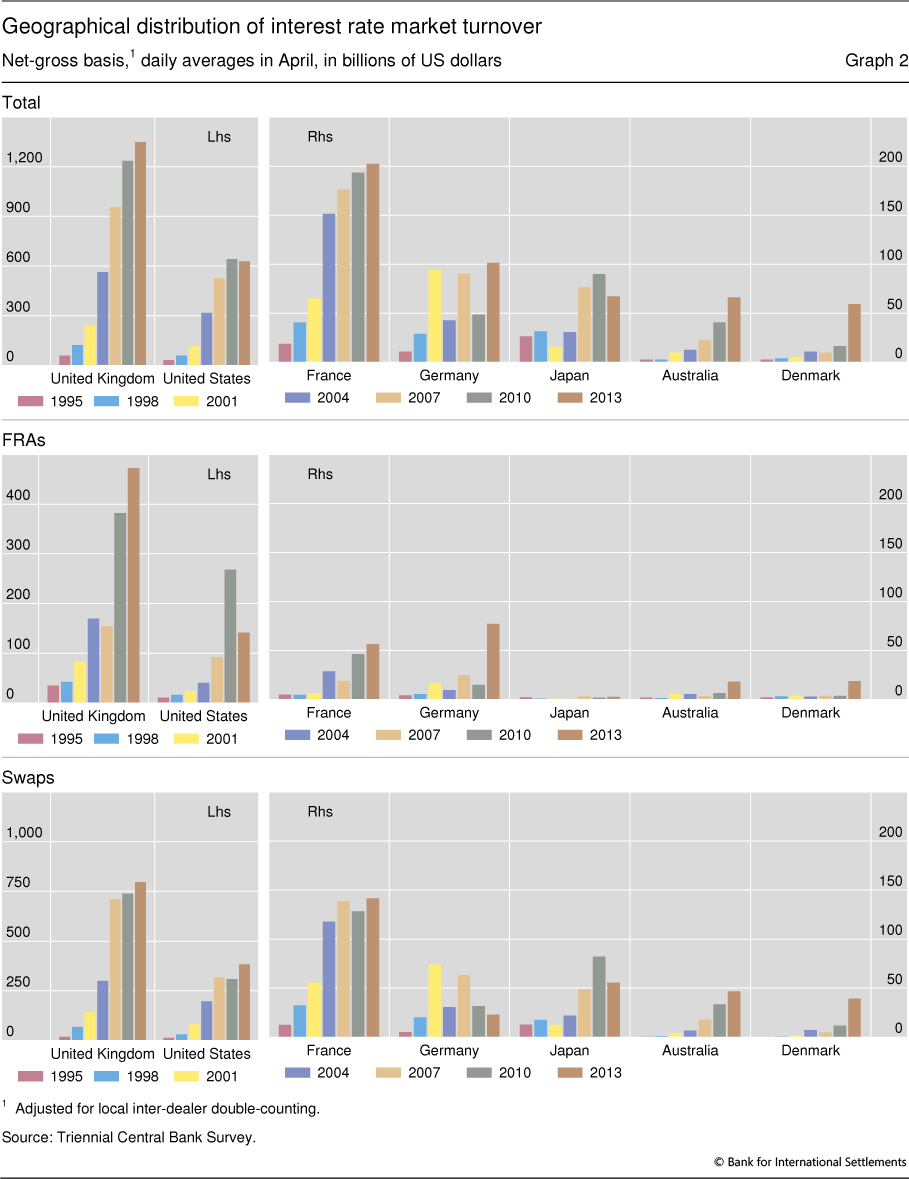
Trading is also highly concentrated geographically. Just under one half of the global total was traded via sales desks located in the United Kingdom and another 23% in the United States (Graph 2, top panel).3 In continental Europe, turnover in France reached $202 billion, and $101 billion in Germany. France has a strong position in trading swaps, whereas Germany is particularly strong in FRAs (Graph 2, centre and bottom panels). Turnover in Denmark surged from $16 billion in April 2010 to $59 billion three years later. Of this, $48 billion is in euro-denominated contracts. Danish financial institutions often use derivatives on euro interest rates to hedge exposures in Danish kroner, as they believe that the greater liquidity of the euro market outweighs the potential currency risk.
In the Asia-Pacific region, turnover in Japan stood at $67 billion, just ahead of Australia's $66 billion. Singapore and Hong Kong SAR traded to the tune of $37 billion and $28 billion, respectively. Turnover in other regions was far lower. Trading volumes in South Africa, the largest financial centre in Africa, reached $11 billion. And all Latin American centres combined traded $6 billion, which is well below the $32 billion turnover in contracts denominated in Latin American currencies.
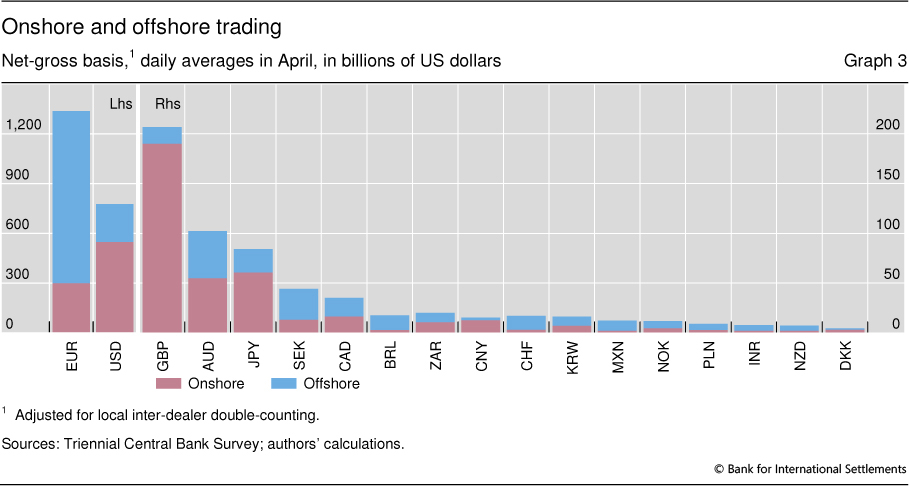
Contracts in most currencies are more heavily traded outside than inside their country, reflecting the market's global character. The bulk of transactions in contracts denominated in currencies as diverse as the Brazilian real, Mexican peso, Swiss franc and the euro are traded offshore (Graph 3). Paradoxically, the least internationalised currencies include the British pound and the US dollar, the home currencies of the two largest financial centres. Other currencies mostly traded in the home country are the Chinese renminbi (81% onshore trading), the Japanese yen (72%) and the Danish kroner (70%).
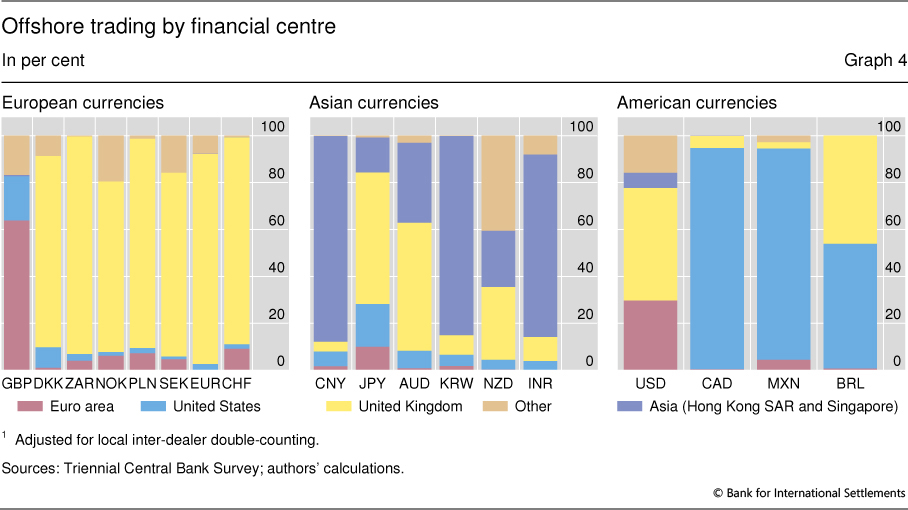
The home country's time zone helps explain in which offshore centre currencies are traded. The United Kingdom dominates offshore trading in European currencies and the South African rand (Graph 4, left-hand panel). Contracts on Latin American interest rates are traded mainly in the United States (Graph 4, right-hand panel) and those on Asian rates in Hong Kong and Singapore (Graph 4, centre panel). But there are exceptions. The United Kingdom is only slightly behind the United States in trading derivatives on Brazilian rates. The yen, the Australian dollar and the New Zealand dollar are more heavily traded in the United Kingdom than in the Asian centres, although there is also significant New Zealand dollar activity in Australia.
Central clearing
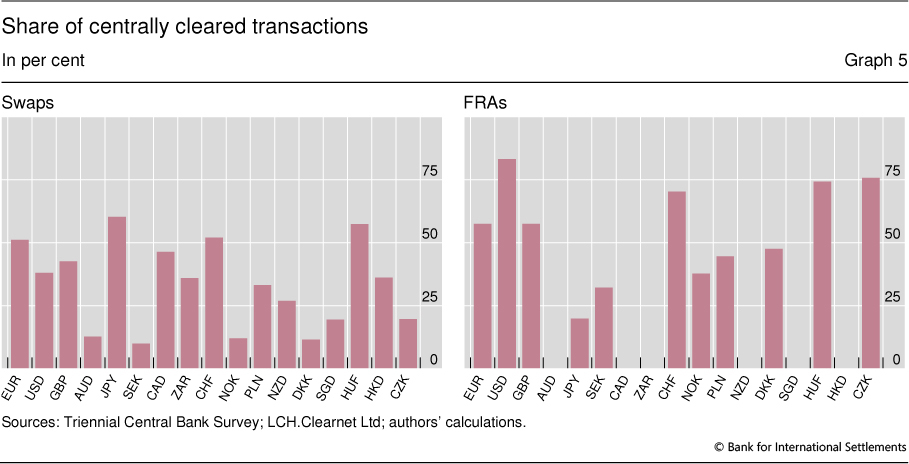
A significant change in the OTC interest rate derivatives market post-crisis is the increasing role of central clearing. Answers to a supplementary Triennial Survey question indicate that 57% of all FRAs and 35% of all swaps are centrally cleared.4 This is roughly in line with data provided by LCH.Clearnet, the largest central counterparty in the OTC interest rate derivatives market. The LCH.Clearnet data show significant dispersion of the share of centrally cleared contracts across currencies (Graph 5), although this could in part reflect variations in their market share.
Drivers of turnover growth
What explains the slowdown in turnover growth after the financial crisis? And what explains the sizeable differences in growth across currencies and instruments? In this section we seek some clues in recent regulatory developments and the various motives for trading interest rate derivatives. We will focus mostly on the variation of growth across currencies. A more thorough analysis of the time series dimension requires better data and will thus be left for future research.
Transforming interest rate exposures and costs
OTC interest rate derivatives, particularly swaps, allow both borrowers and lenders to manage their interest rate exposures and costs without directly adjusting the underlying assets and liabilities.
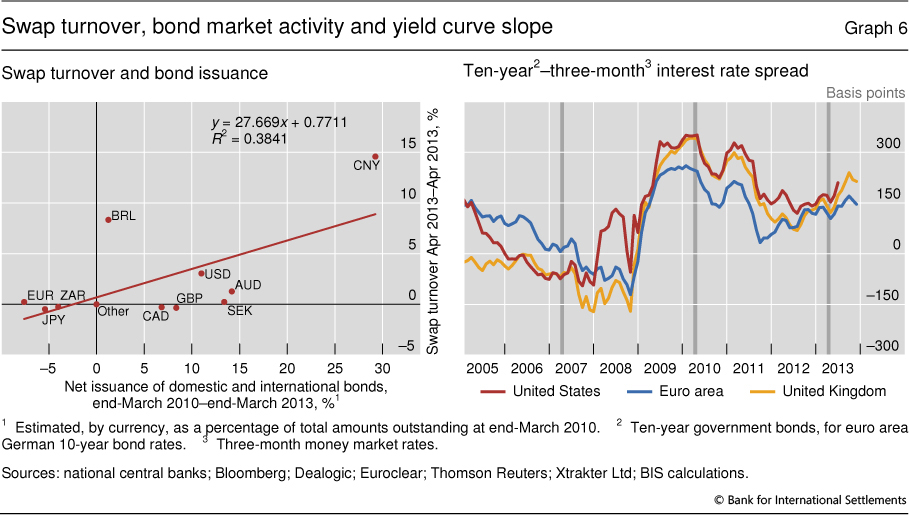
Evidence suggests that banks and non-financial firms that rely more on debt than equity financing are also more active users of interest rate swaps (Faulkender (2005), Purnanandam (2007)).5 The relatively low growth in swap turnover may reflect the relatively moderate increase in the volume of outstanding bonds between 2010 and 2013 compared with earlier periods. Our best estimate of the nominal amounts of all outstanding bonds went up by 4% to just under $100 trillion at the end of March 2013, compared to an increase of 28% between 2007 and 2010.6 The importance of the bond market's size as a determinant for swap turnover is confirmed at the currency level, where we find a positive correlation between the growth of the volume of bonds outstanding and the increase in swap turnover (Graph 6, left-hand panel).
The more moderate growth in swaps may also have been driven by the yield curve flattening for major currencies between 2010 and 2013 (Graph 6, right-hand panel). This follows from evidence that swap market activity depends on the spread between long-term and short-term interest rates (Chernenko and Faulkender (2011)). Banks, partly due to regulatory demands, use swaps to actively manage the maturity gap on their balance sheet. The flatter yield curve should reduce the incentive to enter swaps that receive long-term fixed rates and pay floating rates.
Corporate borrowers typically use swaps to manage the interest rate exposure of their liabilities. Here the reduced relative cost of borrowing long-term at fixed rates could have increased the incentive to swap floating rate liabilities such as syndicated loans into long-term fixed rates. At the same time, non-financial corporations have increasingly turned to the bond market to raise long-term fixed rate funds (BIS (2013)), which reduces the need for swaps as a means of locking in long-term rates. The falling volume of interest rate swaps and other instruments with non-financial corporations suggests that the second factor has dominated in recent years.
Swaps and other rate derivatives are also used by bond investors to manage the interest rate exposures of their portfolios. Portfolio managers often use derivatives to implement overlay strategies, by which a portfolio's interest rate sensitivity is managed separately from its selection of the bonds. Such overlay strategies may involve relatively frequent trading and could account for a significant fraction of swap market turnover. Turnover will, however, not depend mechanically on the size of the bond portfolios but also on the interest rate expectations of the portfolio manager.
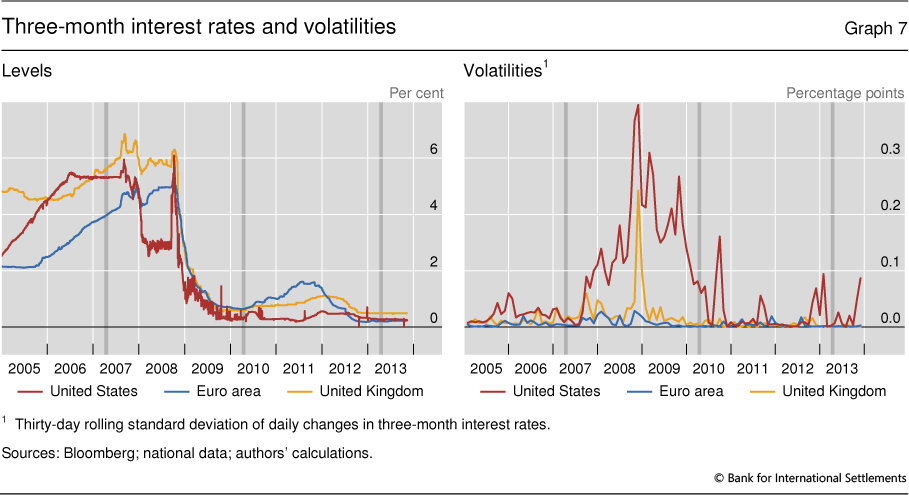
Market participants also use FRAs and options to take short-run positions and hedge short-term interest rate risk. This motivation is likely to have lost significance in the survey's last two issues. Major central banks have kept policy rates low since the financial crisis, resulting in low and stable money market rates (Graph 7, left-hand panel). Some central banks have resorted to asset purchases and forward guidance to compress longer-term rates too. As a consequence, the volatility of three-month Libor in the major advanced economy currencies is close to zero (Graph 7, right-hand panel).
The fall in both FRA and options turnover for several of the major currencies since the April 2010 survey is consistent with the decline in interest volatility. Options on short-term interest rates are the preferred instrument for taking leveraged positions on changes in policy rates. Turnover in interest rate options7 fell in most currencies, in some cases significantly. For instance, turnover volumes for options on euro and sterling interest rates shrank by 24% and 64%, respectively. That said, there were exceptions to this pattern. Turnover in options on dollar rates increased by 28% between 2010 and 2013, but this followed a steep decline in the previous three years. Developments in the OTC market were mirrored on exchanges, where turnover in interest rate options in the main currencies fell sharply.
The continued prospect of low and stable short-term rates also reduces the need for FRA contracts to hedge future interest rate changes. But rates were low and stable in all currencies with liquid FRA markets, whereas changes in turnover volumes varied significantly across currencies. Turnover volumes declined noticeably in the Japanese yen, as well as in the US and Canadian dollars. But turnover in FRAs on euro interest rates almost doubled, also increasing substantially for sterling and other European currencies despite sagging short-term interest rate volatility. This contrasts with developments on exchanges, where turnover in futures on short-term interest rates denominated in the main currencies fell between 2010 and 2013. Moreover, market sources state that April was a relatively quiet month in this market, making the observed surge even more surprising.8
Managing interest rate derivatives portfolios
The surge in turnover of FRAs on European currencies is one of the more puzzling findings of the 2013 Triennial Survey. A possible explanation may be greater use of FRAs on these instruments to manage the risk of their derivatives books (rather than the exposure of their underlying assets and liabilities).
Transaction-level data in OTC interest rate derivatives indicate that approximately two thirds of all transactions reflect "administrative activity" (Fleming et al (2012)). Some of these transactions, such as novations (in which an existing trade is transferred to a central counterparty or other third party), and some internal trades are excluded from the Triennial Survey.9
Among the administrative transactions included in the survey are FRA switches, which account for 16% of the turnover recorded by Fleming et al (2012). The rationale for such trades is that banks and other large investors tend to manage their interest rate risk on a continuous basis with swaps (see above). But liquidity in the swap market tends to be concentrated in particular expiry dates, which invariably exposes users to a small amount of basis risk whenever two offsetting swaps offer slightly different terms or settle on different days. In recent years, more active use of FRAs has helped to reduce this basis risk. According to market sources, such portfolio risk mitigation trades account for a significant proportion of turnover in the FRA market in most currencies, particularly in those where the growth in FRA activity is most pronounced.
Regulatory reform
Since the financial crisis, policymakers have significantly tightened the regulation of OTC derivatives markets. While derivatives were not the cause of the crisis, the complex and opaque network of counterparty exposures arguably both propagated and amplified financial stress. Global regulatory authorities responded by introducing a series of measures aimed at reducing counterparty risks and making OTC derivatives markets more transparent. These included mandating central clearing of OTC derivatives contracts wherever appropriate and raising the capital charges and margin requirements in other cases. In the United States, the Commodities and Futures Trading Commission published rules requiring interest rates swaps to be traded electronically on swap execution facilities (SEFs), although these rules were not yet effective at the time of the survey. Another regulatory change not directly aimed at OTC derivatives markets but still likely to affect them concerns US and EU proposals to separate investment banking operations such as proprietary trading from commercial banking.10
The longer-term impact of these regulatory reforms on turnover is not clear. Most of them, for instance the requirement that transactions be centrally cleared, affect turnover only indirectly, with effects running in both directions. For example, lower counterparty risk owing to central clearing and higher collateralisation could spur turnover, whereas higher transaction costs owing to tighter collateral requirements could reduce it. Another possible outcome is that some market participants will begin to use exchange-traded contracts - how far this is already the case is unclear. Turnover in government bond futures, which could substitute for swaps, has increased slightly between 2010 and 2013, but the data do not show any obvious shift in activity between the two types of contract.
Conclusion
The market for OTC interest rate derivatives has grown massively since its inception in the 1980s. Its structure remained stable between the late 1980s and the mid-2000s, but is now changing rapidly. This is partly the result of regulatory changes that aim to make the market more transparent and reduce counterparty risk. For instance, an increasing share of transactions is being centrally cleared. But there are also other changes, such as the declining role of the inter-dealer market. The market continues to revolve around a limited number of large dealers, but they trade less among themselves than previously. That said, the inter-dealer segment is still recognisable, in contrast to the case in the FX market (see Rime and Schrimpf (2013)).
These changes will have implications for market liquidity. Tighter regulation will make trading in this market more costly. But at the same time, it will reduce counterparty risk. How both factors will impact market liquidity remains to be seen.
The changes will also affect how OTC derivatives markets statistics will be collected. More data will be stored centrally by electronic trading platforms, central counterparties, data warehouses and trade repositories. Several jurisdictions are introducing mandatory trade reporting to regulators. All this should reduce the cost of providing market-wide information. At the same time, all these potential data sources cover only part of the market. As things stand today, they can therefore complement a more comprehensive data collection exercise such as the Triennial Survey, but not yet replace it. But this could change if the coverage of these sources increases.
Administrative trades are another factor affecting the way turnover data are collected and interpreted. A large chunk of OTC derivatives transactions are not "price-forming" trades, in the terminology of Fleming et al (2012), but administrative transactions used to manage derivatives books. At the moment, neither the Triennial Survey nor other publicly available sources differentiate between price-forming and administrative transactions. This makes it difficult to interpret the data.
References
Chernenko, S and M Faulkender (2011): "The two sides of derivatives usage: hedging and speculation with interest rate swaps", Journal of Financial and Quantitative Analysis, no 46(6), pp 1727-54.
Covitz, D and S Sharpe (2005): "Do non-financial firms use interest rate derivatives to hedge?", Federal Reserve Board, Finance and Economics Discussion Series, no 2005-39.
Ehlers, T and F Packer (2013): "FX and derivatives markets in emerging economies and the internationalisation of their currencies", BIS Quarterly Review, December.
Faulkender, M (2005): "Hedging or market timing? Selecting the interest rate exposure of corporate debt", Journal of Finance, 60(2), pp 931-62.
Fleming, M, J Jackson, A Li, A Sarkar and P Zobel (2012): "An analysis of OTC interest rate derivatives transactions: implications for public reporting", Federal Reserve Bank of New York, Staff Report, no 557.
Gambacorta, L and A van Rixtel (2013): "Structural bank regulation initiatives: approaches and implications", BIS Working Papers, no 412.
Ledrut, E and C Upper (2007): "Changing post-trading arrangements for OTC derivatives", BIS Quarterly Review, December, pp 83-95.
Rime, D and A Schrimpf (2013): "The anatomy of the global FX market through the lens of the 2013 Triennial Survey", BIS Quarterly Review, December.
1 The views expressed in this article are those of the authors and do not necessarily reflect those of the BIS or the CGFS. We are grateful to market participants, the ECB and market infrastructure providers, particularly LCH.Clearnet, for providing data and useful discussions. We thank Claudio Borio, Dietrich Domanski, Robert McCauley and Philip Wooldridge for comments. And for excellent help with the data we are deeply obliged to Magdalena Erdem and Denis Petre.
2 The Triennial Survey measures turnover and amounts outstanding in terms of notional amounts, or face value, of the contracts. Most interest rate contracts involve the exchange of interest payments calculated on the basis of the notional amount. The notional amounts as such are not exchanged.
3 The discussion of trading location is based on net-gross figures, which strip out local inter-dealer double-counting, whereas that of the previous sections was based on net-net figures, which correct for cross-border as well as local inter-dealer double-counting.
4 Based on a selection of countries accounting for 76% of global FRA and 67% of total swap turnover.
5 Some firms also use options such as interest rate caps and floors, but the corresponding volumes are an order of magnitude smaller than that of swaps. See Covitz and Sharpe (2005).
6 Data on global bond issuance in April, which could indicate the hedging activity of bond issuers, are not available. Commercial data providers, such as Dealogic, provide data at high frequencies, but cover only part of the bond market.
7 Our data do not provide a breakdown of option volume into contracts on short-term and long-term interest rates.
8 Traditionally, FRAs were used mainly by banks to lock in the cost of unsecured money market funding. But with the collapse of the unsecured term market during the financial crisis, this motivation cannot explain the recent activity in such contracts.
9 See www.bis.org/statistics/triennialrep/2013survey_guidelinesturnover.pdf.
10 See Gambacorta and van Rixtel (2013) for a review of the Volcker, Vickers and Liikanen proposals.